| Param | Original file | Final file |
|---|---|---|
| Filename | modeM0/AS1T02_002T01_9000001914_13007cztM0_level2.evt | modeM0/AS1T02_002T01_9000001914_13007cztM0_level2_quad_clean.evt |
| Size (bytes) | 506,954,880 | 125,354,880 |
| Size | 483.5 MB | 119.5 MB |
| Events in quadrant A | 3,622,430 | 836,512 |
| Events in quadrant B | 5,067,789 | 791,952 |
| Events in quadrant C | 3,059,136 | 863,329 |
| Events in quadrant D | 3,137,724 | 826,722 |
| Mode M9 | |||
|---|---|---|---|
| Quadrant | BADHDUFLAG | Total packets | Discarded packets |
| A | 0 | 13 | 0 |
| B | 0 | 13 | 0 |
| C | 0 | 13 | 0 |
| D | 0 | 14 | 0 |
| Mode M0 | |||
|---|---|---|---|
| Quadrant | BADHDUFLAG | Total packets | Discarded packets |
| A | 0 | 15488 | 3 |
| B | 0 | 19771 | 2 |
| C | 0 | 13915 | 2 |
| D | 0 | 14343 | 2 |
| Mode SS | |||
|---|---|---|---|
| Quadrant | BADHDUFLAG | Total packets | Discarded packets |
| A | 0 | 138 | 0 |
| B | 0 | 138 | 0 |
| C | 0 | 138 | 0 |
| D | 0 | 138 | 0 |
| Quadrant | Total seconds | Saturated seconds | Saturation percentage |
|---|---|---|---|
| A | 6863 | 88 | 1.282238% |
| B | 6863 | 751 | 10.942736% |
| C | 6863 | 19 | 0.276847% |
| D | 6863 | 37 | 0.539123% |
Noise dominated data is calculated using 1-second bins in cleaned event files. If a bin has >2000 counts, and if more than 50% of those come from <1% of pixels, then it is considered to be noise-dominated and hence unusable.
| Quadrant | # 1 sec bins | Bins with >0 counts | Bins with >2000 counts | High rate bins dominated by noise | Noise dominated (total time) | Noise dominated (detector-on time) | Marked lightcurve |
|---|---|---|---|---|---|---|---|
| A | 7844 | 6865 | 46 | 46 | 0.59% | 0.67% | 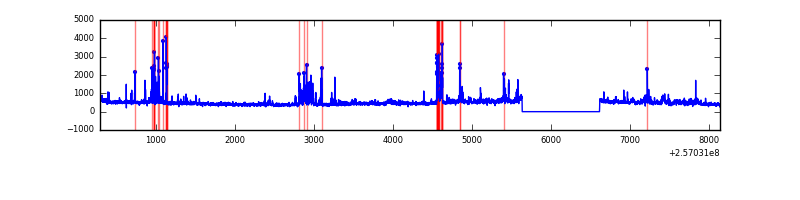 |
| B | 7844 | 6865 | 427 | 427 | 5.44% | 6.22% |  |
| C | 7844 | 6865 | 1 | 1 | 0.01% | 0.01% | 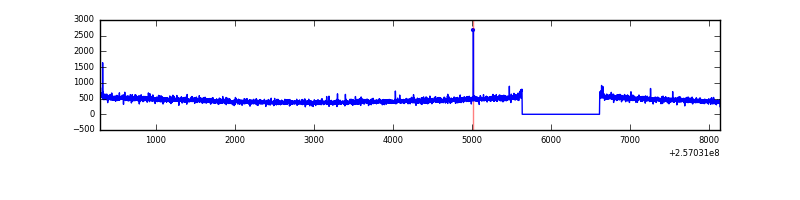 |
| D | 7844 | 6865 | 15 | 15 | 0.19% | 0.22% | 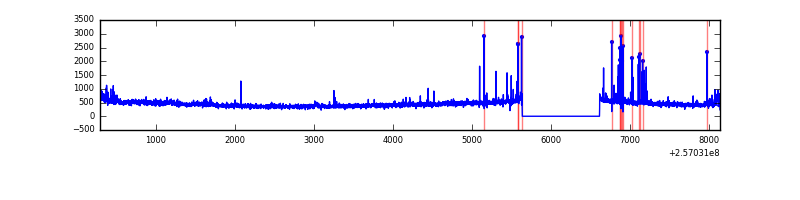 |
Top three noisy pixels from each quadrant. If the there are fewer than three noisy pixels in the level2.evt file, extra rows are filled as -1
| Pixel properties | Quadrant properties | ||||||
|---|---|---|---|---|---|---|---|
| Quadrant | DetID | PixID | Counts | Sigma | Mean | Median | Sigma |
| A | 12 | 189 | 179265 | 1131.98 | 783 | 765 | 157.7 |
| A | 13 | 248 | 165070 | 1041.96 | 783 | 765 | 157.7 |
| A | 15 | 223 | 155066 | 978.51 | 783 | 765 | 157.7 |
| B | 4 | 239 | 1401029 | 10015.41 | 743 | 724 | 139.8 |
| B | 3 | 64 | 354790 | 2532.39 | 743 | 724 | 139.8 |
| B | 10 | 245 | 117625 | 836.11 | 743 | 724 | 139.8 |
| C | 0 | 207 | 7527 | 37.39 | 782 | 785 | 180.3 |
| C | 13 | 61 | 5613 | 26.77 | 782 | 785 | 180.3 |
| C | 14 | 234 | 3071 | 12.68 | 782 | 785 | 180.3 |
| D | 1 | 52 | 182438 | 979.41 | 771 | 747 | 185.5 |
| D | 2 | 234 | 23183 | 120.94 | 771 | 747 | 185.5 |
| D | 2 | 33 | 15608 | 80.11 | 771 | 747 | 185.5 |
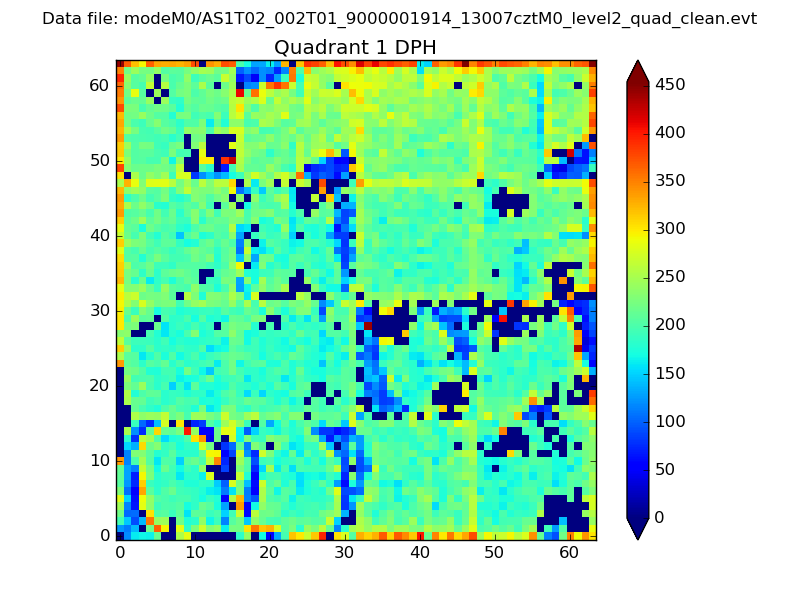
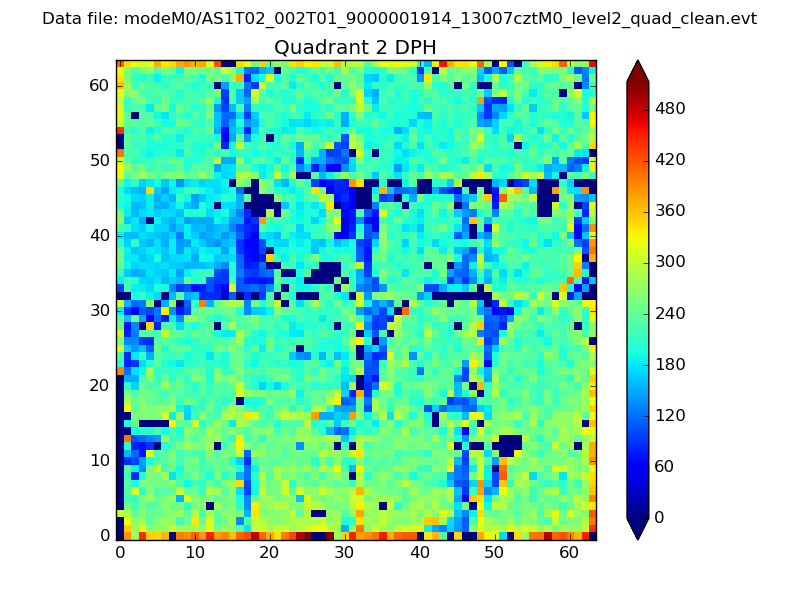
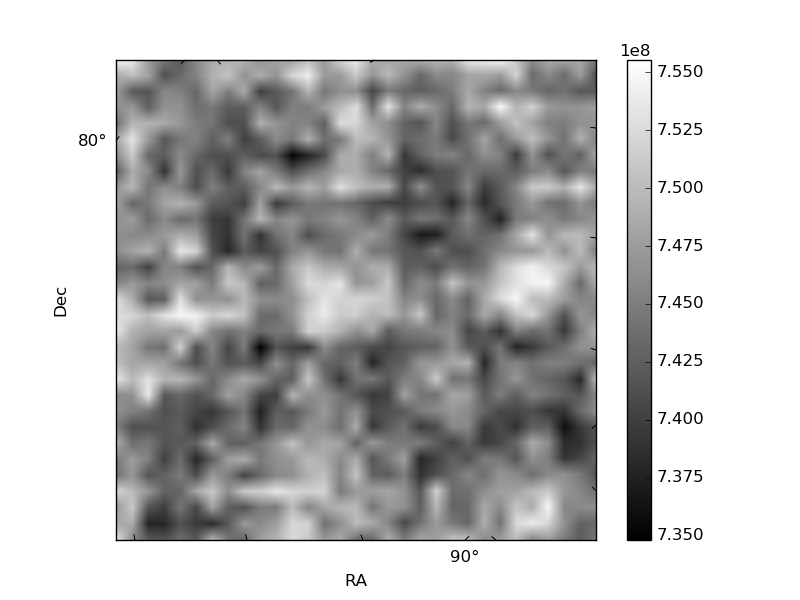
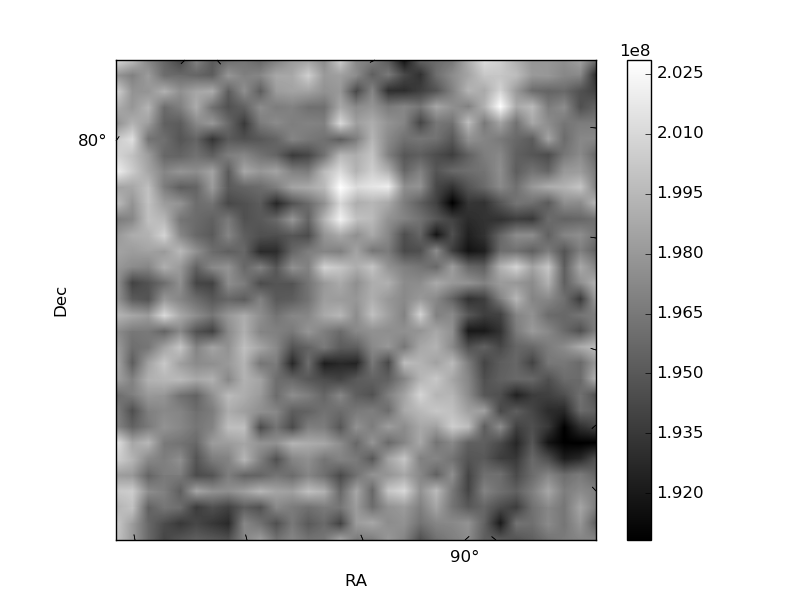
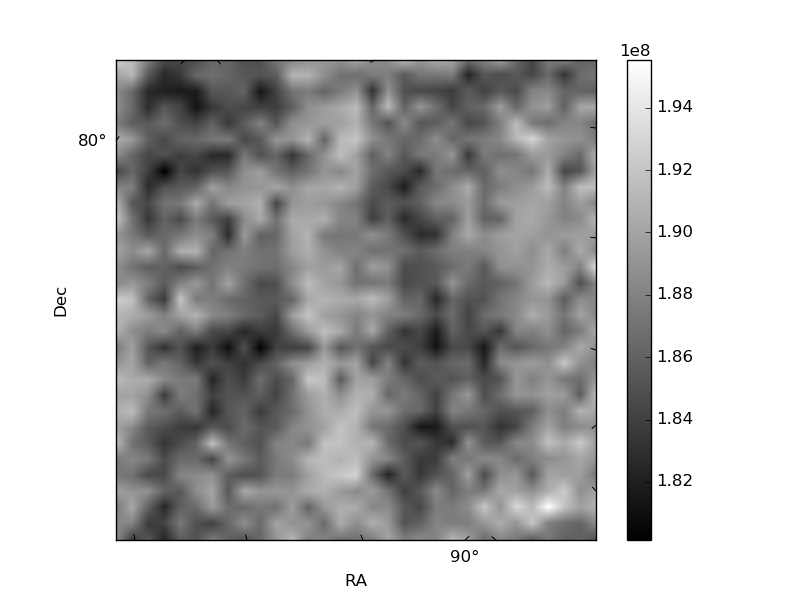
Histogram calculated using DETX and DETY for each event in the final _common_clean file
| Quadrant A | 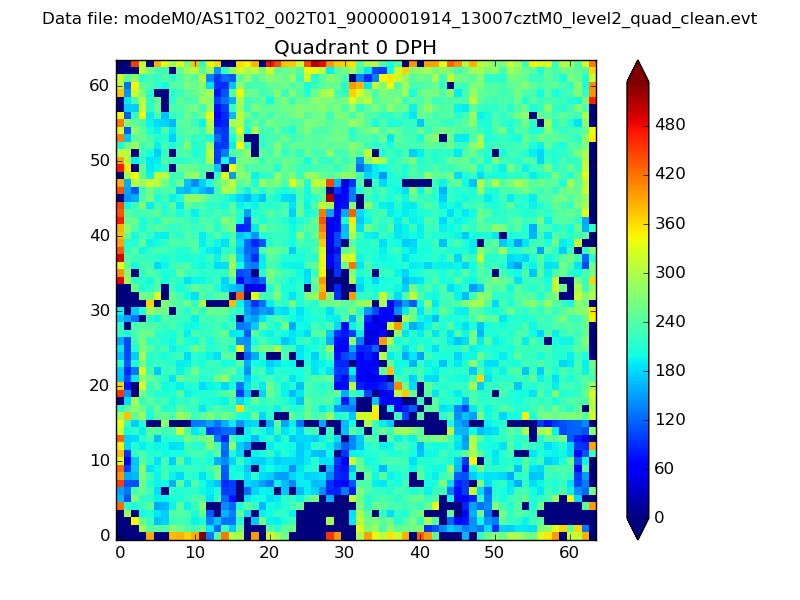 |
 |
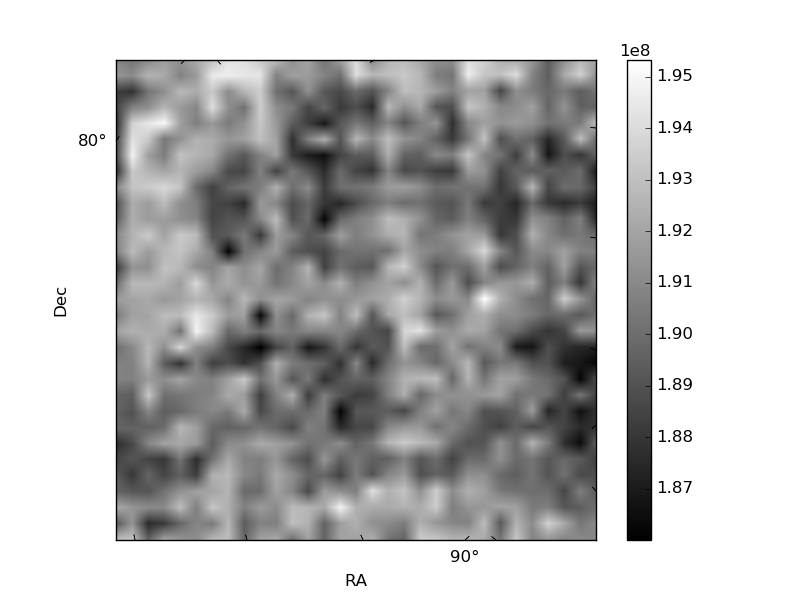
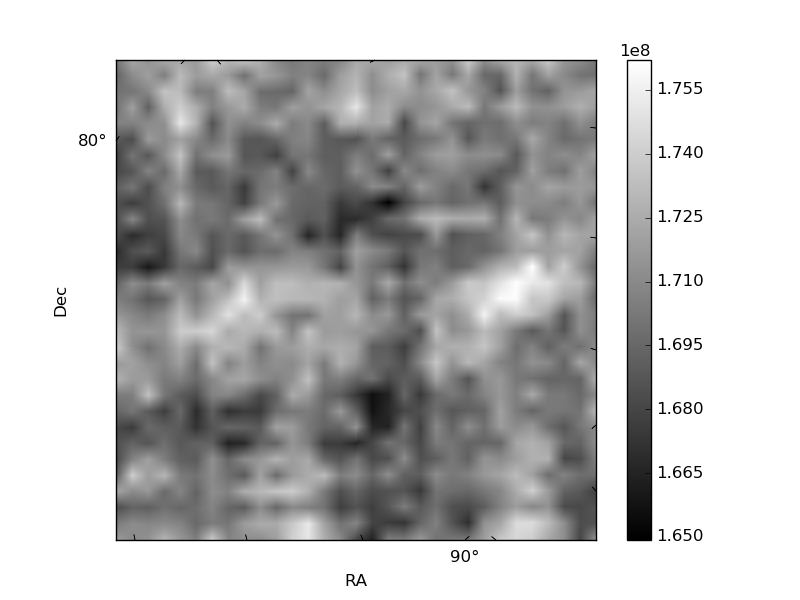
Quadrant B |
|---|---|---|---|
| Quadrant D | 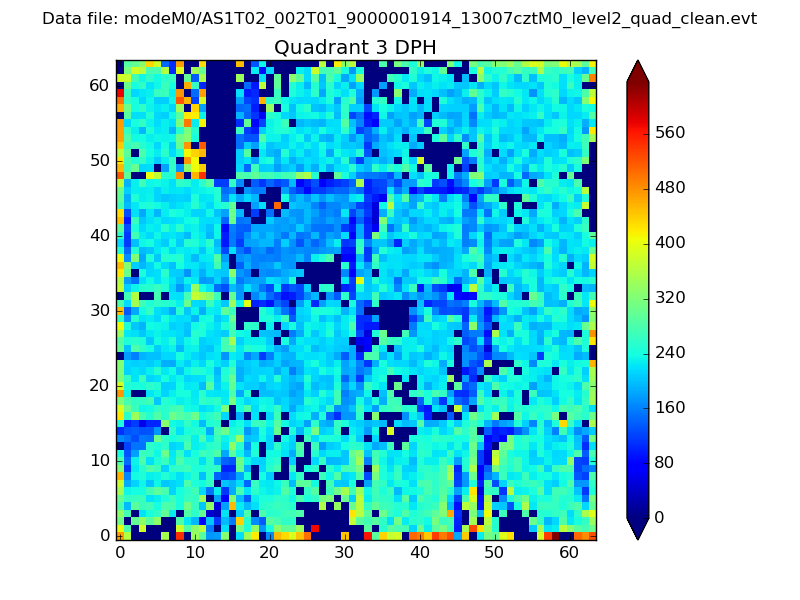 |
 |
Quadrant C |
| Plot type | Count rate plots | Images |
|---|---|---|
| Comparison with Poisson distribution Blue bars denote a histogram of data divided into 1 sec bins. Red curve is a Poisson curve with rate = median count rate of data. |
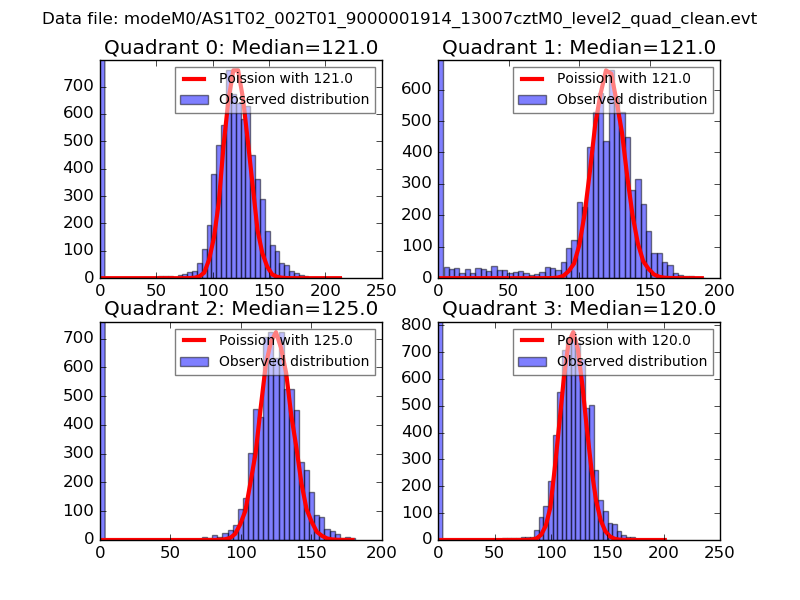 |
 |
| Quadrant-wise count rates Data is divided into 100 sec bins |
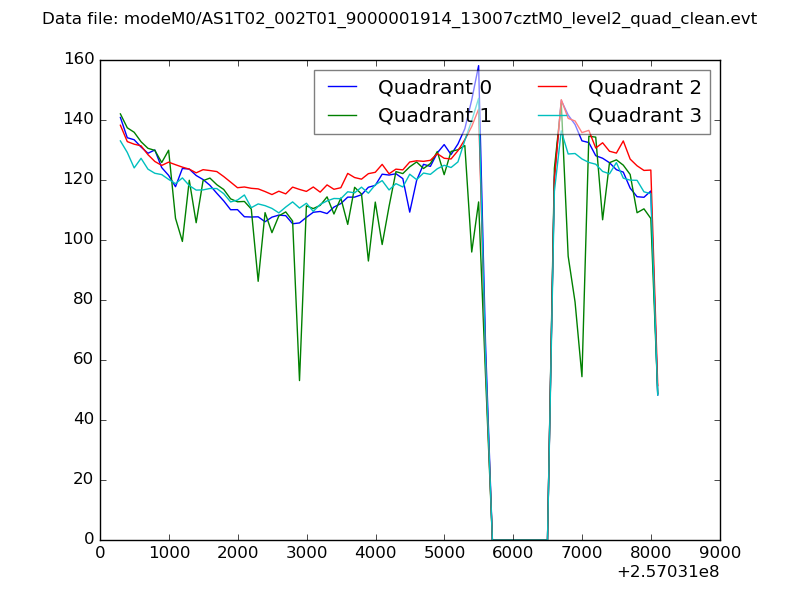 |
|
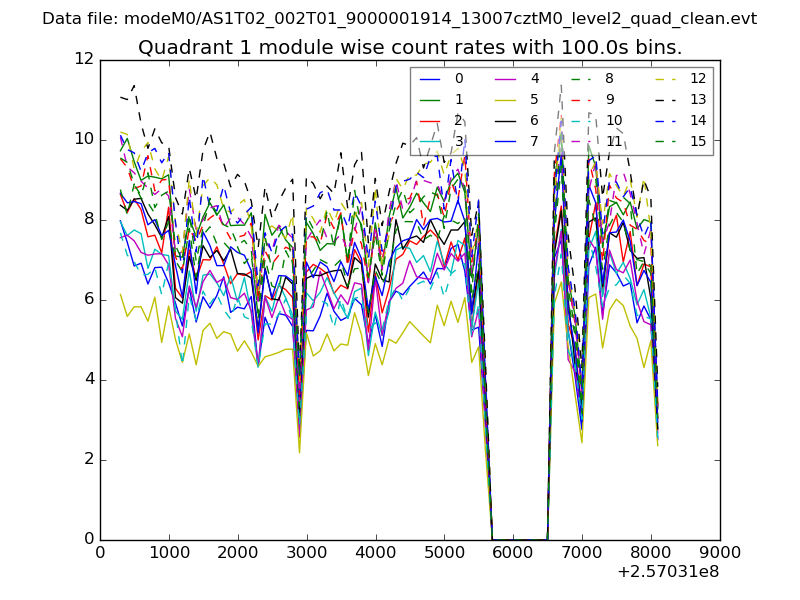
| Module-wise count rates for Quadrant A Data is divided into 100 sec bins |
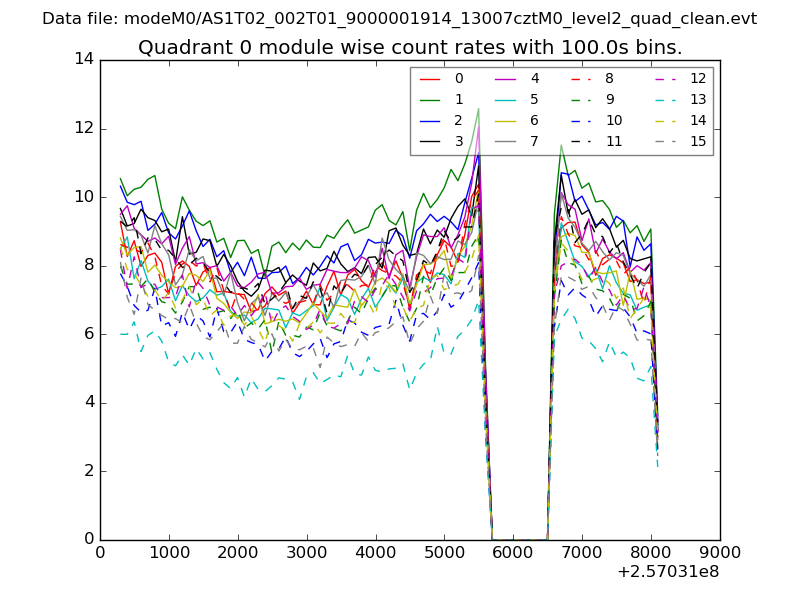 |
 |
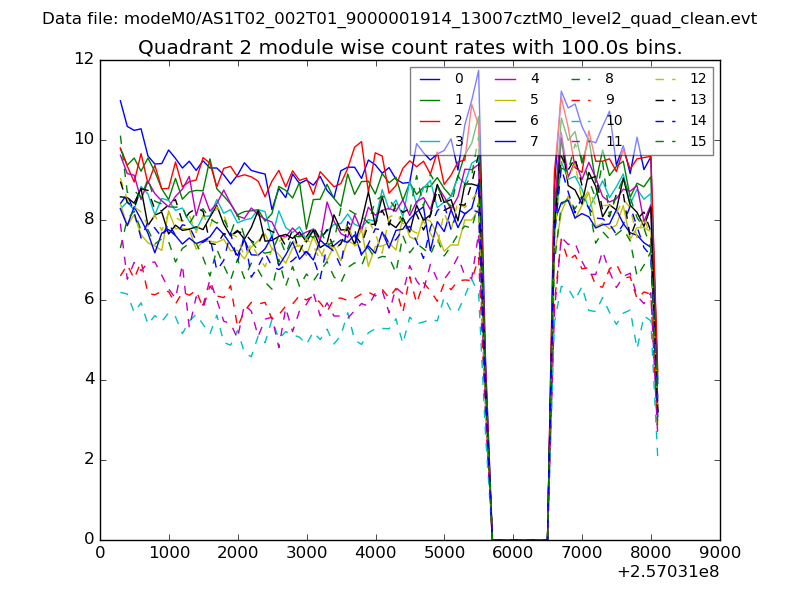
| Module-wise count rates for Quadrant B Data is divided into 100 sec bins |
 |
 |
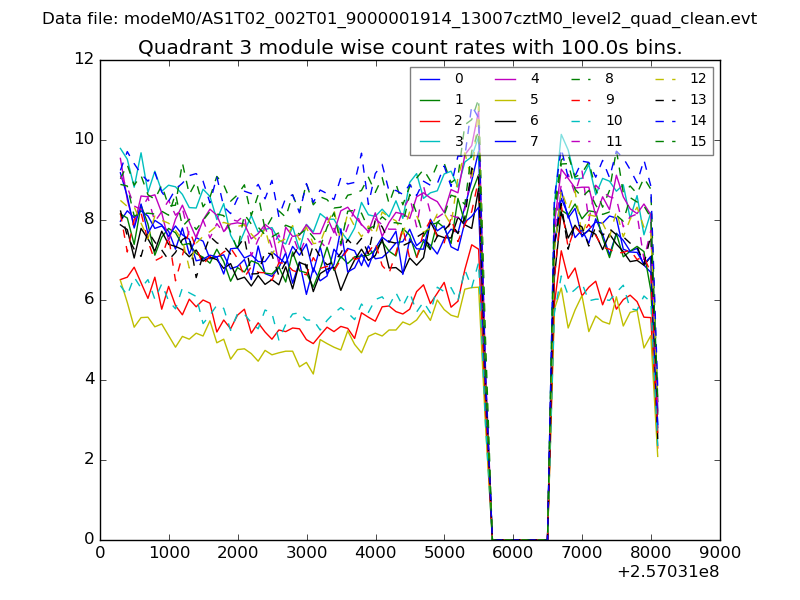
| Module-wise count rates for Quadrant C Data is divided into 100 sec bins |
 |
 |
| Module-wise count rates for Quadrant D Data is divided into 100 sec bins |
 |
 |
| Parameter | Plot |
|---|---|
| CZT HV Monitor |  |
| D_VDD | 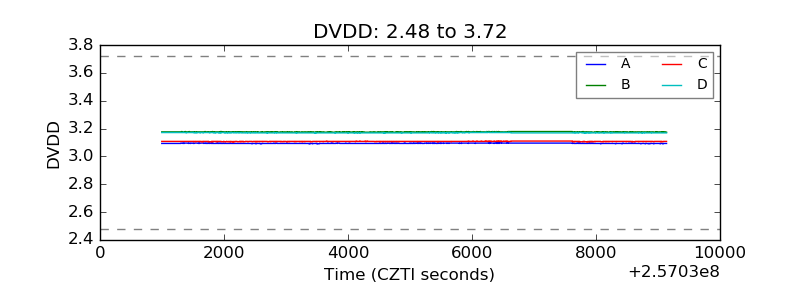 |
| Temperature 1 | 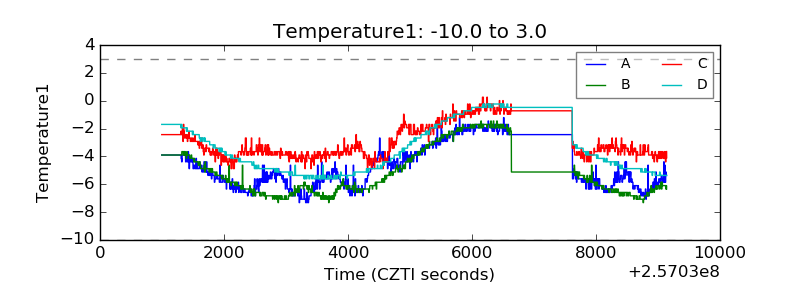 |
| Veto HV Monitor |  |
| Veto LLD | 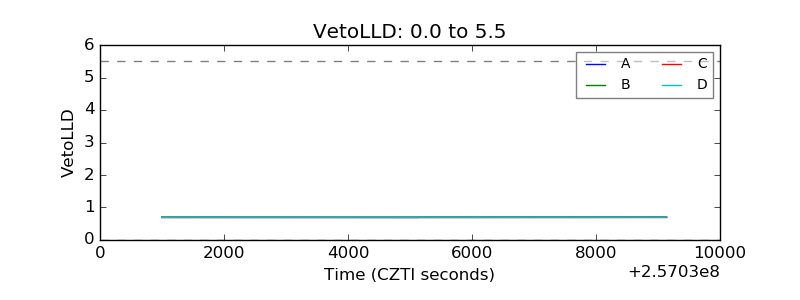 |
| Alpha Counter | 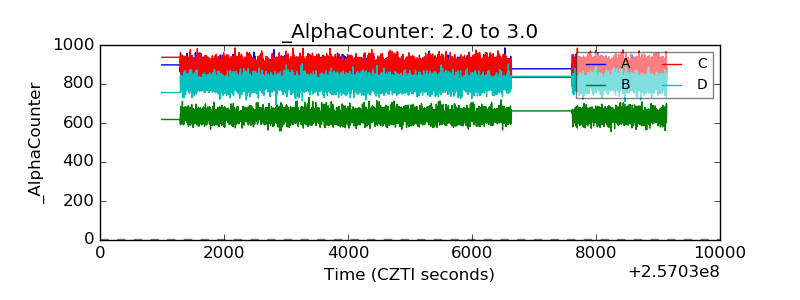 |
| _CPM_Rate | 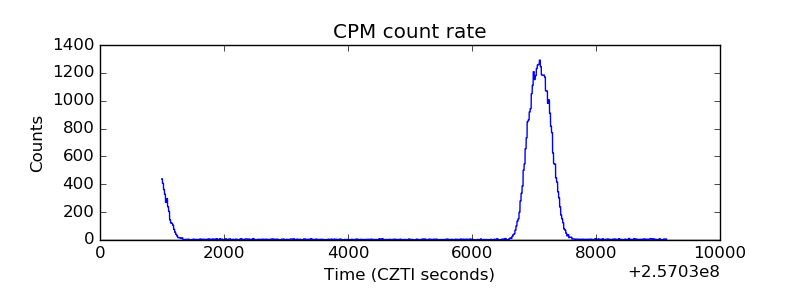 |
| CZT Counter | 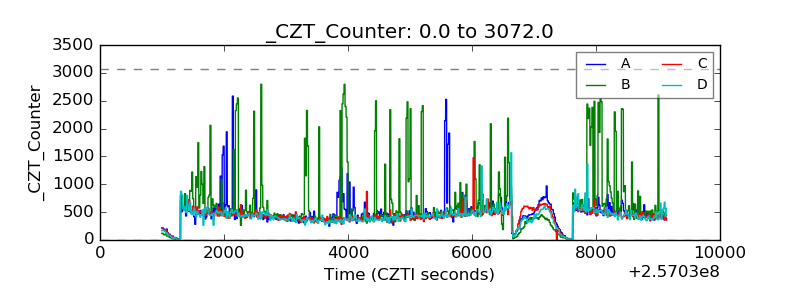 |
| +2.5 Volts monitor |  |
| +5 Volts monitor |  |
| _ROLL_ROT | 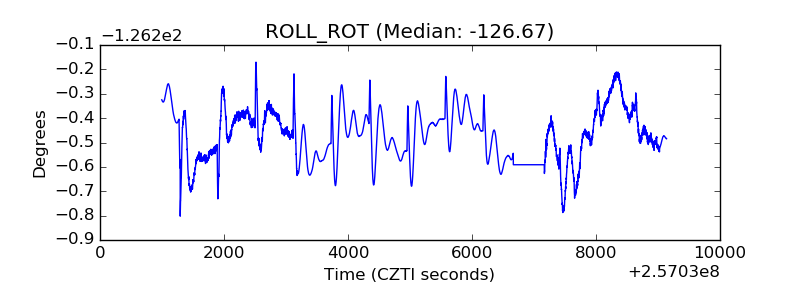 |
| _Roll_DEC |  |
| _Roll_RA | 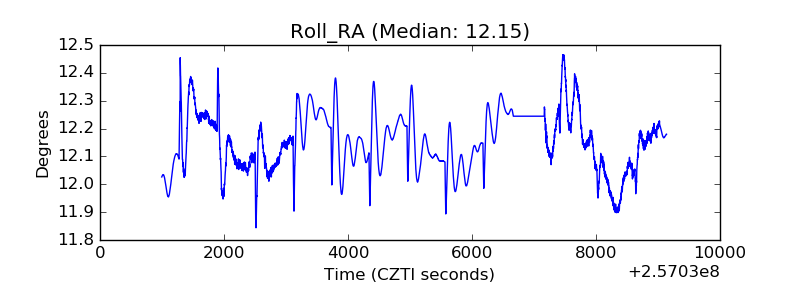 |
| Veto Counter | 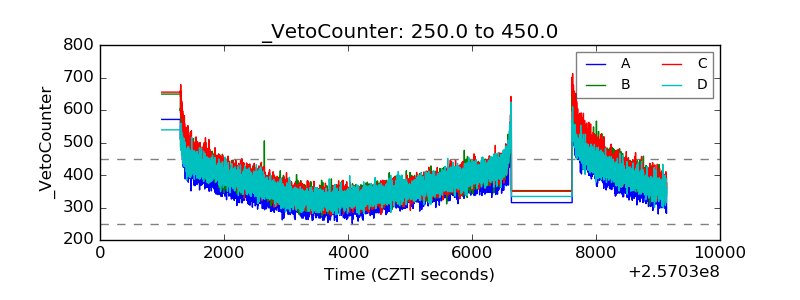 |