| Param | Original file | Final file |
|---|---|---|
| Filename | modeM0/AS1T02_002T01_9000001914_13009cztM0_level2.evt | modeM0/AS1T02_002T01_9000001914_13009cztM0_level2_quad_clean.evt |
| Size (bytes) | 490,717,440 | 124,277,760 |
| Size | 468.0 MB | 118.5 MB |
| Events in quadrant A | 3,335,509 | 835,755 |
| Events in quadrant B | 4,559,865 | 786,377 |
| Events in quadrant C | 2,987,577 | 861,821 |
| Events in quadrant D | 3,524,280 | 813,927 |
| Mode M9 | |||
|---|---|---|---|
| Quadrant | BADHDUFLAG | Total packets | Discarded packets |
| A | 0 | 15 | 0 |
| B | 0 | 15 | 0 |
| C | 0 | 15 | 0 |
| D | 0 | 16 | 0 |
| Mode M0 | |||
|---|---|---|---|
| Quadrant | BADHDUFLAG | Total packets | Discarded packets |
| A | 0 | 14492 | 3 |
| B | 0 | 18082 | 2 |
| C | 0 | 13616 | 2 |
| D | 0 | 15138 | 2 |
| Mode SS | |||
|---|---|---|---|
| Quadrant | BADHDUFLAG | Total packets | Discarded packets |
| A | 0 | 134 | 0 |
| B | 0 | 134 | 0 |
| C | 0 | 134 | 0 |
| D | 0 | 134 | 0 |
| Quadrant | Total seconds | Saturated seconds | Saturation percentage |
|---|---|---|---|
| A | 6687 | 36 | 0.538358% |
| B | 6687 | 673 | 10.064304% |
| C | 6687 | 9 | 0.134590% |
| D | 6687 | 121 | 1.809481% |
Noise dominated data is calculated using 1-second bins in cleaned event files. If a bin has >2000 counts, and if more than 50% of those come from <1% of pixels, then it is considered to be noise-dominated and hence unusable.
| Quadrant | # 1 sec bins | Bins with >0 counts | Bins with >2000 counts | High rate bins dominated by noise | Noise dominated (total time) | Noise dominated (detector-on time) | Marked lightcurve |
|---|---|---|---|---|---|---|---|
| A | 7778 | 6689 | 16 | 16 | 0.21% | 0.24% | 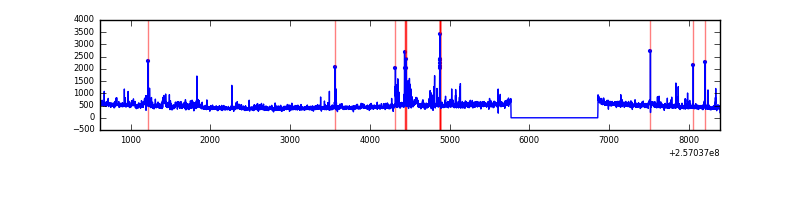 |
| B | 7778 | 6688 | 350 | 350 | 4.50% | 5.23% | 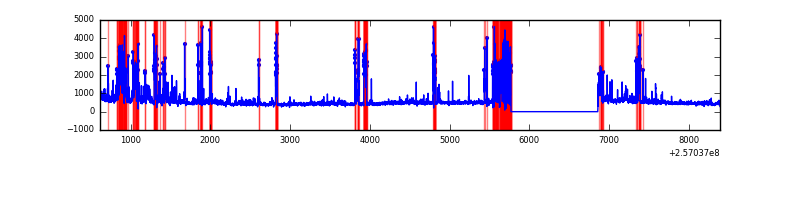 |
| C | 7778 | 6689 | 0 | 0 | 0.00% | 0.00% | 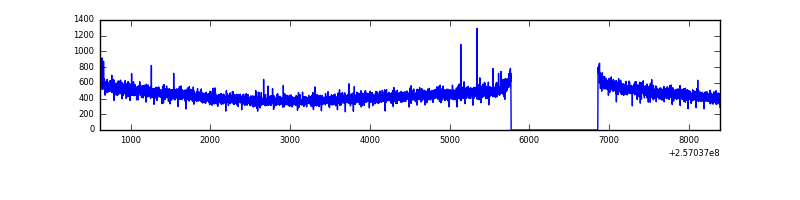 |
| D | 7778 | 6689 | 96 | 96 | 1.23% | 1.44% | 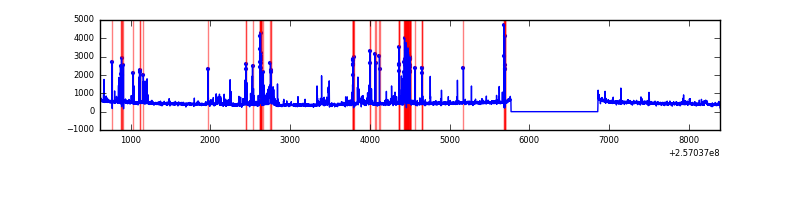 |
Top three noisy pixels from each quadrant. If the there are fewer than three noisy pixels in the level2.evt file, extra rows are filled as -1
| Pixel properties | Quadrant properties | ||||||
|---|---|---|---|---|---|---|---|
| Quadrant | DetID | PixID | Counts | Sigma | Mean | Median | Sigma |
| A | 12 | 189 | 153039 | 986.35 | 771 | 754 | 154.4 |
| A | 15 | 174 | 62356 | 398.99 | 771 | 754 | 154.4 |
| A | 15 | 223 | 48597 | 309.88 | 771 | 754 | 154.4 |
| B | 4 | 239 | 1355629 | 10007.81 | 720 | 701 | 135.4 |
| B | 0 | 219 | 126486 | 929.07 | 720 | 701 | 135.4 |
| B | 3 | 64 | 77181 | 564.9 | 720 | 701 | 135.4 |
| C | 0 | 207 | 6668 | 33.53 | 764 | 770 | 175.9 |
| C | 13 | 61 | 5499 | 26.88 | 764 | 770 | 175.9 |
| C | 8 | 222 | 2263 | 8.49 | 764 | 770 | 175.9 |
| D | 1 | 52 | 655039 | 3686.87 | 748 | 728 | 177.5 |
| D | 2 | 234 | 23538 | 128.53 | 748 | 728 | 177.5 |
| D | 8 | 195 | 23499 | 128.31 | 748 | 728 | 177.5 |
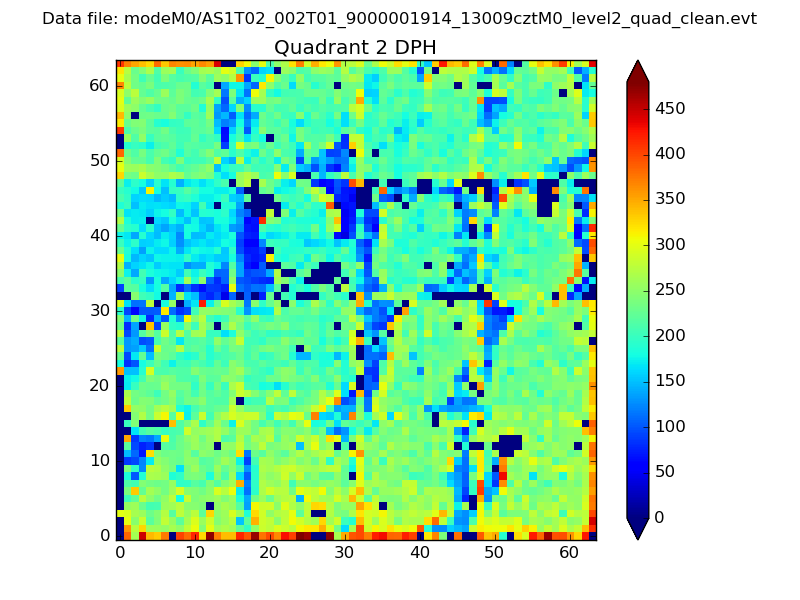
Histogram calculated using DETX and DETY for each event in the final _common_clean file
| Quadrant A |  |
 |
Quadrant B |
|---|---|---|---|
| Quadrant D | 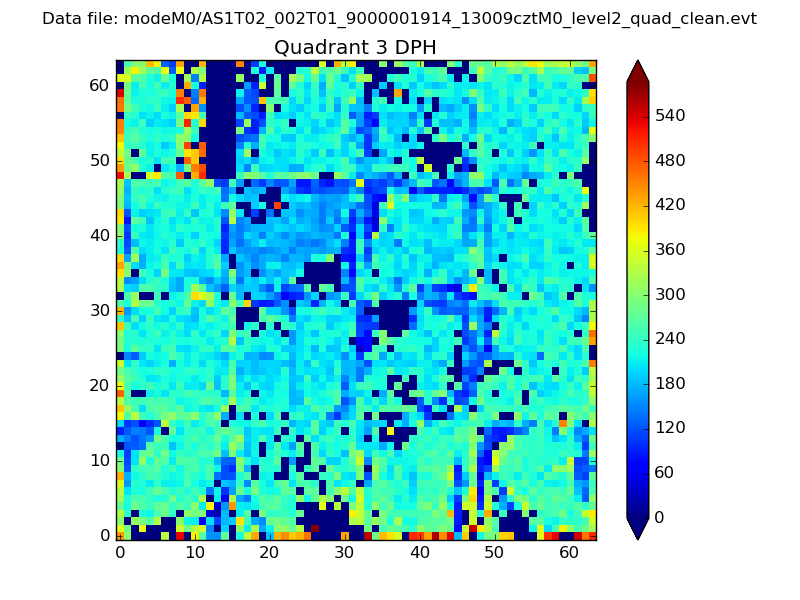 |
 |
Quadrant C |
| Plot type | Count rate plots | Images |
|---|---|---|
| Comparison with Poisson distribution Blue bars denote a histogram of data divided into 1 sec bins. Red curve is a Poisson curve with rate = median count rate of data. |
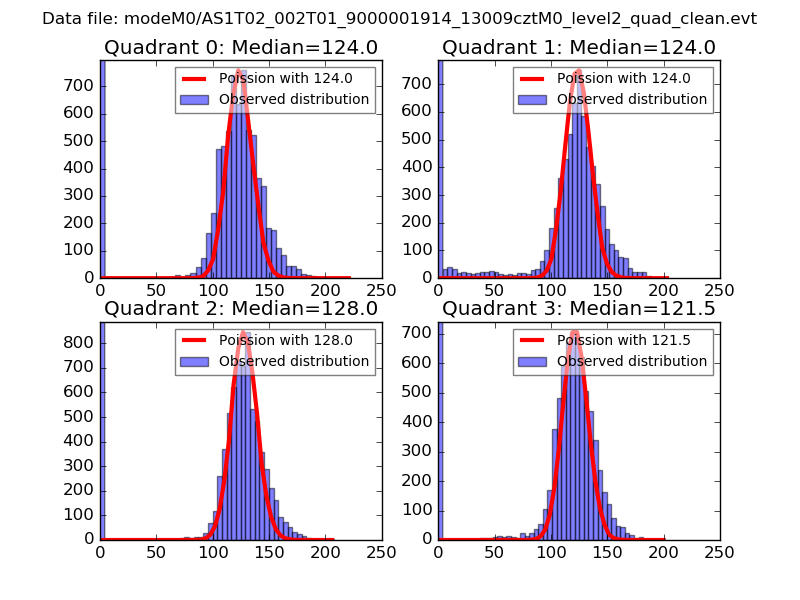 |
 |
| Quadrant-wise count rates Data is divided into 100 sec bins |
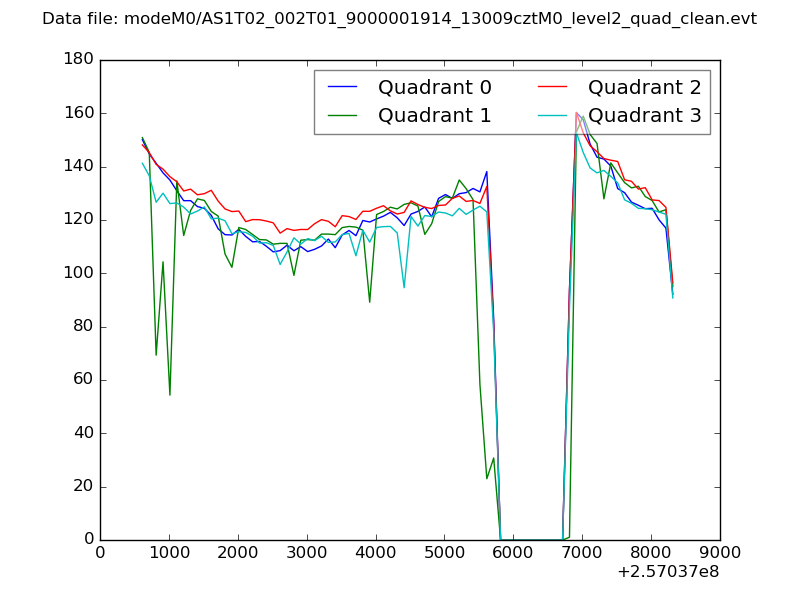 |
|
| Module-wise count rates for Quadrant A Data is divided into 100 sec bins |
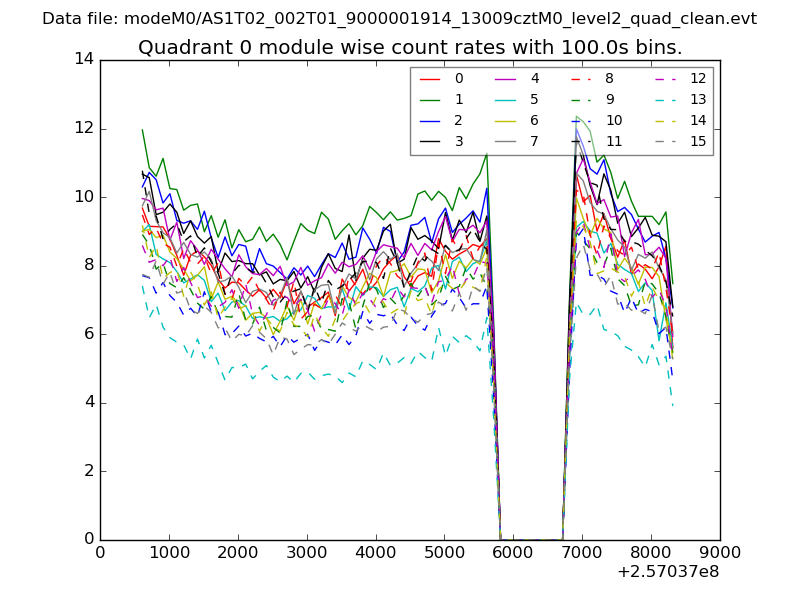 |
 |
| Module-wise count rates for Quadrant B Data is divided into 100 sec bins |
 |
 |
| Module-wise count rates for Quadrant C Data is divided into 100 sec bins |
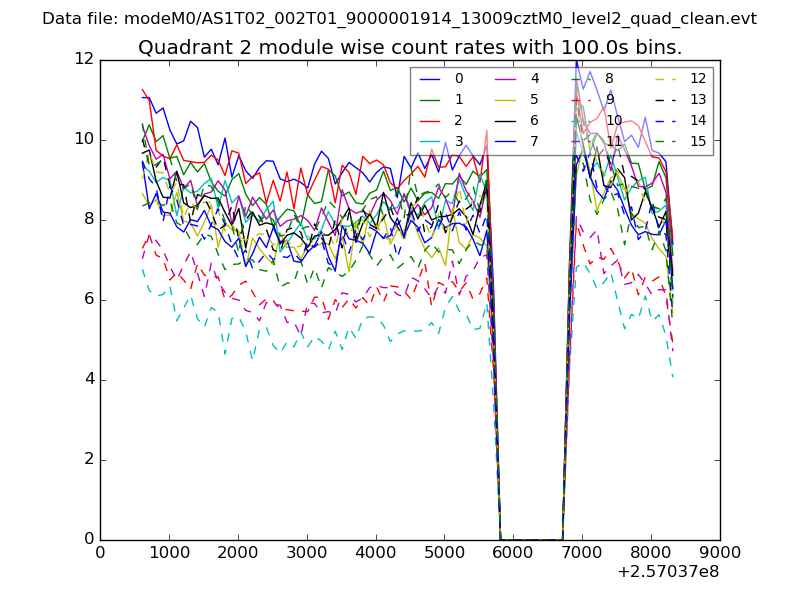 |
 |
| Module-wise count rates for Quadrant D Data is divided into 100 sec bins |
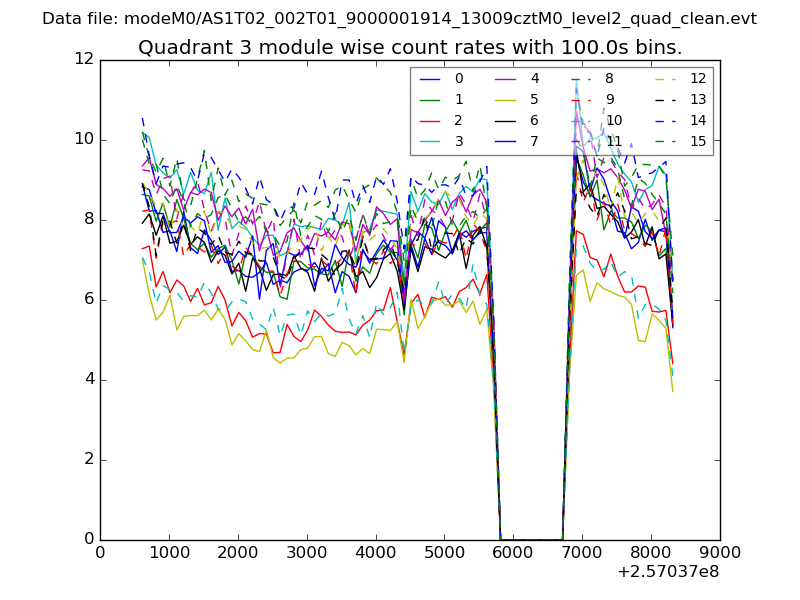 |
 |
| Parameter | Plot |
|---|---|
| CZT HV Monitor | 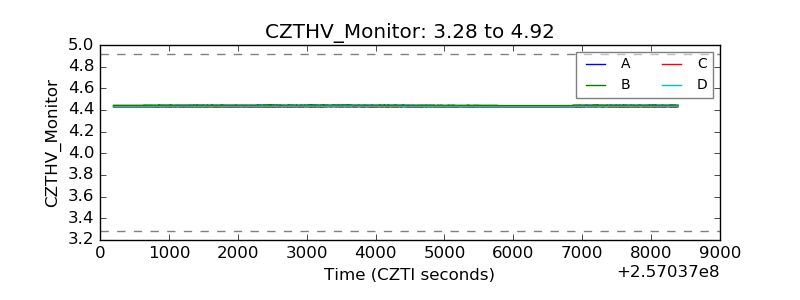 |
| D_VDD | 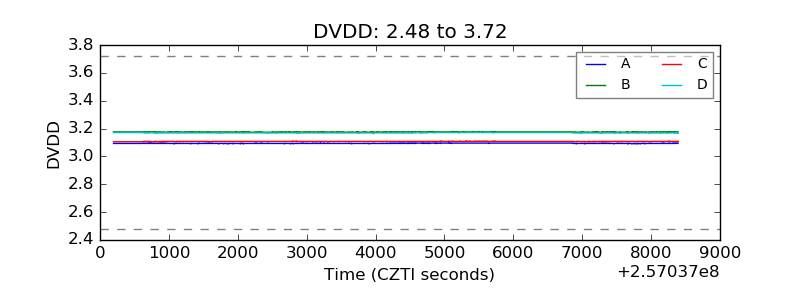 |
| Temperature 1 | 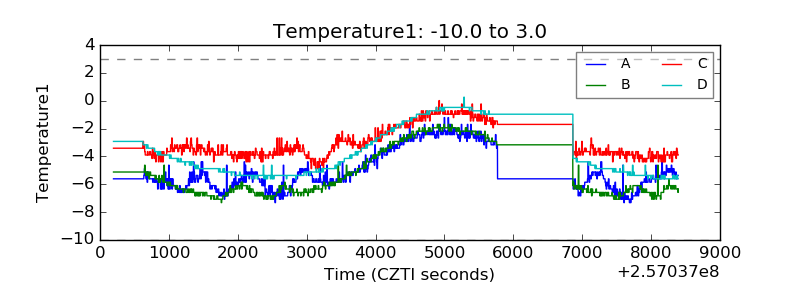 |
| Veto HV Monitor | 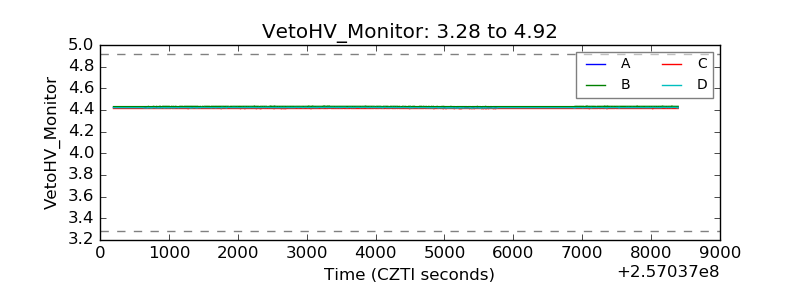 |
| Veto LLD | 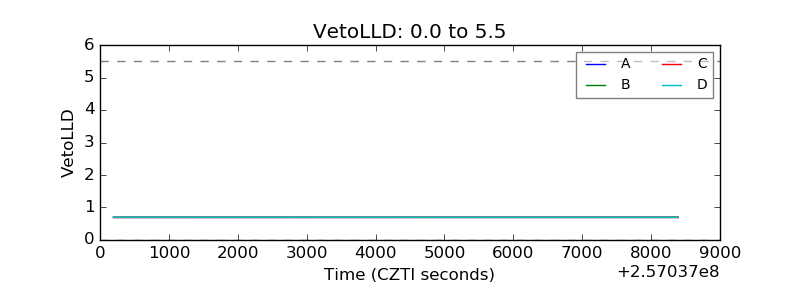 |
| Alpha Counter | 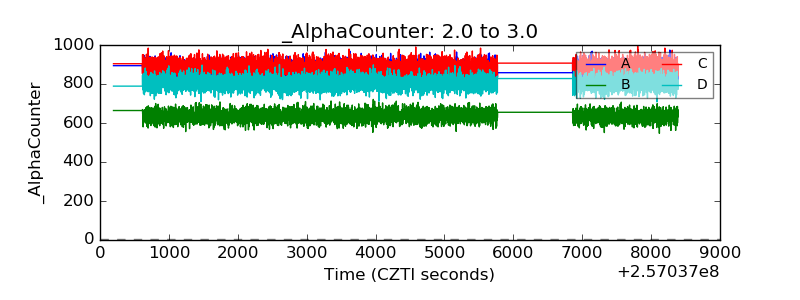 |
| _CPM_Rate | 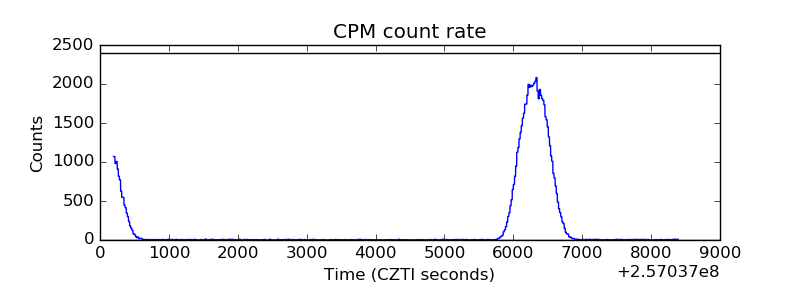 |
| CZT Counter |  |
| +2.5 Volts monitor |  |
| +5 Volts monitor | 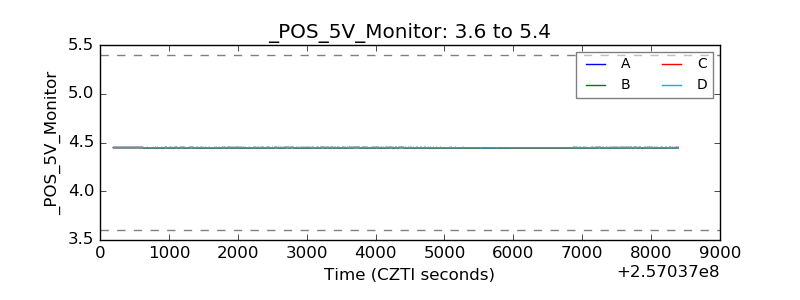 |
| _ROLL_ROT | 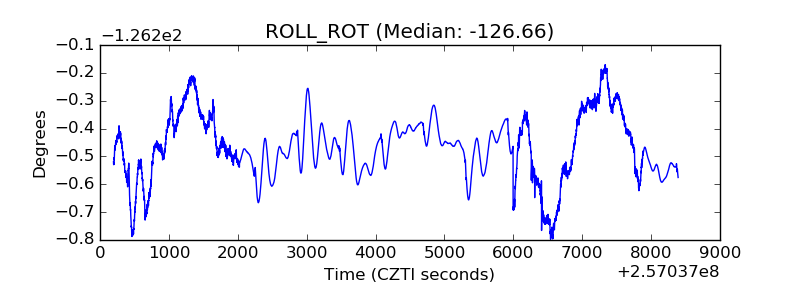 |
| _Roll_DEC | 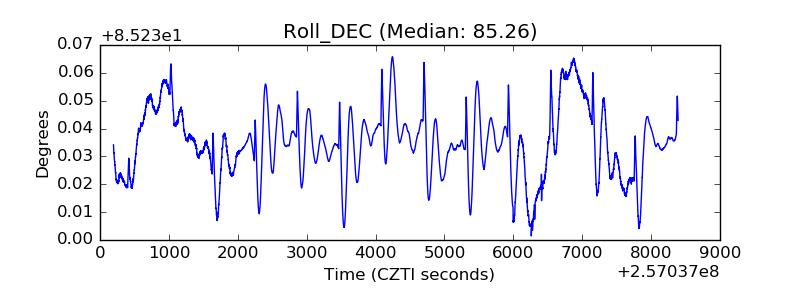 |
| _Roll_RA | 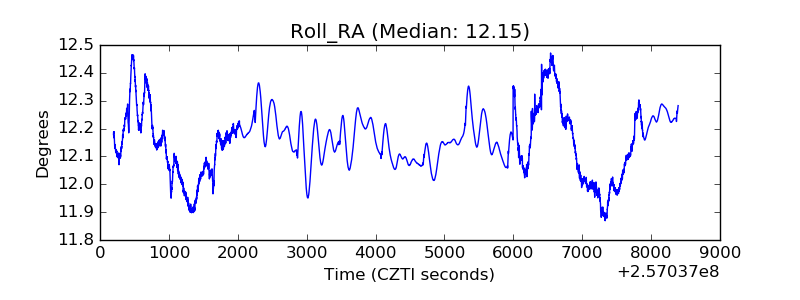 |
| Veto Counter | 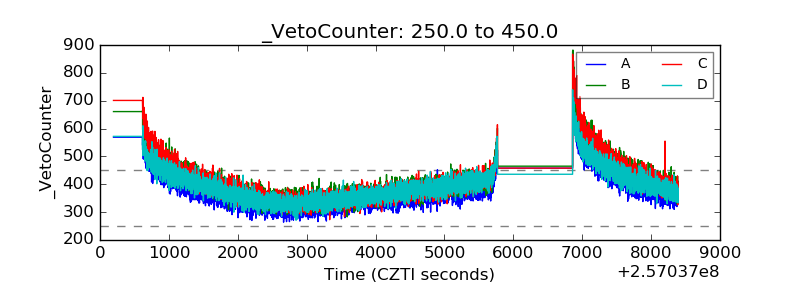 |