| Param | Original file | Final file |
|---|---|---|
| Filename | modeM0/AS1T02_002T01_9000001914_13010cztM0_level2.evt | modeM0/AS1T02_002T01_9000001914_13010cztM0_level2_quad_clean.evt |
| Size (bytes) | 478,560,960 | 125,628,480 |
| Size | 456.4 MB | 119.8 MB |
| Events in quadrant A | 3,231,798 | 854,496 |
| Events in quadrant B | 4,705,748 | 790,791 |
| Events in quadrant C | 2,993,180 | 873,524 |
| Events in quadrant D | 3,117,092 | 829,069 |
| Mode M9 | |||
|---|---|---|---|
| Quadrant | BADHDUFLAG | Total packets | Discarded packets |
| A | 0 | 17 | 0 |
| B | 0 | 17 | 0 |
| C | 0 | 17 | 0 |
| D | 0 | 17 | 0 |
| Mode M0 | |||
|---|---|---|---|
| Quadrant | BADHDUFLAG | Total packets | Discarded packets |
| A | 0 | 13913 | 4 |
| B | 0 | 18462 | 2 |
| C | 0 | 13471 | 2 |
| D | 0 | 13872 | 2 |
| Mode SS | |||
|---|---|---|---|
| Quadrant | BADHDUFLAG | Total packets | Discarded packets |
| A | 0 | 134 | 0 |
| B | 0 | 134 | 0 |
| C | 0 | 134 | 0 |
| D | 0 | 134 | 0 |
| Quadrant | Total seconds | Saturated seconds | Saturation percentage |
|---|---|---|---|
| A | 6546 | 33 | 0.504125% |
| B | 6546 | 876 | 13.382218% |
| C | 6546 | 23 | 0.351360% |
| D | 6546 | 36 | 0.549954% |
Noise dominated data is calculated using 1-second bins in cleaned event files. If a bin has >2000 counts, and if more than 50% of those come from <1% of pixels, then it is considered to be noise-dominated and hence unusable.
| Quadrant | # 1 sec bins | Bins with >0 counts | Bins with >2000 counts | High rate bins dominated by noise | Noise dominated (total time) | Noise dominated (detector-on time) | Marked lightcurve |
|---|---|---|---|---|---|---|---|
| A | 7763 | 6549 | 3 | 3 | 0.04% | 0.05% | 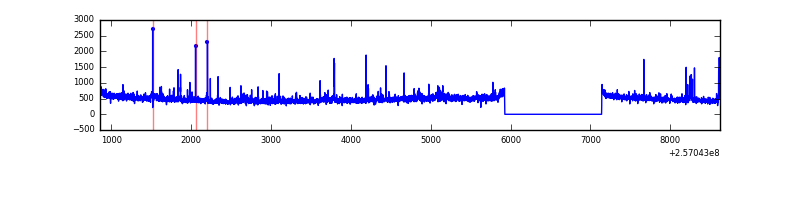 |
| B | 7763 | 6548 | 497 | 497 | 6.40% | 7.59% | 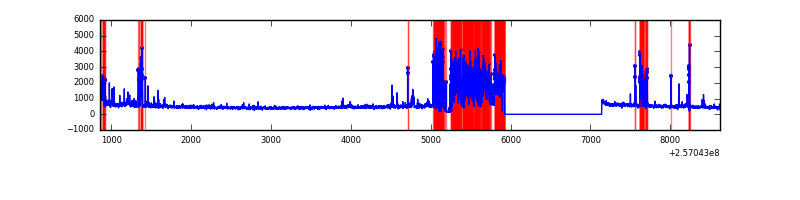 |
| C | 7763 | 6549 | 1 | 1 | 0.01% | 0.02% | 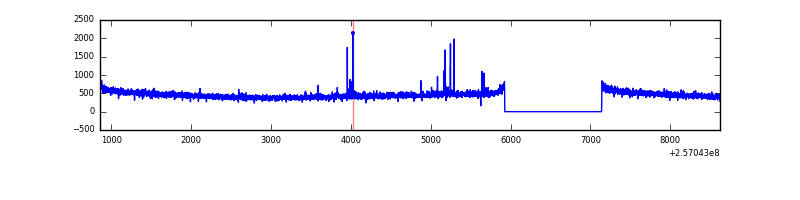 |
| D | 7763 | 6549 | 11 | 11 | 0.14% | 0.17% | 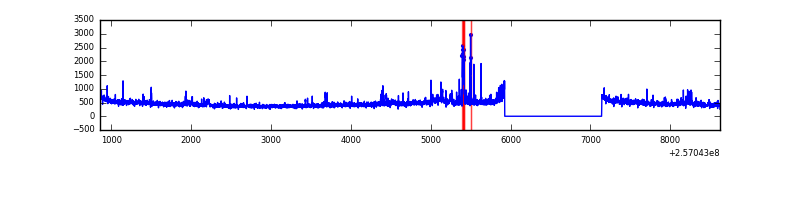 |
Top three noisy pixels from each quadrant. If the there are fewer than three noisy pixels in the level2.evt file, extra rows are filled as -1
| Pixel properties | Quadrant properties | ||||||
|---|---|---|---|---|---|---|---|
| Quadrant | DetID | PixID | Counts | Sigma | Mean | Median | Sigma |
| A | 12 | 189 | 157707 | 1009.59 | 774 | 759 | 155.5 |
| A | 15 | 223 | 30547 | 191.62 | 774 | 759 | 155.5 |
| A | 1 | 162 | 19951 | 123.46 | 774 | 759 | 155.5 |
| B | 4 | 239 | 1689357 | 12901.17 | 705 | 689 | 130.9 |
| B | 3 | 64 | 79748 | 604.0 | 705 | 689 | 130.9 |
| B | 0 | 219 | 59727 | 451.04 | 705 | 689 | 130.9 |
| C | 0 | 207 | 24083 | 134.03 | 758 | 763 | 174.0 |
| C | 14 | 234 | 11880 | 63.89 | 758 | 763 | 174.0 |
| C | 13 | 61 | 5524 | 27.36 | 758 | 763 | 174.0 |
| D | 1 | 52 | 215805 | 1223.36 | 745 | 727 | 175.8 |
| D | 8 | 195 | 64113 | 360.54 | 745 | 727 | 175.8 |
| D | 2 | 234 | 20003 | 109.64 | 745 | 727 | 175.8 |
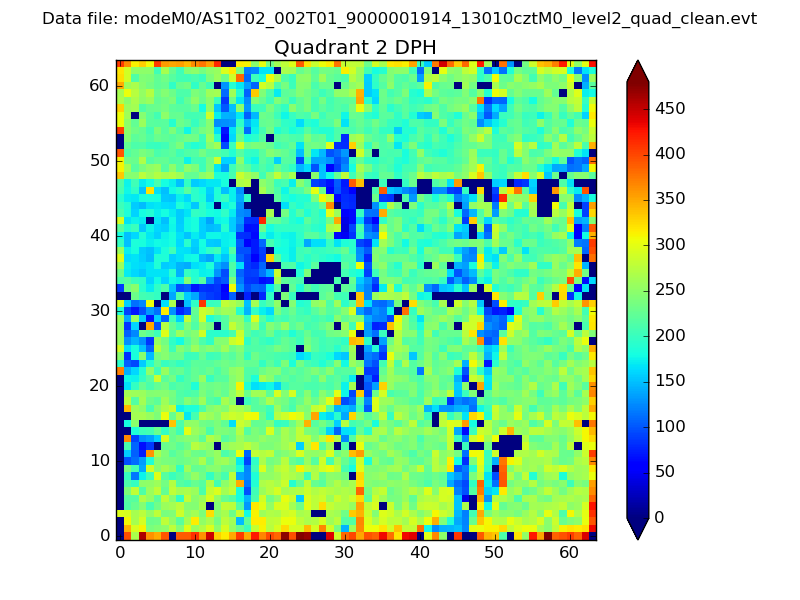
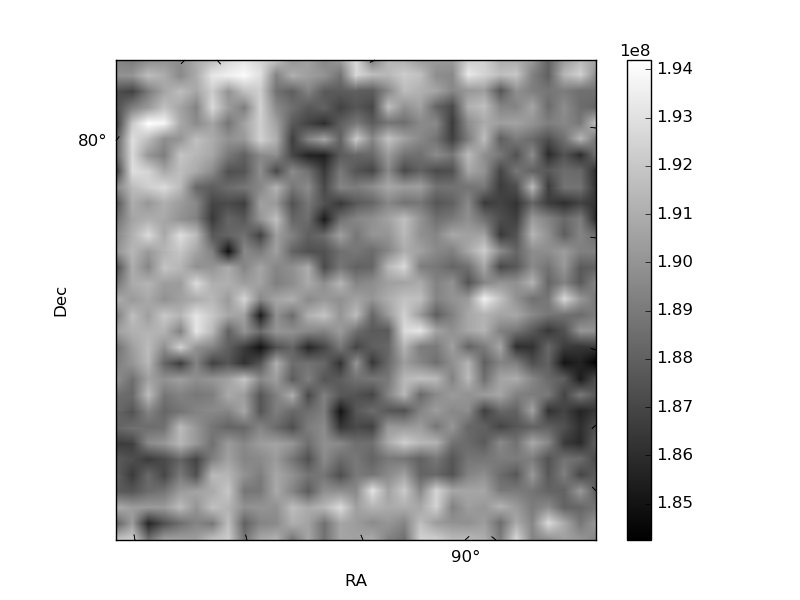
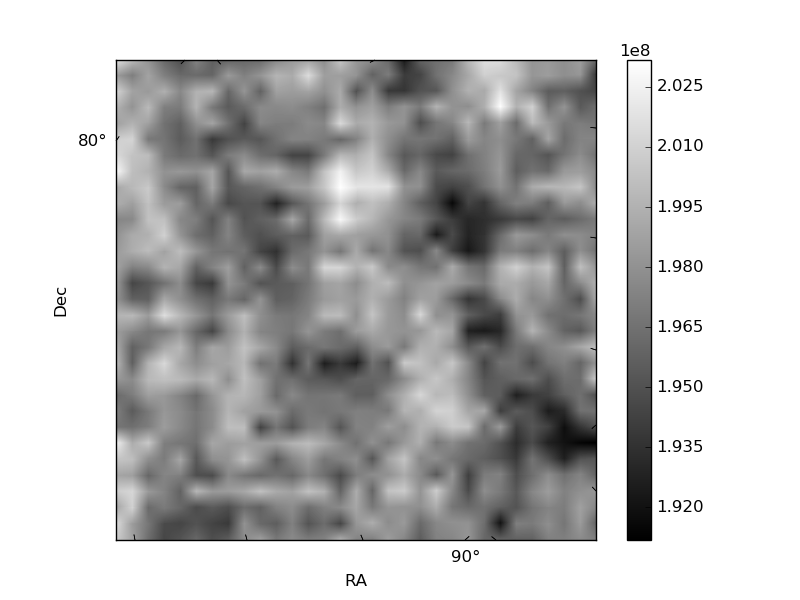
Histogram calculated using DETX and DETY for each event in the final _common_clean file
| Quadrant A | 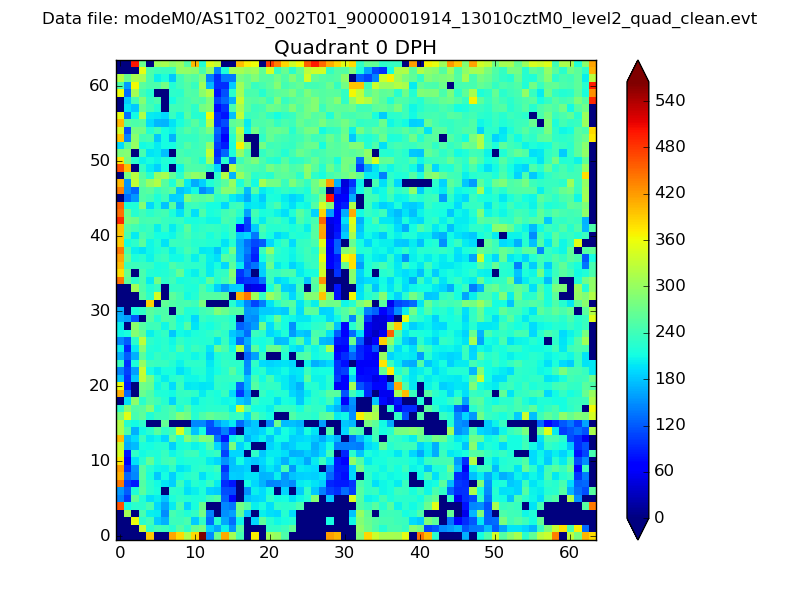 |
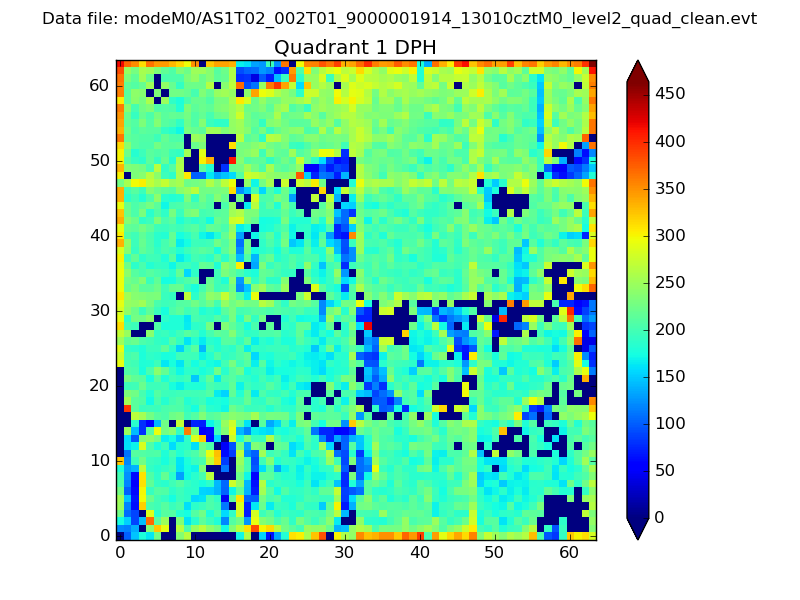 |
Quadrant B |
|---|---|---|---|
| Quadrant D | 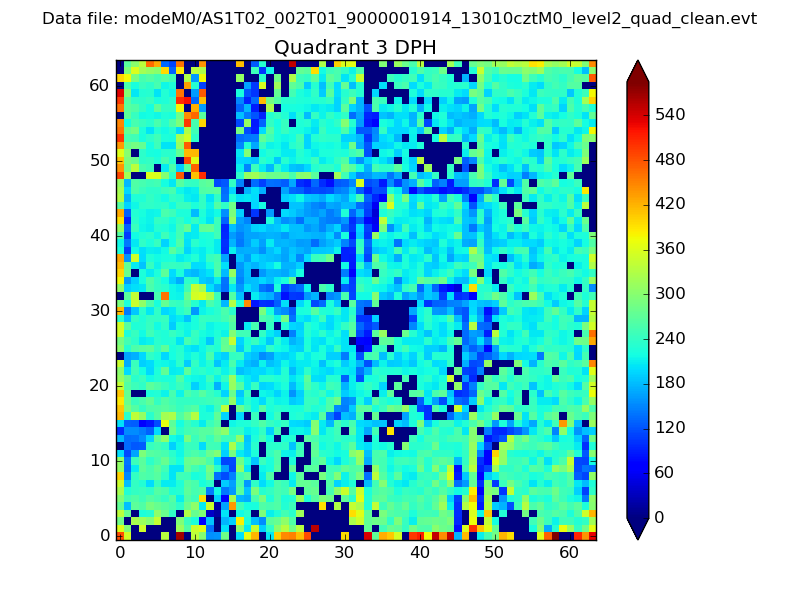 |
 |
Quadrant C |
| Plot type | Count rate plots | Images |
|---|---|---|
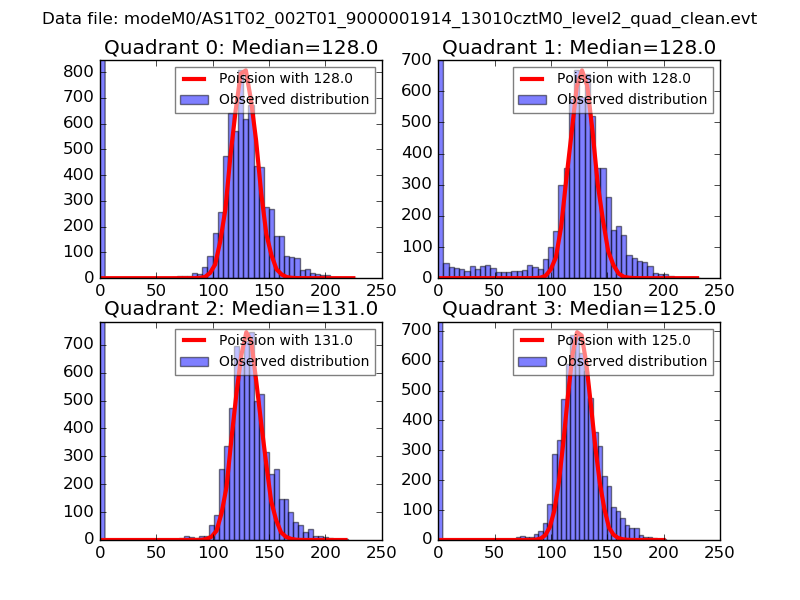
| Comparison with Poisson distribution Blue bars denote a histogram of data divided into 1 sec bins. Red curve is a Poisson curve with rate = median count rate of data. |
 |
 |
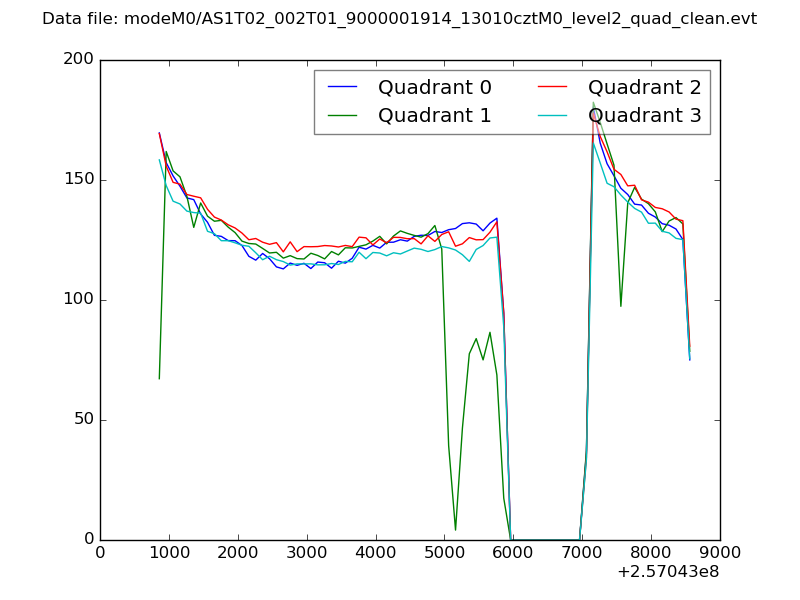
| Quadrant-wise count rates Data is divided into 100 sec bins |
 |
|
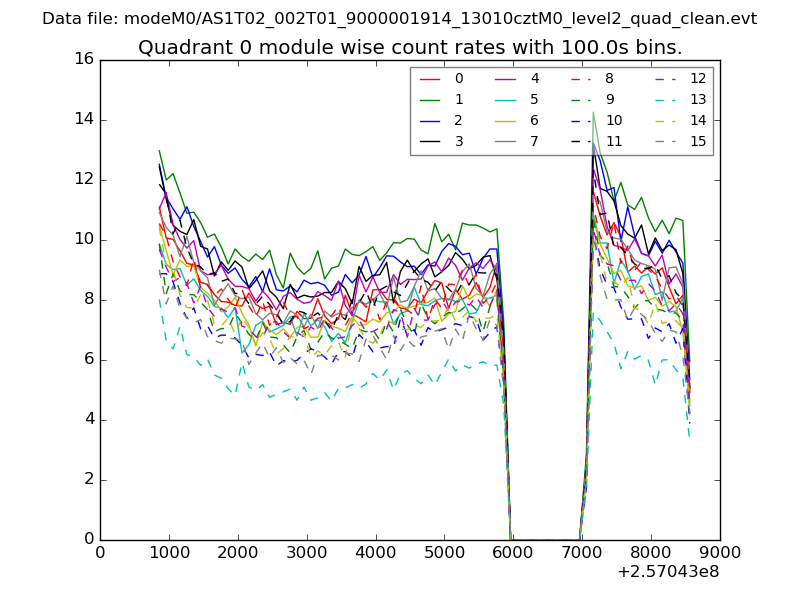
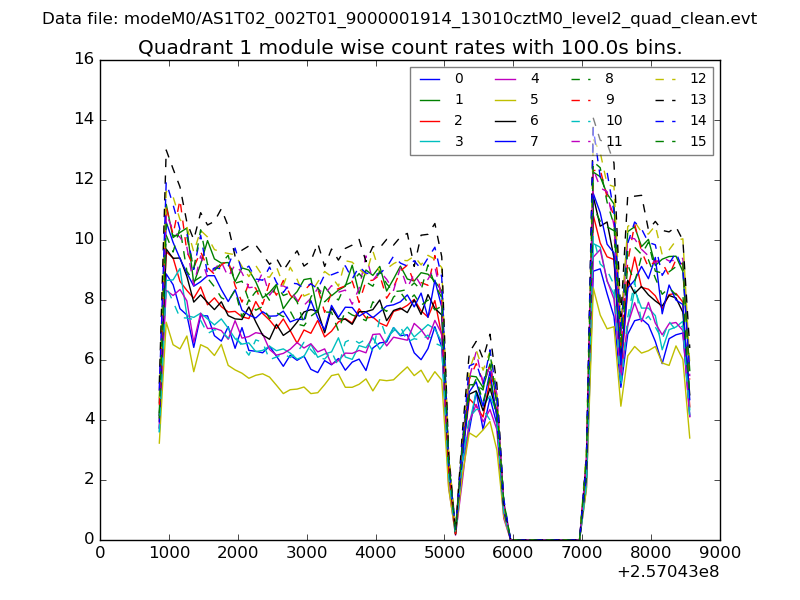
| Module-wise count rates for Quadrant A Data is divided into 100 sec bins |
 |
 |
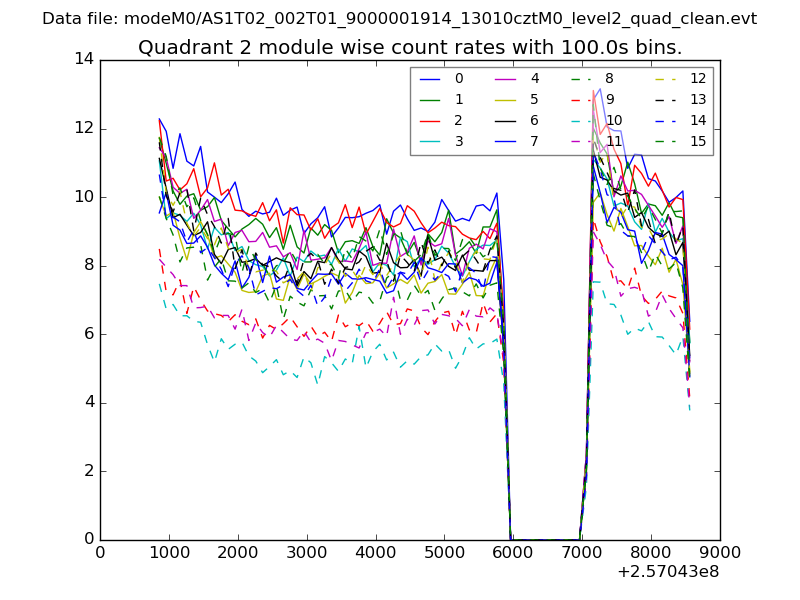
| Module-wise count rates for Quadrant B Data is divided into 100 sec bins |
 |
 |
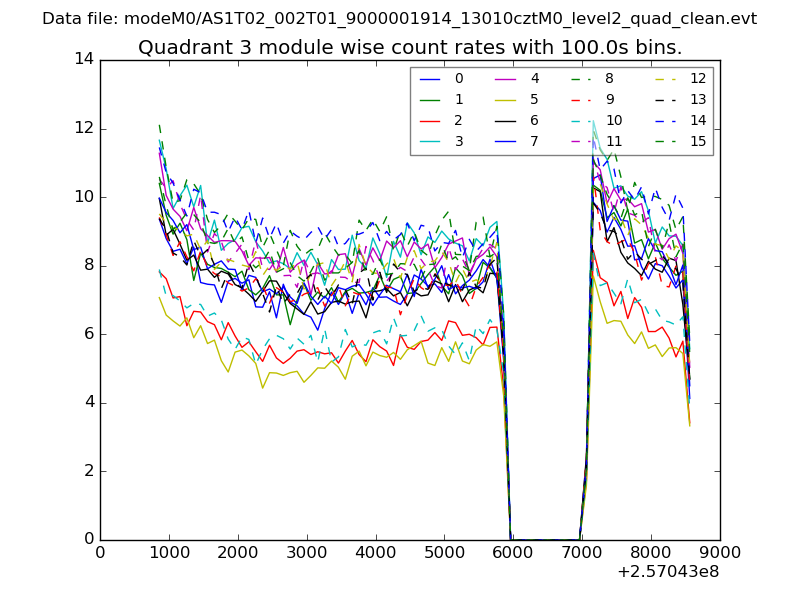
| Module-wise count rates for Quadrant C Data is divided into 100 sec bins |
 |
 |
| Module-wise count rates for Quadrant D Data is divided into 100 sec bins |
 |
 |
| Parameter | Plot |
|---|---|
| CZT HV Monitor | 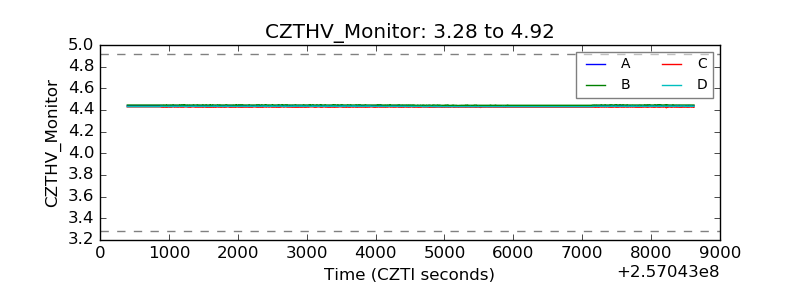 |
| D_VDD | 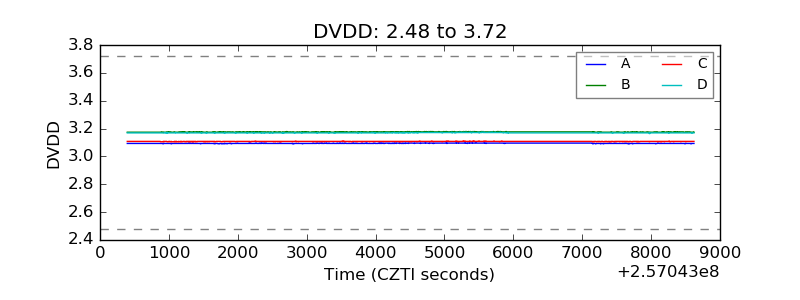 |
| Temperature 1 | 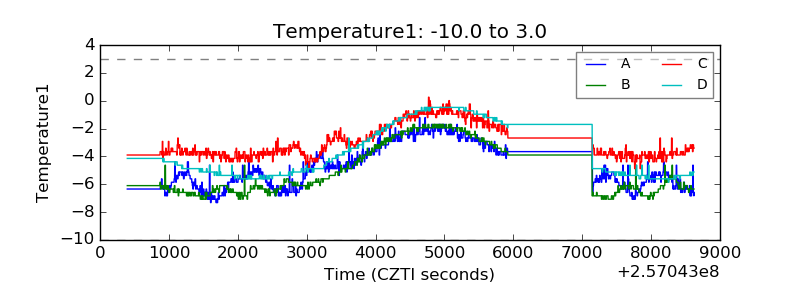 |
| Veto HV Monitor | 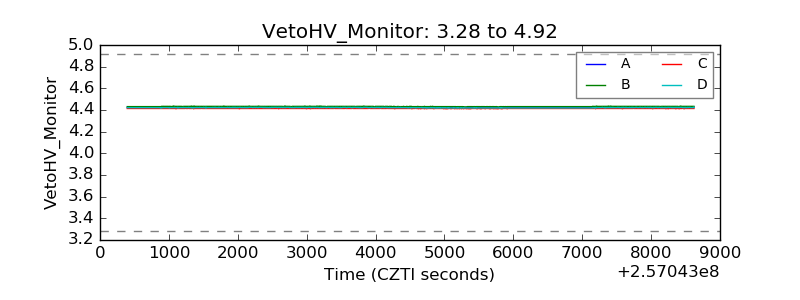 |
| Veto LLD | 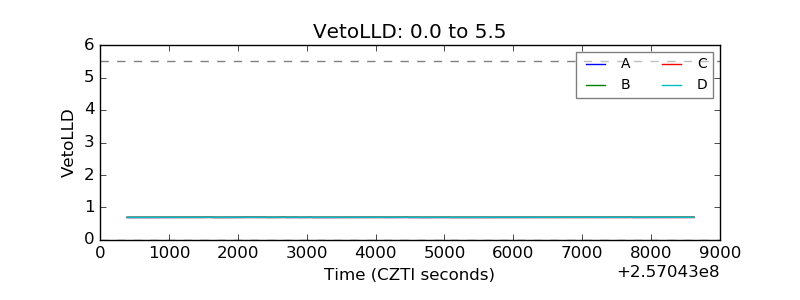 |
| Alpha Counter | 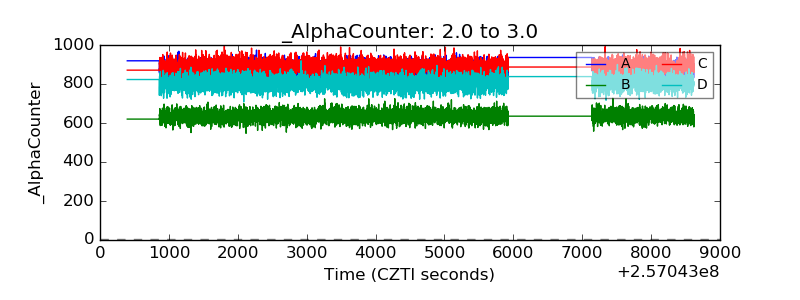 |
| _CPM_Rate | 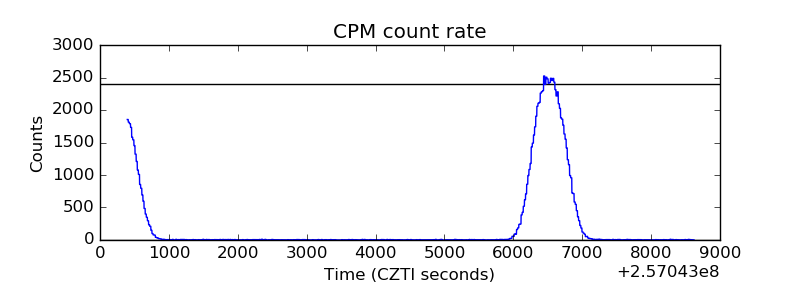 |
| CZT Counter | 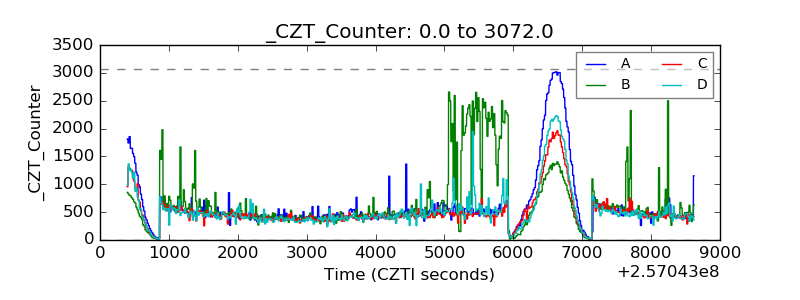 |
| +2.5 Volts monitor |  |
| +5 Volts monitor |  |
| _ROLL_ROT | 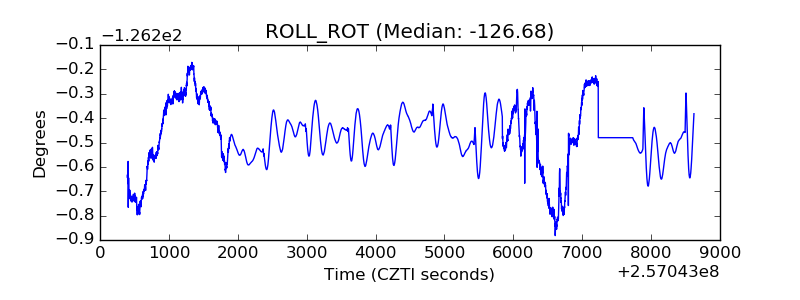 |
| _Roll_DEC | 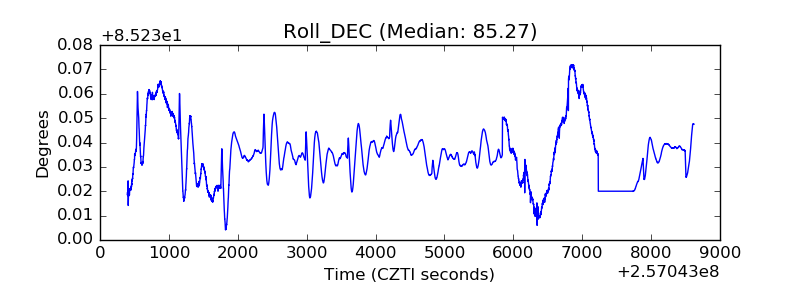 |
| _Roll_RA | 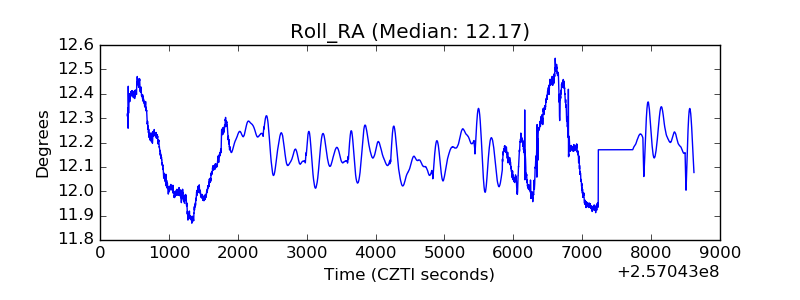 |
| Veto Counter |  |