| Param | Original file | Final file |
|---|---|---|
| Filename | modeM0/AS1T02_002T01_9000001914_13011cztM0_level2.evt | modeM0/AS1T02_002T01_9000001914_13011cztM0_level2_quad_clean.evt |
| Size (bytes) | 437,679,360 | 112,426,560 |
| Size | 417.4 MB | 107.2 MB |
| Events in quadrant A | 2,898,731 | 771,577 |
| Events in quadrant B | 4,387,267 | 715,778 |
| Events in quadrant C | 2,586,884 | 777,661 |
| Events in quadrant D | 2,988,304 | 734,936 |
| Mode M9 | |||
|---|---|---|---|
| Quadrant | BADHDUFLAG | Total packets | Discarded packets |
| A | 0 | 13 | 0 |
| B | 0 | 13 | 0 |
| C | 0 | 13 | 0 |
| D | 0 | 13 | 0 |
| Mode M0 | |||
|---|---|---|---|
| Quadrant | BADHDUFLAG | Total packets | Discarded packets |
| A | 0 | 12449 | 2 |
| B | 0 | 16790 | 1 |
| C | 0 | 11730 | 1 |
| D | 0 | 12827 | 1 |
| Mode SS | |||
|---|---|---|---|
| Quadrant | BADHDUFLAG | Total packets | Discarded packets |
| A | 0 | 118 | 0 |
| B | 0 | 118 | 0 |
| C | 0 | 118 | 0 |
| D | 0 | 118 | 0 |
| Quadrant | Total seconds | Saturated seconds | Saturation percentage |
|---|---|---|---|
| A | 5792 | 24 | 0.414365% |
| B | 5792 | 804 | 13.881215% |
| C | 5792 | 11 | 0.189917% |
| D | 5792 | 107 | 1.847376% |
Noise dominated data is calculated using 1-second bins in cleaned event files. If a bin has >2000 counts, and if more than 50% of those come from <1% of pixels, then it is considered to be noise-dominated and hence unusable.
| Quadrant | # 1 sec bins | Bins with >0 counts | Bins with >2000 counts | High rate bins dominated by noise | Noise dominated (total time) | Noise dominated (detector-on time) | Marked lightcurve |
|---|---|---|---|---|---|---|---|
| A | 7103 | 5794 | 3 | 3 | 0.04% | 0.05% | 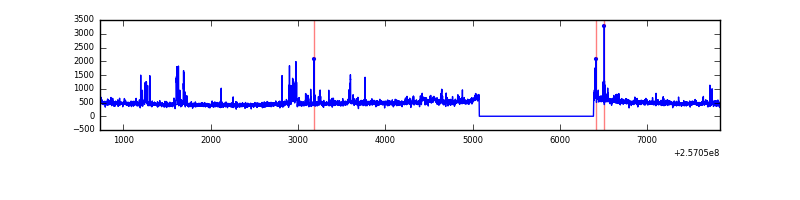 |
| B | 7103 | 5793 | 490 | 490 | 6.90% | 8.46% | 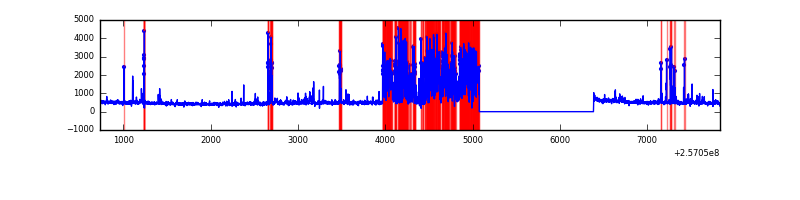 |
| C | 7103 | 5794 | 0 | 0 | 0.00% | 0.00% | 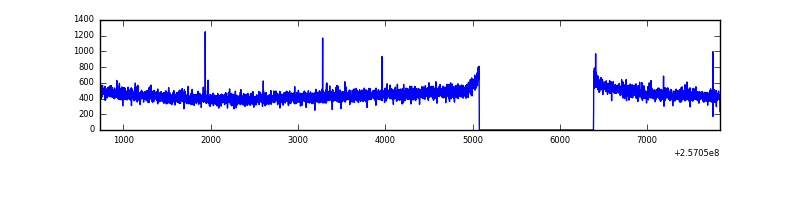 |
| D | 7103 | 5794 | 53 | 53 | 0.75% | 0.91% | 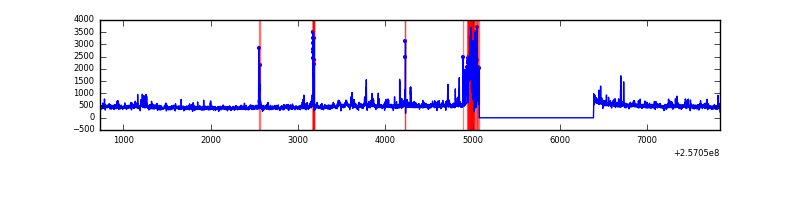 |
Top three noisy pixels from each quadrant. If the there are fewer than three noisy pixels in the level2.evt file, extra rows are filled as -1
| Pixel properties | Quadrant properties | ||||||
|---|---|---|---|---|---|---|---|
| Quadrant | DetID | PixID | Counts | Sigma | Mean | Median | Sigma |
| A | 12 | 189 | 206514 | 1495.47 | 686 | 672 | 137.6 |
| A | 15 | 223 | 21206 | 149.18 | 686 | 672 | 137.6 |
| A | 9 | 143 | 10350 | 70.31 | 686 | 672 | 137.6 |
| B | 4 | 239 | 1772250 | 15267.09 | 626 | 613 | 116.0 |
| B | 3 | 64 | 53165 | 452.87 | 626 | 613 | 116.0 |
| B | 3 | 209 | 36939 | 313.04 | 626 | 613 | 116.0 |
| C | 13 | 61 | 4698 | 26.83 | 662 | 665 | 150.3 |
| C | 14 | 234 | 3831 | 21.07 | 662 | 665 | 150.3 |
| C | 12 | 4 | 2140 | 9.81 | 662 | 665 | 150.3 |
| D | 1 | 52 | 403006 | 2646.39 | 649 | 632 | 152.0 |
| D | 8 | 195 | 65049 | 423.67 | 649 | 632 | 152.0 |
| D | 1 | 7 | 43382 | 281.16 | 649 | 632 | 152.0 |
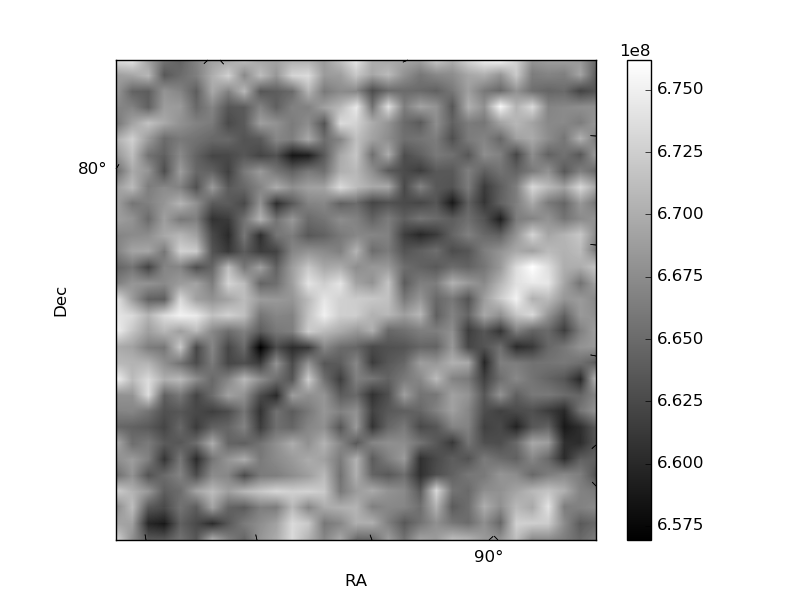
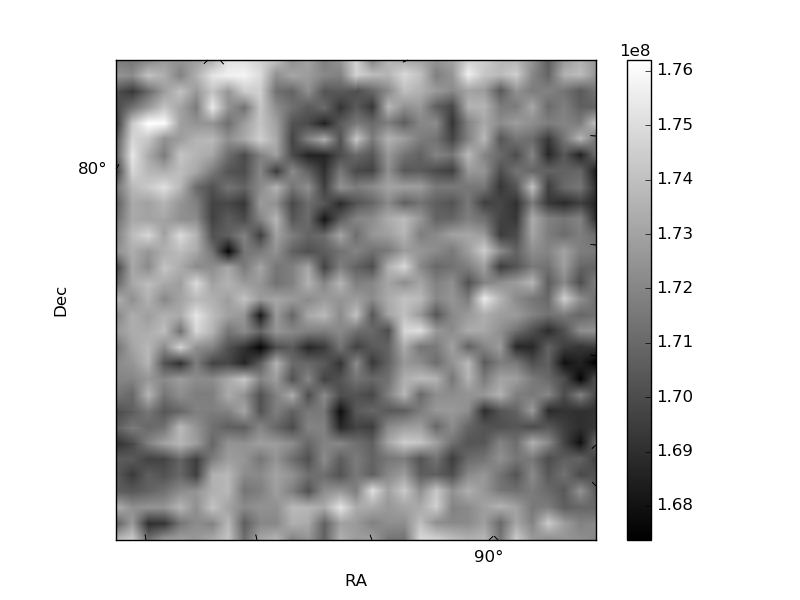
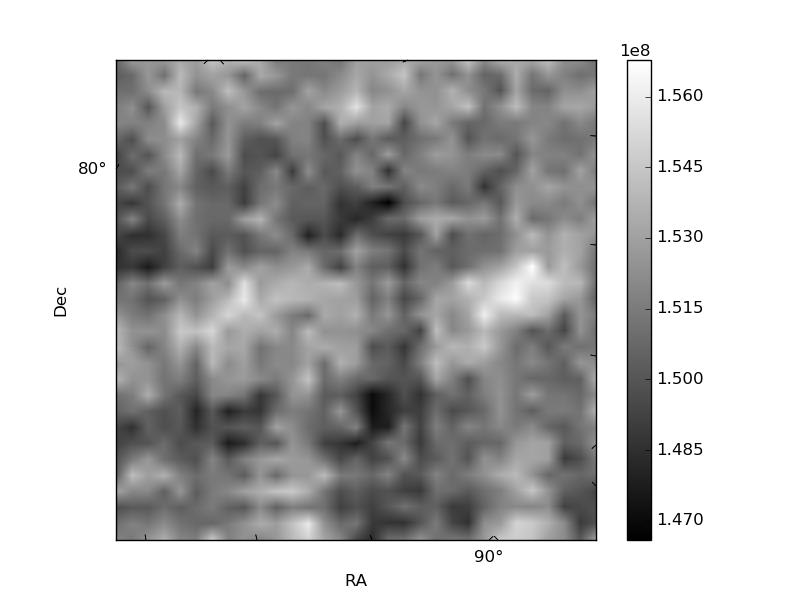
Histogram calculated using DETX and DETY for each event in the final _common_clean file
| Quadrant A | 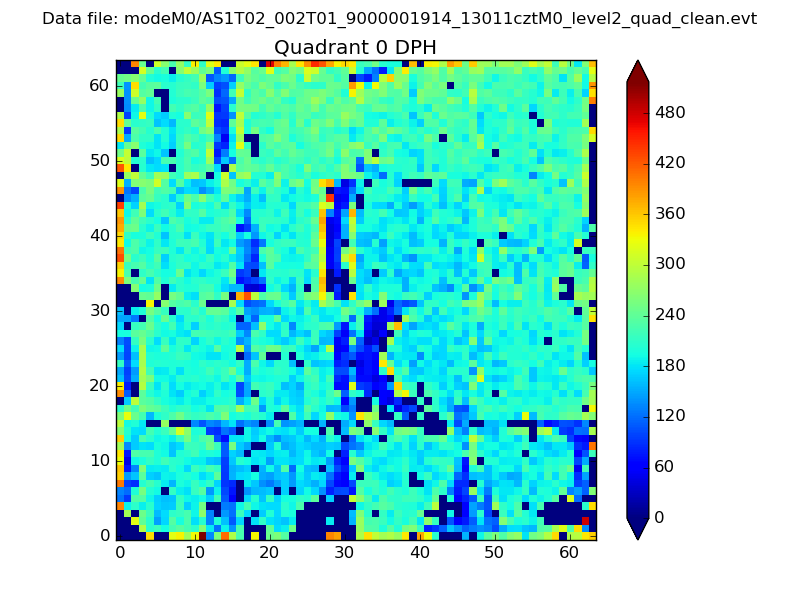 |
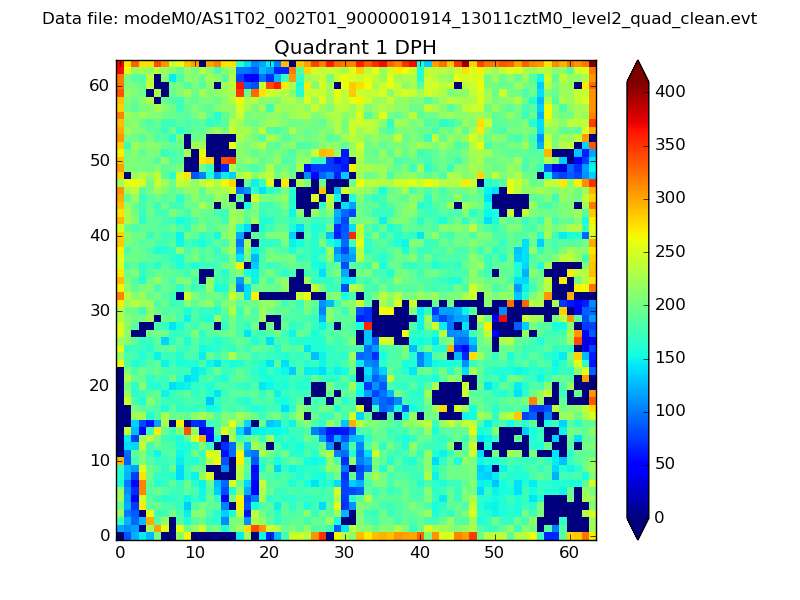 |
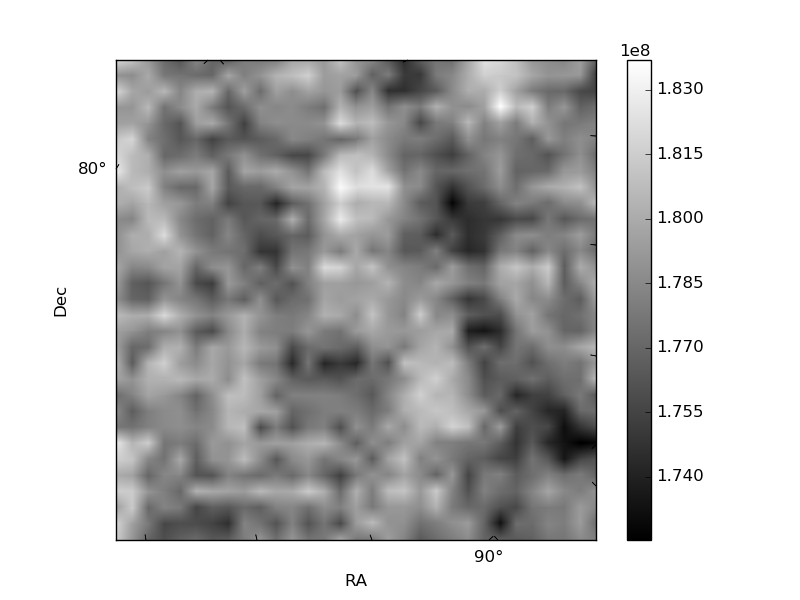
Quadrant B |
|---|---|---|---|
| Quadrant D | 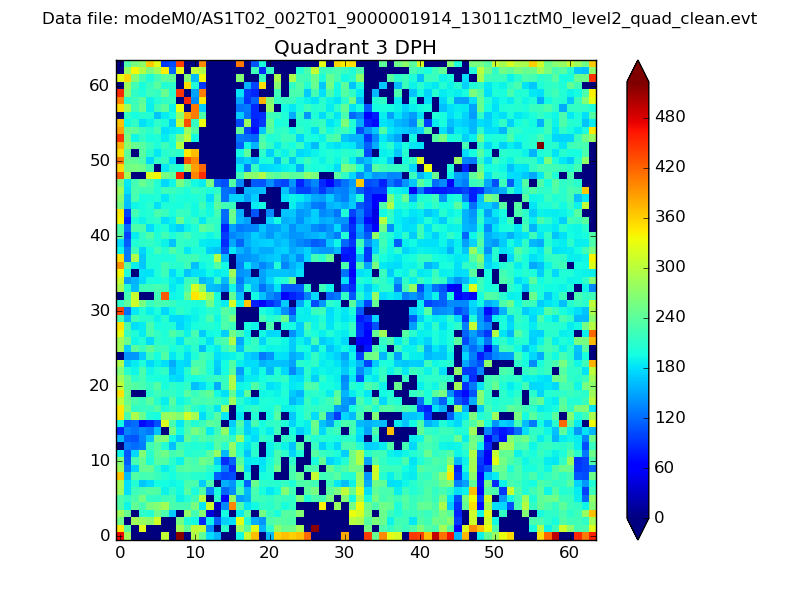 |
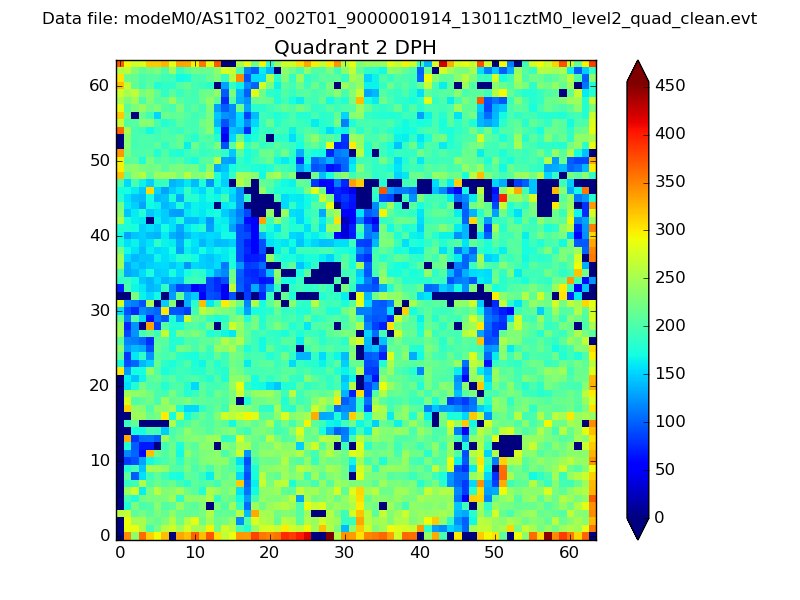 |
Quadrant C |
| Plot type | Count rate plots | Images |
|---|---|---|
| Comparison with Poisson distribution Blue bars denote a histogram of data divided into 1 sec bins. Red curve is a Poisson curve with rate = median count rate of data. |
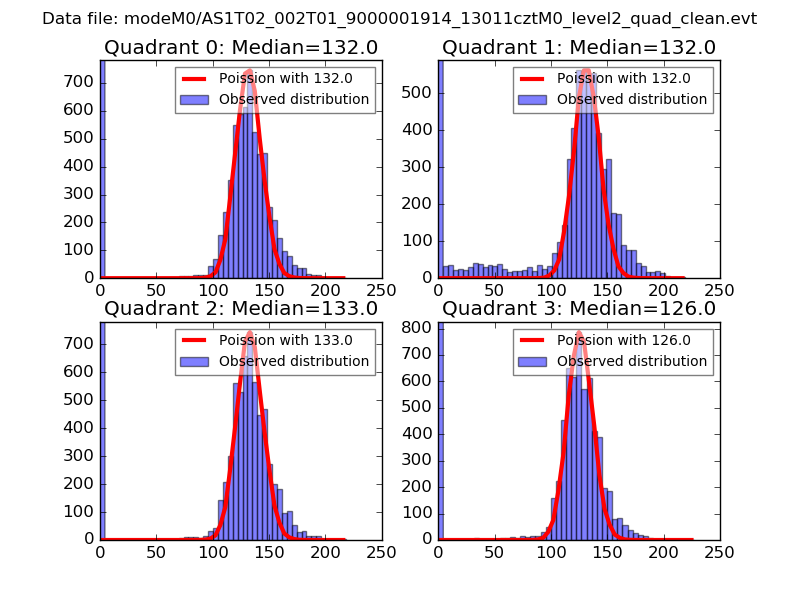 |
 |
| Quadrant-wise count rates Data is divided into 100 sec bins |
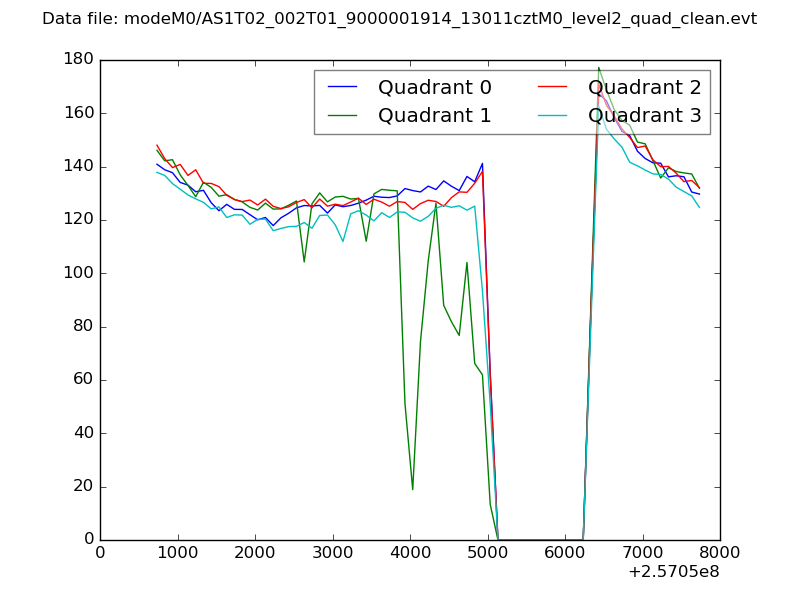 |
|
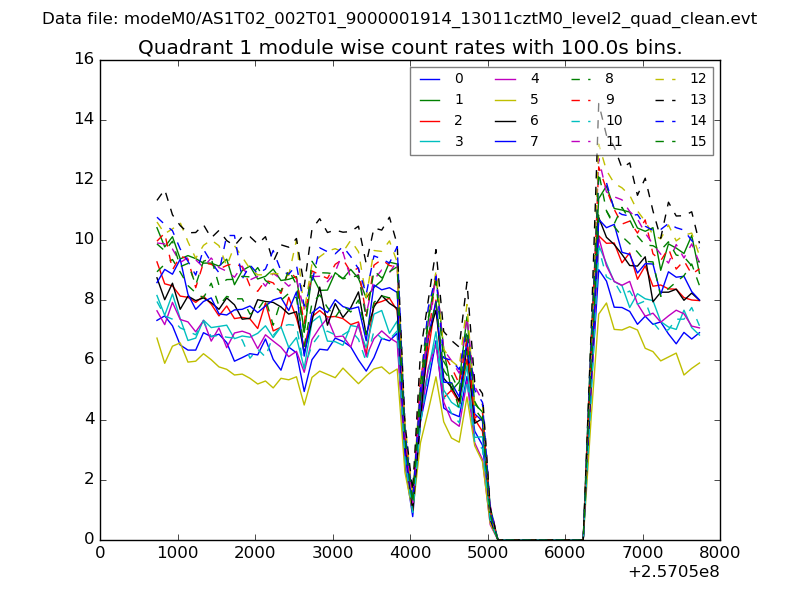
| Module-wise count rates for Quadrant A Data is divided into 100 sec bins |
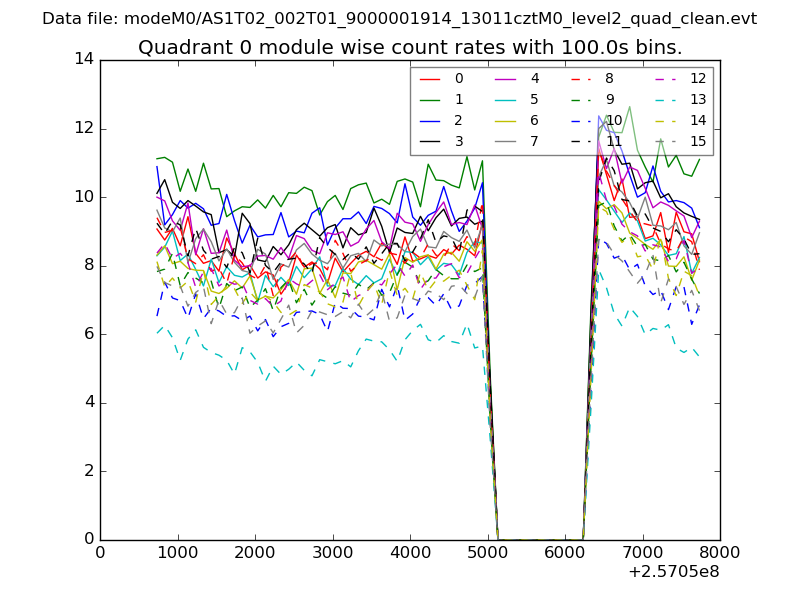 |
 |
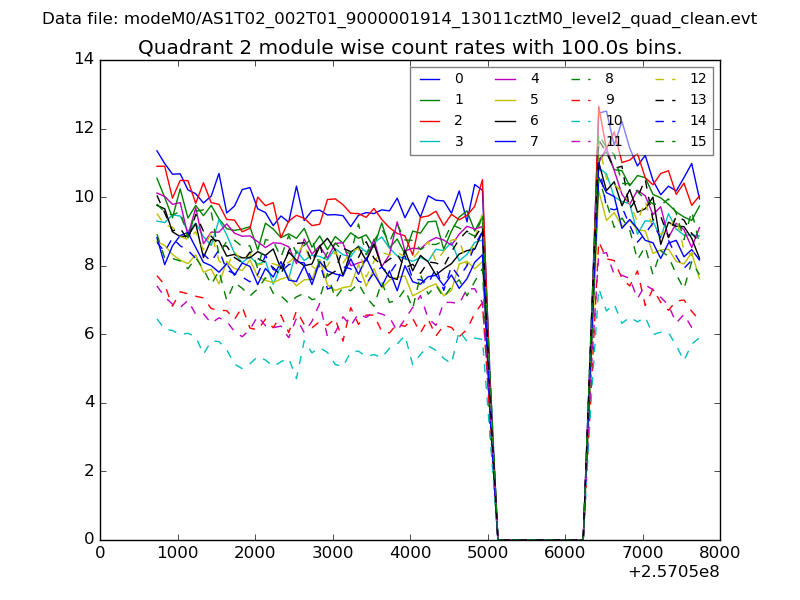
| Module-wise count rates for Quadrant B Data is divided into 100 sec bins |
 |
 |
| Module-wise count rates for Quadrant C Data is divided into 100 sec bins |
 |
 |
| Module-wise count rates for Quadrant D Data is divided into 100 sec bins |
 |
 |
| Parameter | Plot |
|---|---|
| CZT HV Monitor | 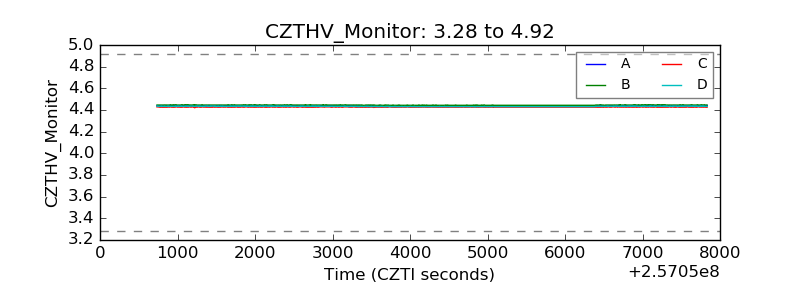 |
| D_VDD | 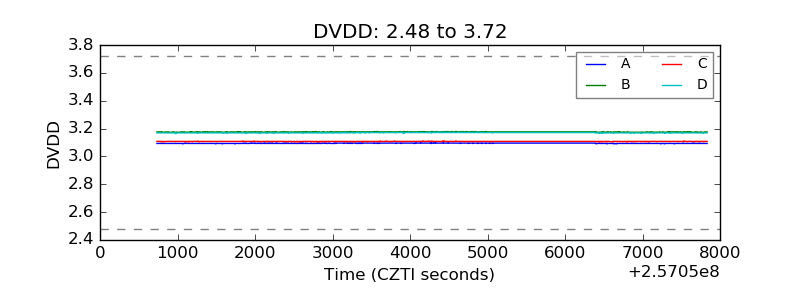 |
| Temperature 1 | 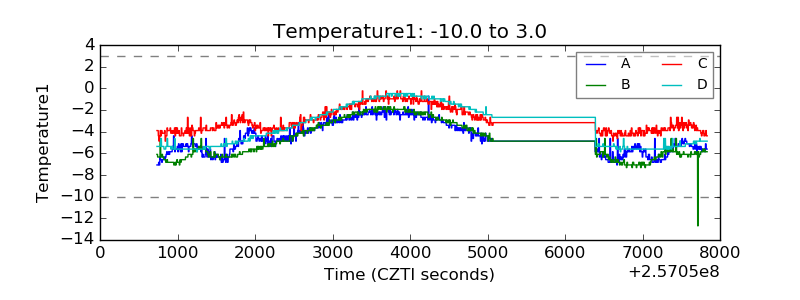 |
| Veto HV Monitor | 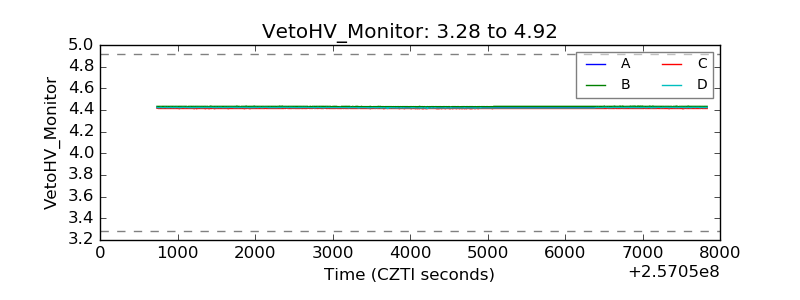 |
| Veto LLD | 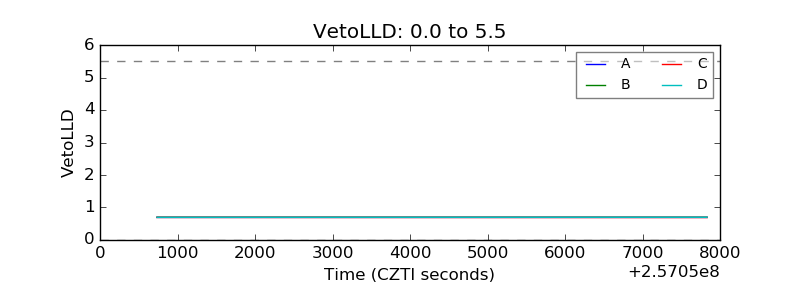 |
| Alpha Counter | 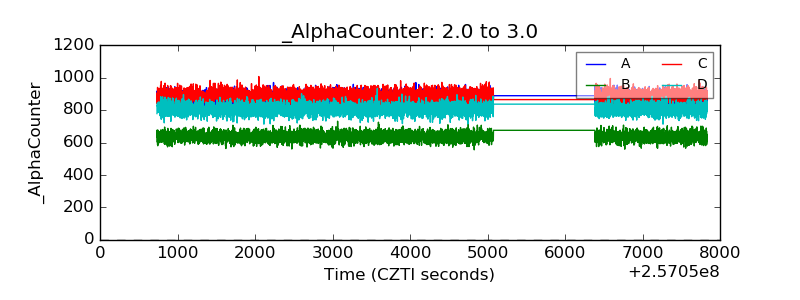 |
| _CPM_Rate | 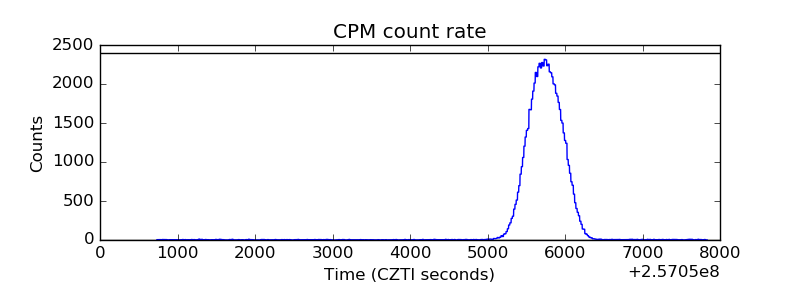 |
| CZT Counter | 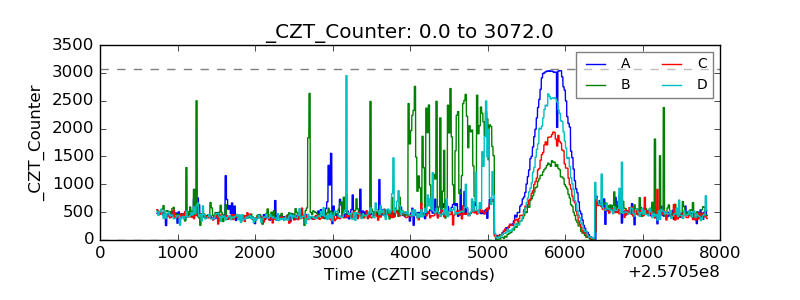 |
| +2.5 Volts monitor |  |
| +5 Volts monitor |  |
| _ROLL_ROT |  |
| _Roll_DEC |  |
| _Roll_RA | 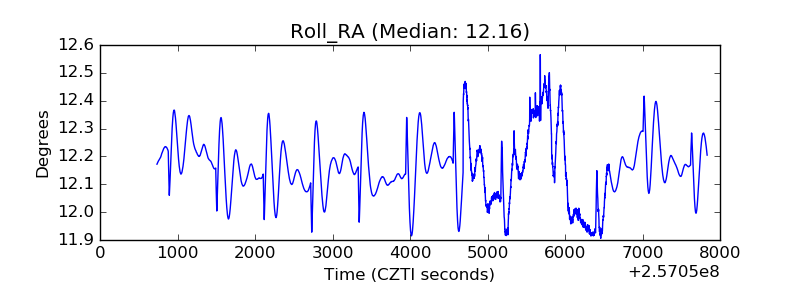 |
| Veto Counter | 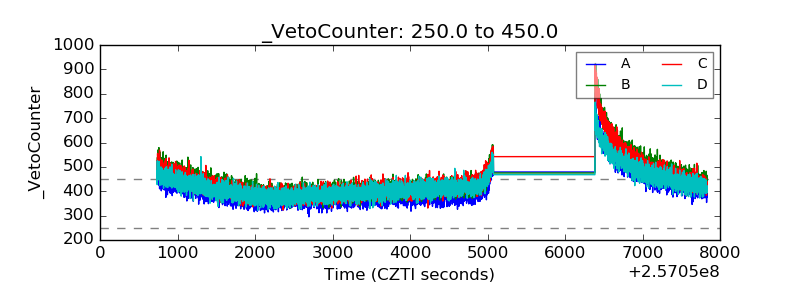 |