| Param | Original file | Final file |
|---|---|---|
| Filename | modeM0/AS1T02_002T01_9000001914_13012cztM0_level2.evt | modeM0/AS1T02_002T01_9000001914_13012cztM0_level2_quad_clean.evt |
| Size (bytes) | 485,144,640 | 121,533,120 |
| Size | 462.7 MB | 115.9 MB |
| Events in quadrant A | 3,230,080 | 832,228 |
| Events in quadrant B | 3,979,816 | 823,946 |
| Events in quadrant C | 2,778,293 | 832,628 |
| Events in quadrant D | 4,291,316 | 767,180 |
| Mode M9 | |||
|---|---|---|---|
| Quadrant | BADHDUFLAG | Total packets | Discarded packets |
| A | 0 | 13 | 0 |
| B | 0 | 13 | 0 |
| C | 0 | 13 | 0 |
| D | 0 | 13 | 0 |
| Mode M0 | |||
|---|---|---|---|
| Quadrant | BADHDUFLAG | Total packets | Discarded packets |
| A | 0 | 13404 | 2 |
| B | 0 | 15672 | 1 |
| C | 0 | 12396 | 1 |
| D | 0 | 16798 | 1 |
| Mode SS | |||
|---|---|---|---|
| Quadrant | BADHDUFLAG | Total packets | Discarded packets |
| A | 0 | 124 | 0 |
| B | 0 | 124 | 0 |
| C | 0 | 124 | 0 |
| D | 0 | 124 | 0 |
| Quadrant | Total seconds | Saturated seconds | Saturation percentage |
|---|---|---|---|
| A | 6082 | 104 | 1.709964% |
| B | 6082 | 415 | 6.823413% |
| C | 6082 | 30 | 0.493259% |
| D | 6082 | 363 | 5.968431% |
Noise dominated data is calculated using 1-second bins in cleaned event files. If a bin has >2000 counts, and if more than 50% of those come from <1% of pixels, then it is considered to be noise-dominated and hence unusable.
| Quadrant | # 1 sec bins | Bins with >0 counts | Bins with >2000 counts | High rate bins dominated by noise | Noise dominated (total time) | Noise dominated (detector-on time) | Marked lightcurve |
|---|---|---|---|---|---|---|---|
| A | 7393 | 6085 | 23 | 23 | 0.31% | 0.38% | 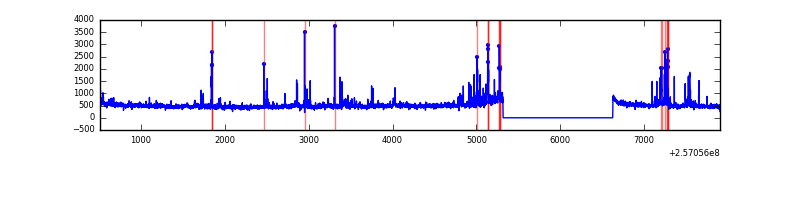 |
| B | 7393 | 6085 | 235 | 235 | 3.18% | 3.86% | 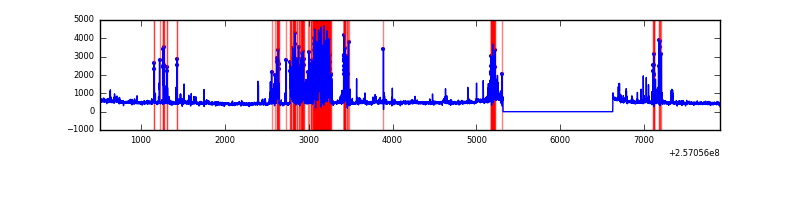 |
| C | 7393 | 6085 | 1 | 1 | 0.01% | 0.02% | 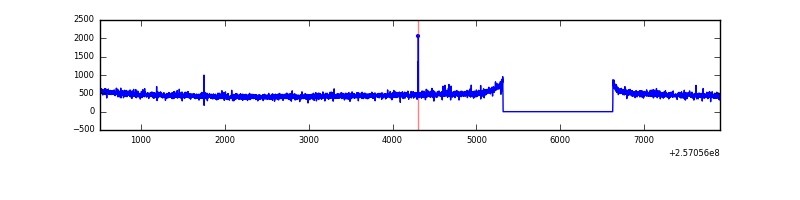 |
| D | 7393 | 6085 | 240 | 240 | 3.25% | 3.94% | 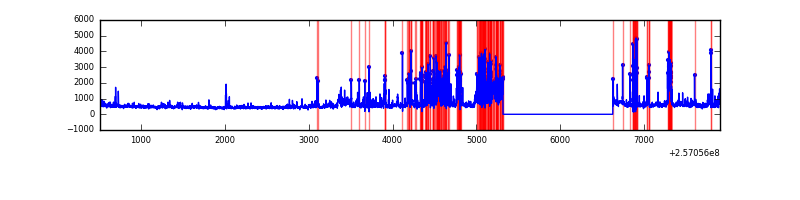 |
Top three noisy pixels from each quadrant. If the there are fewer than three noisy pixels in the level2.evt file, extra rows are filled as -1
| Pixel properties | Quadrant properties | ||||||
|---|---|---|---|---|---|---|---|
| Quadrant | DetID | PixID | Counts | Sigma | Mean | Median | Sigma |
| A | 15 | 223 | 145003 | 989.88 | 735 | 721 | 145.8 |
| A | 12 | 189 | 83862 | 570.41 | 735 | 721 | 145.8 |
| A | 15 | 239 | 76393 | 519.16 | 735 | 721 | 145.8 |
| B | 4 | 239 | 963891 | 7332.24 | 716 | 700 | 131.4 |
| B | 3 | 64 | 96560 | 729.73 | 716 | 700 | 131.4 |
| B | 0 | 229 | 34365 | 256.27 | 716 | 700 | 131.4 |
| C | 14 | 234 | 7911 | 44.55 | 709 | 713 | 161.6 |
| C | 13 | 61 | 5149 | 27.46 | 709 | 713 | 161.6 |
| C | 12 | 4 | 4212 | 21.66 | 709 | 713 | 161.6 |
| D | 1 | 52 | 1552619 | 9603.99 | 689 | 669 | 161.6 |
| D | 2 | 14 | 99353 | 610.69 | 689 | 669 | 161.6 |
| D | 2 | 234 | 22863 | 137.34 | 689 | 669 | 161.6 |
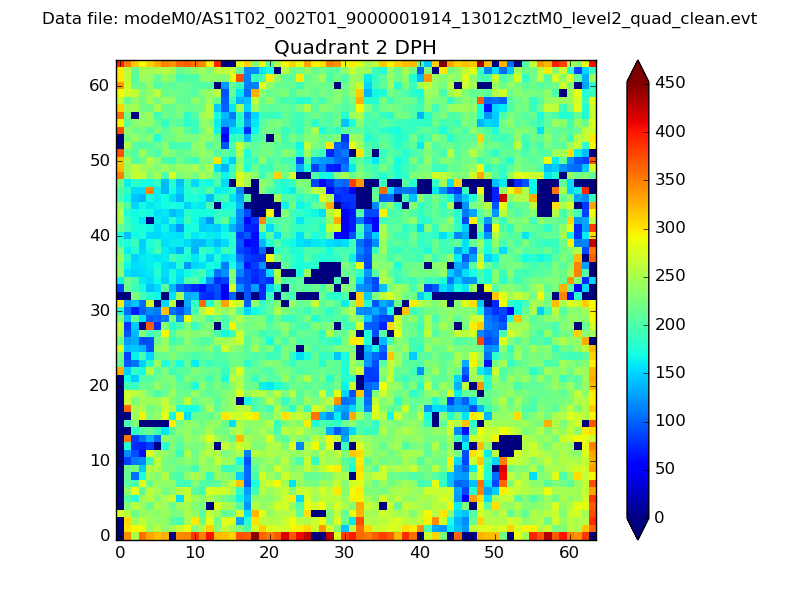
Histogram calculated using DETX and DETY for each event in the final _common_clean file
| Quadrant A | 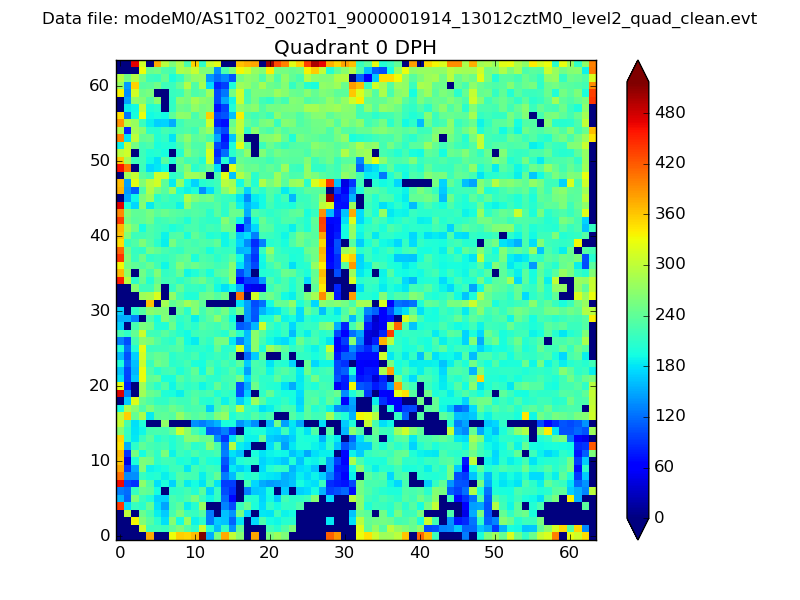 |
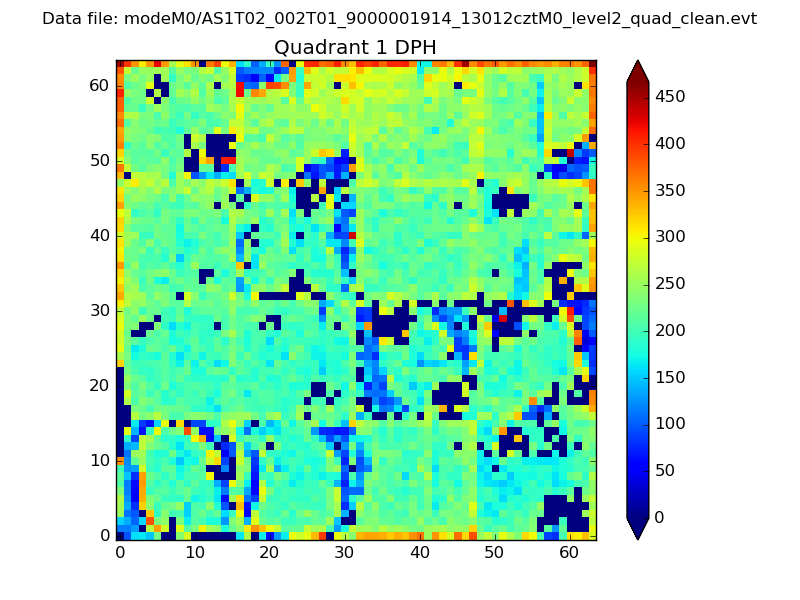 |
Quadrant B |
|---|---|---|---|
| Quadrant D | 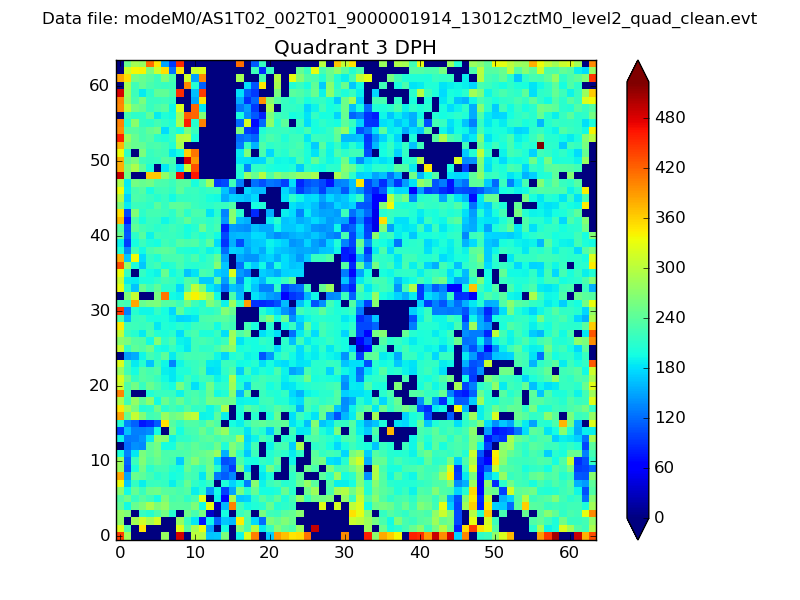 |
 |
Quadrant C |
| Plot type | Count rate plots | Images |
|---|---|---|
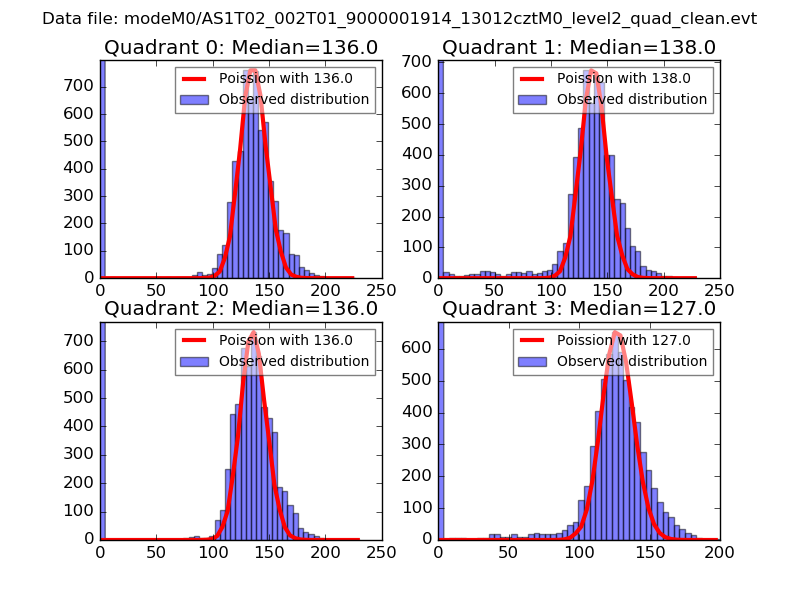
| Comparison with Poisson distribution Blue bars denote a histogram of data divided into 1 sec bins. Red curve is a Poisson curve with rate = median count rate of data. |
 |
 |
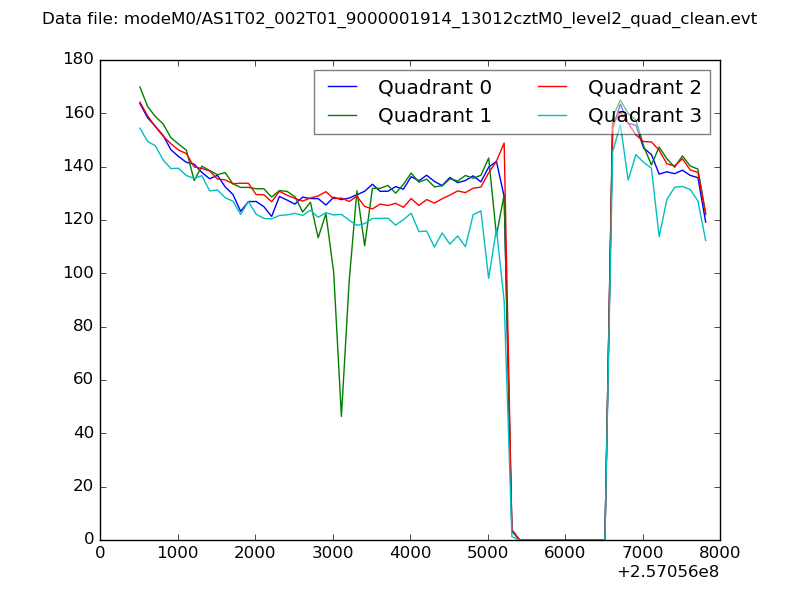
| Quadrant-wise count rates Data is divided into 100 sec bins |
 |
|
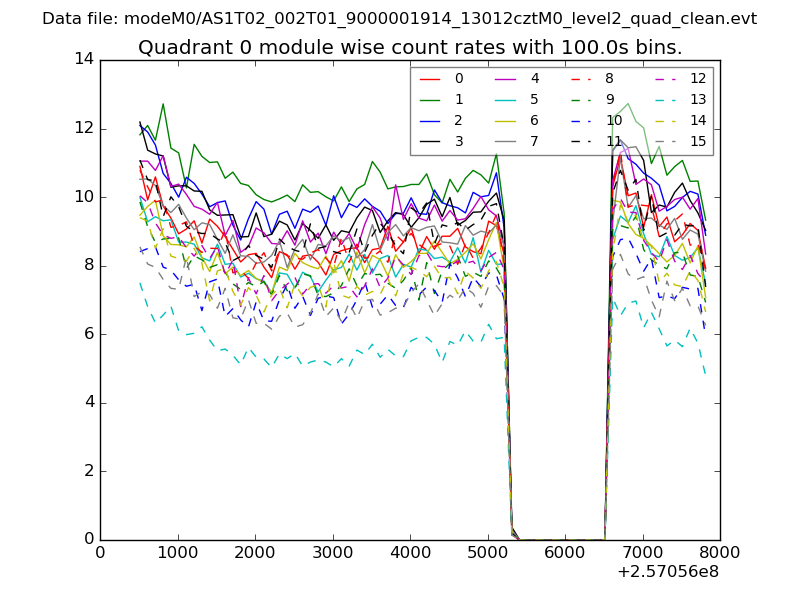
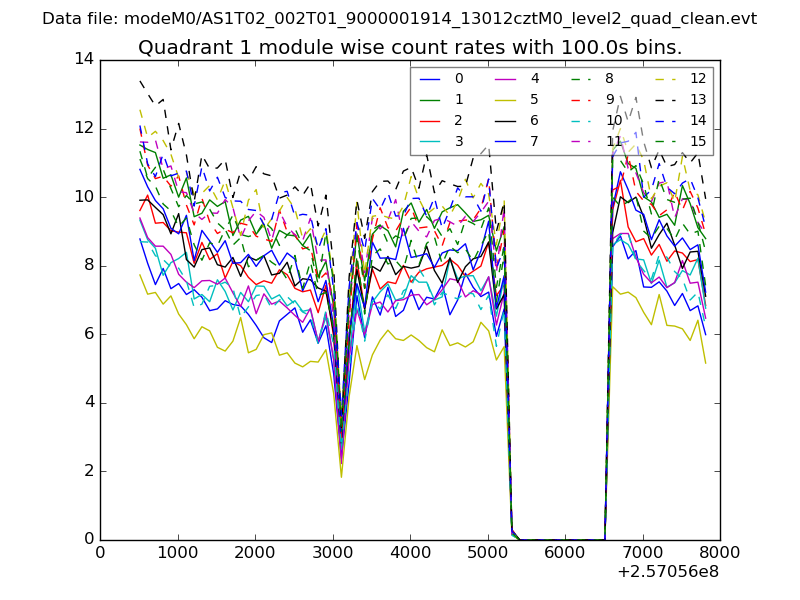
| Module-wise count rates for Quadrant A Data is divided into 100 sec bins |
 |
 |
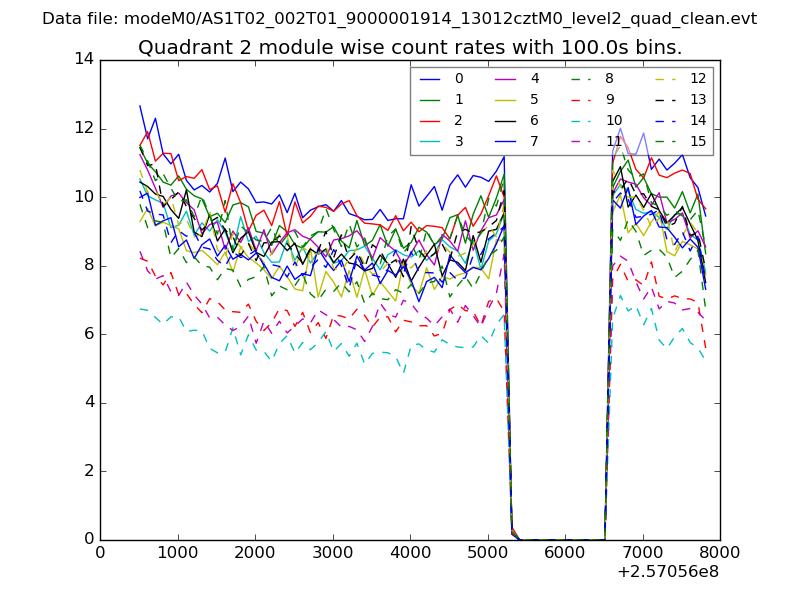
| Module-wise count rates for Quadrant B Data is divided into 100 sec bins |
 |
 |
| Module-wise count rates for Quadrant C Data is divided into 100 sec bins |
 |
 |
| Module-wise count rates for Quadrant D Data is divided into 100 sec bins |
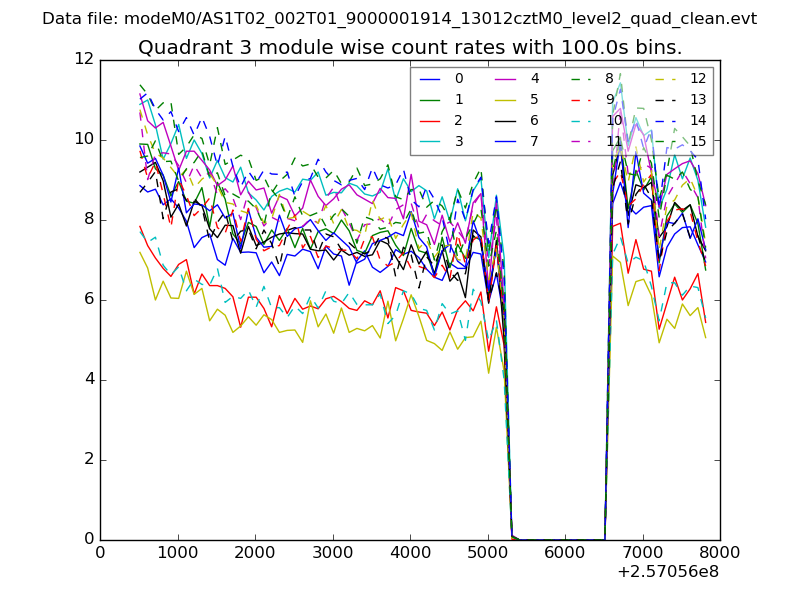 |
 |
| Parameter | Plot |
|---|---|
| CZT HV Monitor | 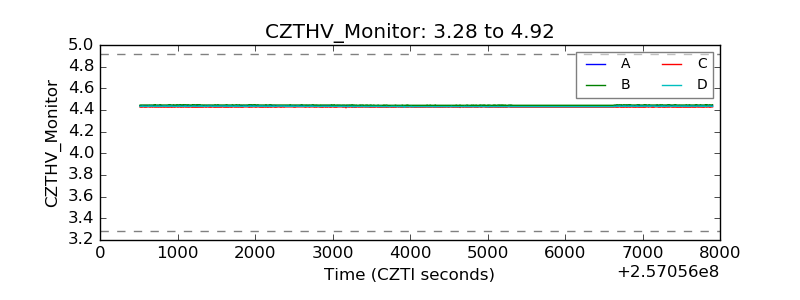 |
| D_VDD | 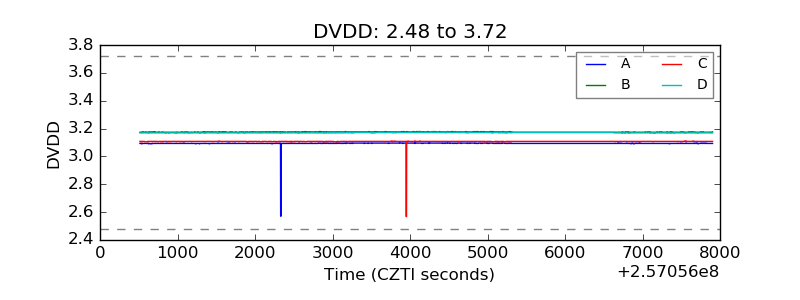 |
| Temperature 1 | 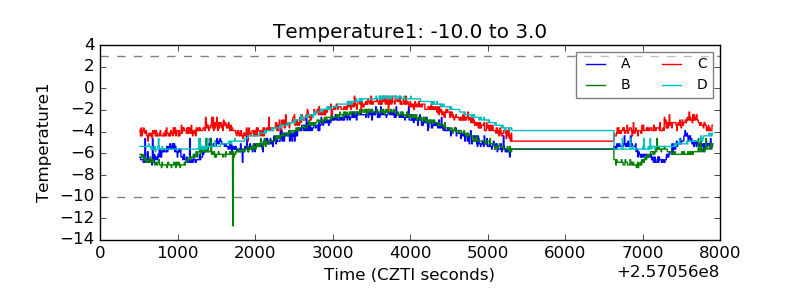 |
| Veto HV Monitor | 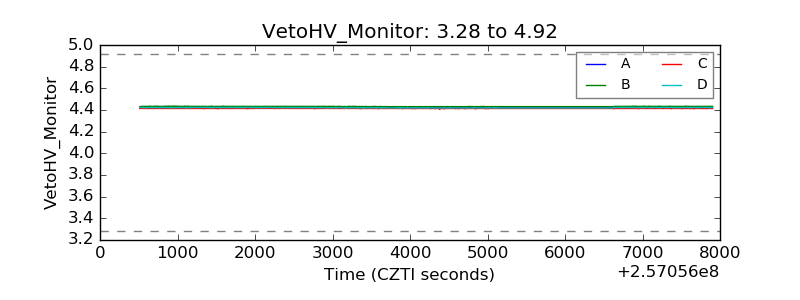 |
| Veto LLD | 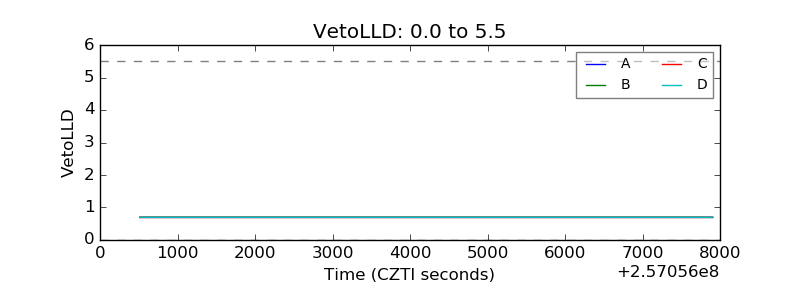 |
| Alpha Counter | 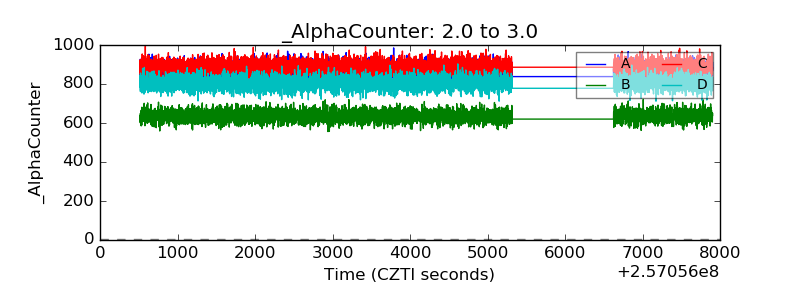 |
| _CPM_Rate | 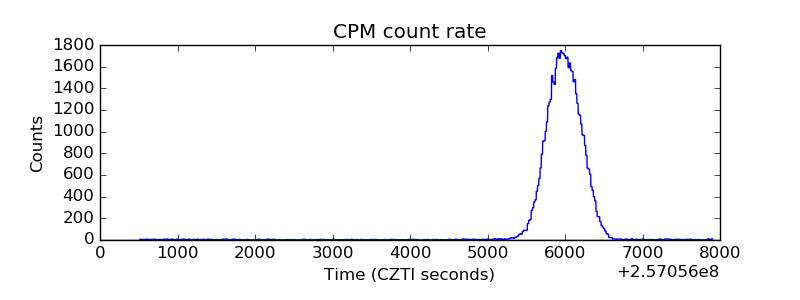 |
| CZT Counter | 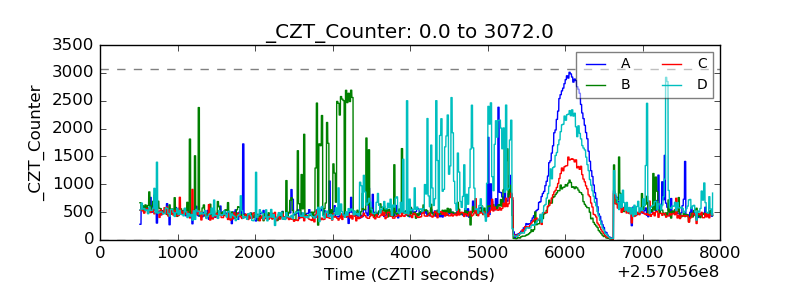 |
| +2.5 Volts monitor | 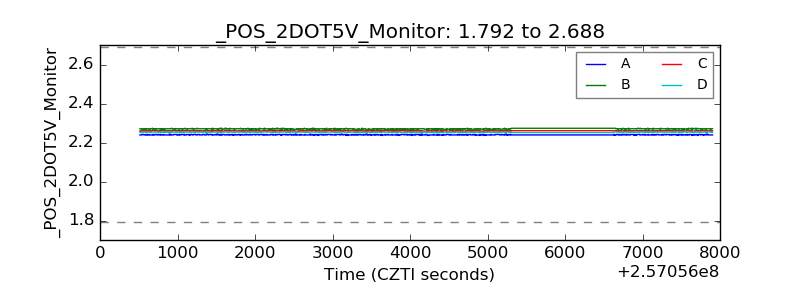 |
| +5 Volts monitor |  |
| _ROLL_ROT | 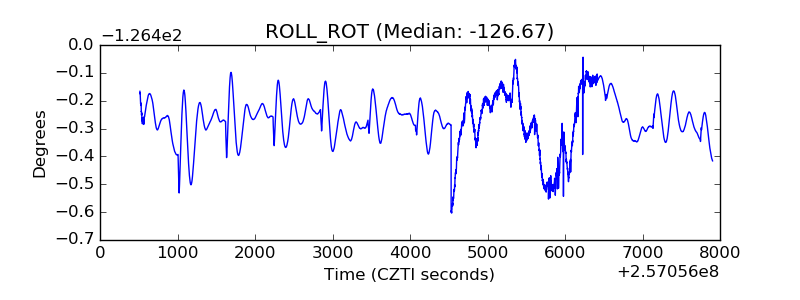 |
| _Roll_DEC | 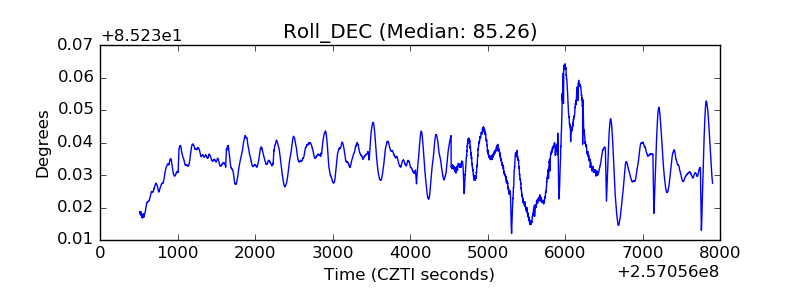 |
| _Roll_RA | 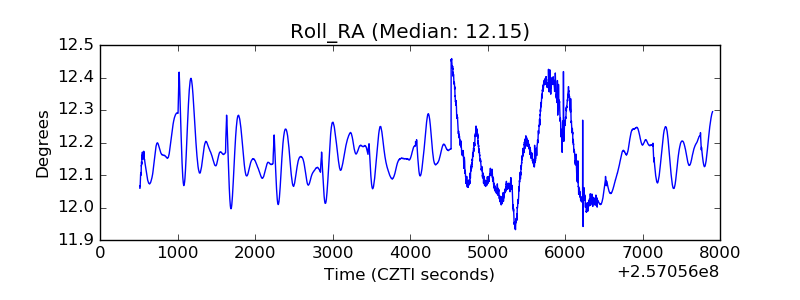 |
| Veto Counter | 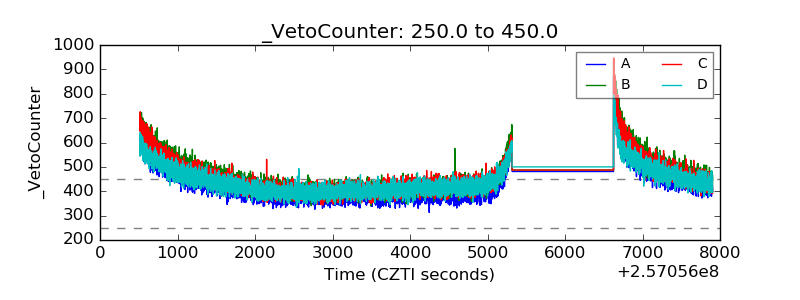 |