| Param | Original file | Final file |
|---|---|---|
| Filename | modeM0/AS1T02_002T01_9000001914_13013cztM0_level2.evt | modeM0/AS1T02_002T01_9000001914_13013cztM0_level2_quad_clean.evt |
| Size (bytes) | 537,883,200 | 122,598,720 |
| Size | 513.0 MB | 116.9 MB |
| Events in quadrant A | 3,405,812 | 862,616 |
| Events in quadrant B | 5,368,466 | 746,535 |
| Events in quadrant C | 2,907,531 | 855,078 |
| Events in quadrant D | 4,177,524 | 805,917 |
| Mode M9 | |||
|---|---|---|---|
| Quadrant | BADHDUFLAG | Total packets | Discarded packets |
| A | 0 | 17 | 0 |
| B | 0 | 17 | 0 |
| C | 0 | 17 | 0 |
| D | 0 | 18 | 0 |
| Mode M0 | |||
|---|---|---|---|
| Quadrant | BADHDUFLAG | Total packets | Discarded packets |
| A | 0 | 14103 | 3 |
| B | 0 | 20087 | 2 |
| C | 0 | 13049 | 2 |
| D | 0 | 16718 | 2 |
| Mode SS | |||
|---|---|---|---|
| Quadrant | BADHDUFLAG | Total packets | Discarded packets |
| A | 0 | 126 | 0 |
| B | 0 | 126 | 0 |
| C | 0 | 126 | 0 |
| D | 0 | 126 | 0 |
| Quadrant | Total seconds | Saturated seconds | Saturation percentage |
|---|---|---|---|
| A | 6352 | 108 | 1.700252% |
| B | 6352 | 1284 | 20.214106% |
| C | 6352 | 31 | 0.488035% |
| D | 6352 | 255 | 4.014484% |
Noise dominated data is calculated using 1-second bins in cleaned event files. If a bin has >2000 counts, and if more than 50% of those come from <1% of pixels, then it is considered to be noise-dominated and hence unusable.
| Quadrant | # 1 sec bins | Bins with >0 counts | Bins with >2000 counts | High rate bins dominated by noise | Noise dominated (total time) | Noise dominated (detector-on time) | Marked lightcurve |
|---|---|---|---|---|---|---|---|
| A | 7663 | 6354 | 37 | 37 | 0.48% | 0.58% | 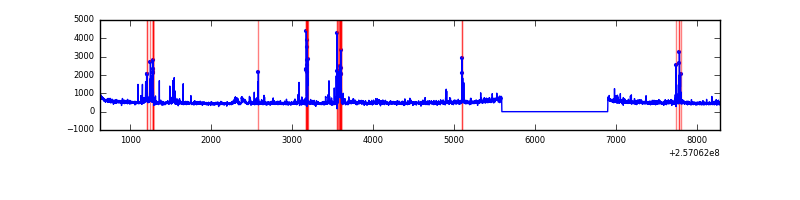 |
| B | 7663 | 6354 | 692 | 692 | 9.03% | 10.89% | 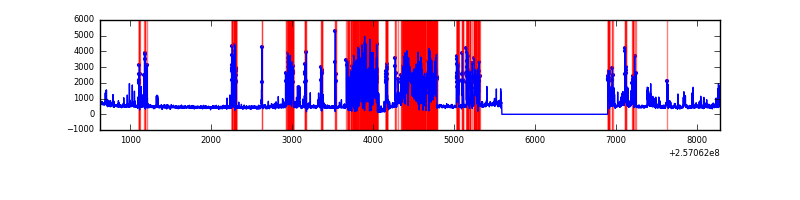 |
| C | 7663 | 6354 | 6 | 6 | 0.08% | 0.09% | 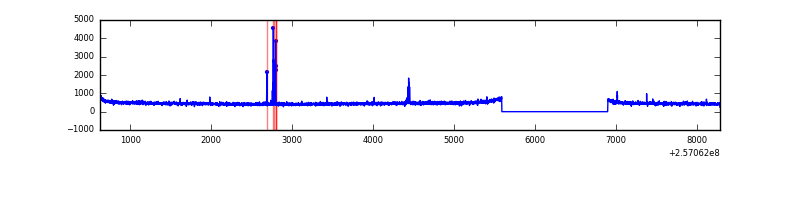 |
| D | 7663 | 6354 | 162 | 162 | 2.11% | 2.55% | 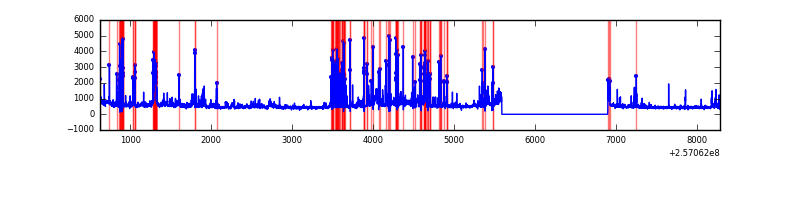 |
Top three noisy pixels from each quadrant. If the there are fewer than three noisy pixels in the level2.evt file, extra rows are filled as -1
| Pixel properties | Quadrant properties | ||||||
|---|---|---|---|---|---|---|---|
| Quadrant | DetID | PixID | Counts | Sigma | Mean | Median | Sigma |
| A | 15 | 223 | 184254 | 1202.69 | 767 | 752 | 152.6 |
| A | 15 | 239 | 76977 | 499.59 | 767 | 752 | 152.6 |
| A | 12 | 189 | 70817 | 459.21 | 767 | 752 | 152.6 |
| B | 4 | 239 | 2322460 | 18931.74 | 659 | 644 | 122.6 |
| B | 3 | 64 | 231668 | 1883.73 | 659 | 644 | 122.6 |
| B | 0 | 85 | 132631 | 1076.2 | 659 | 644 | 122.6 |
| C | 14 | 234 | 39150 | 230.68 | 734 | 738 | 166.5 |
| C | 13 | 61 | 5389 | 27.93 | 734 | 738 | 166.5 |
| C | 12 | 4 | 5111 | 26.26 | 734 | 738 | 166.5 |
| D | 1 | 52 | 1243060 | 7299.53 | 725 | 703 | 170.2 |
| D | 2 | 14 | 103848 | 606.03 | 725 | 703 | 170.2 |
| D | 8 | 195 | 61723 | 358.53 | 725 | 703 | 170.2 |
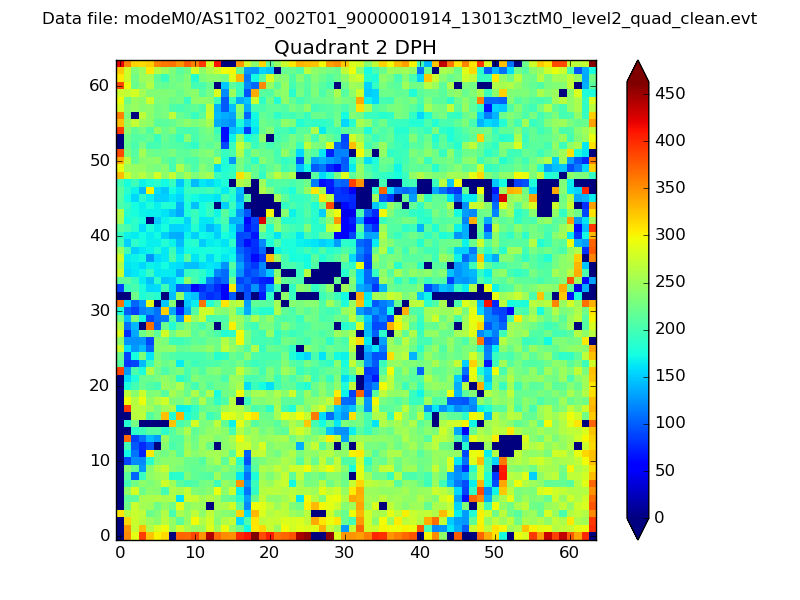
Histogram calculated using DETX and DETY for each event in the final _common_clean file
| Quadrant A | 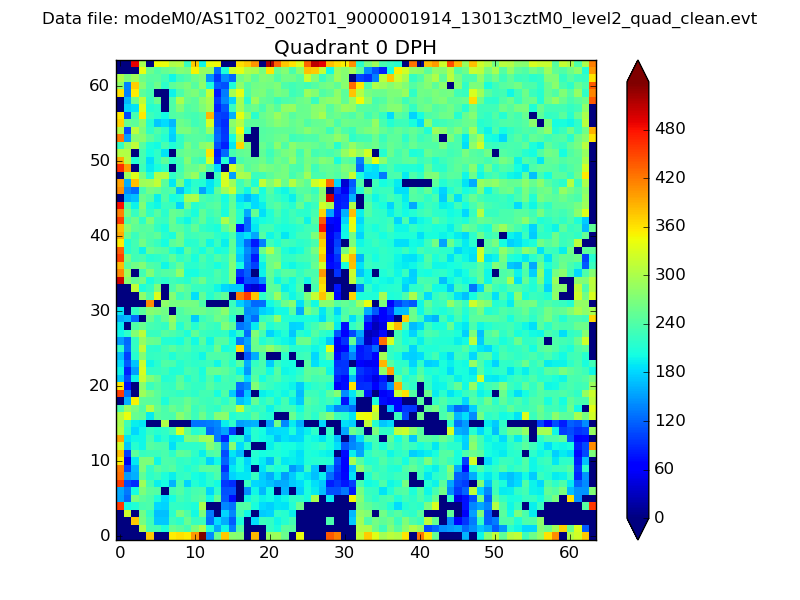 |
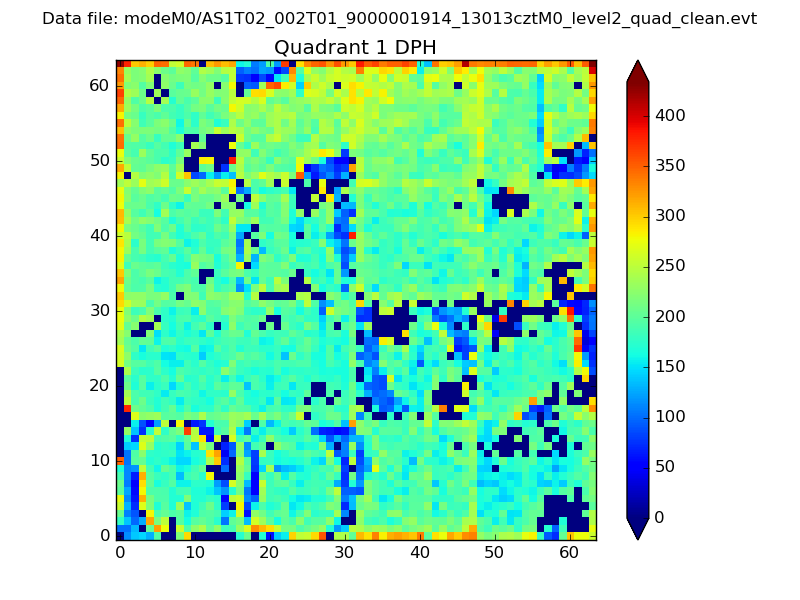 |
Quadrant B |
|---|---|---|---|
| Quadrant D | 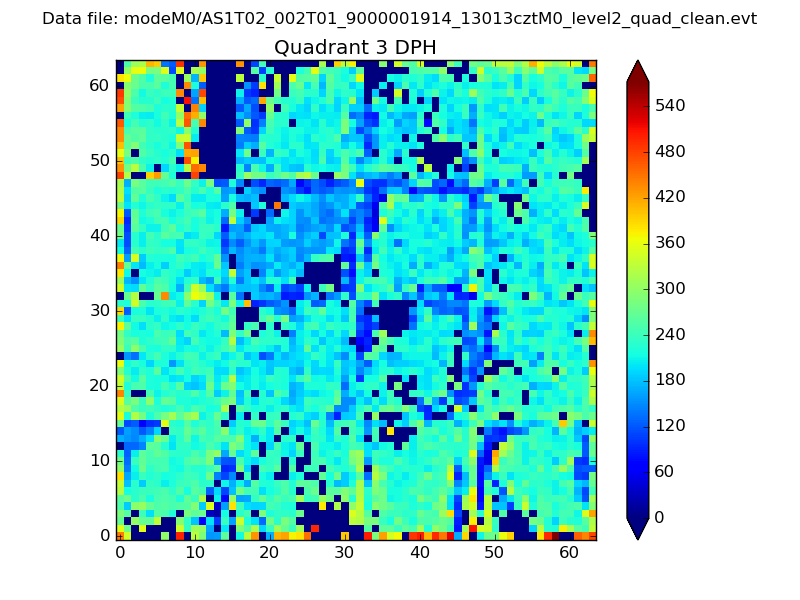 |
 |
Quadrant C |
| Plot type | Count rate plots | Images |
|---|---|---|
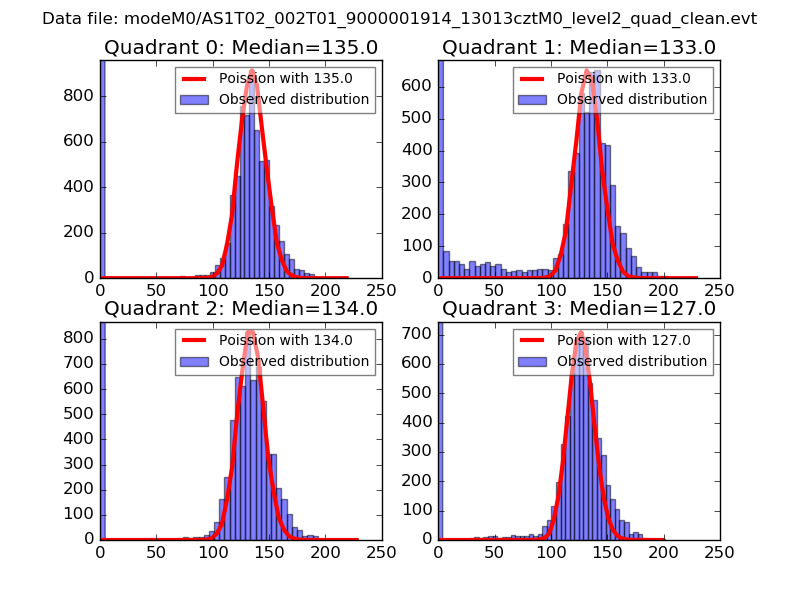
| Comparison with Poisson distribution Blue bars denote a histogram of data divided into 1 sec bins. Red curve is a Poisson curve with rate = median count rate of data. |
 |
 |
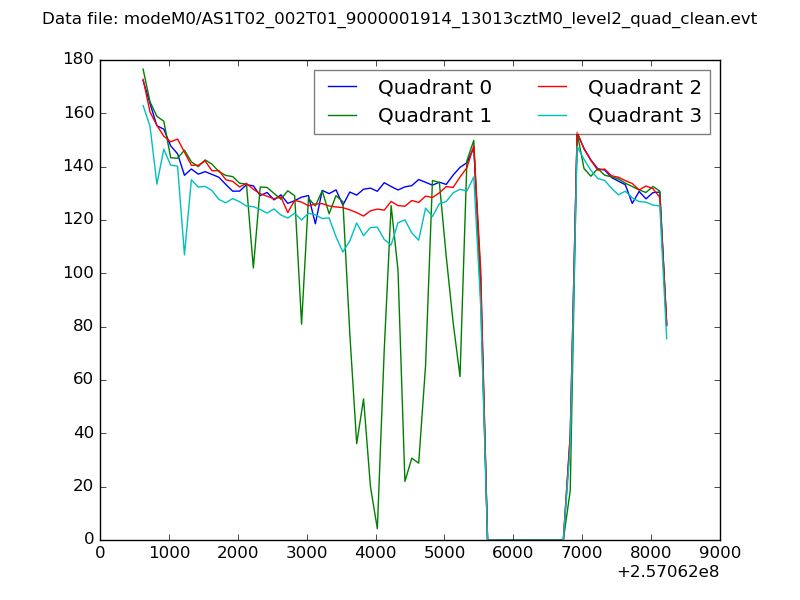
| Quadrant-wise count rates Data is divided into 100 sec bins |
 |
|
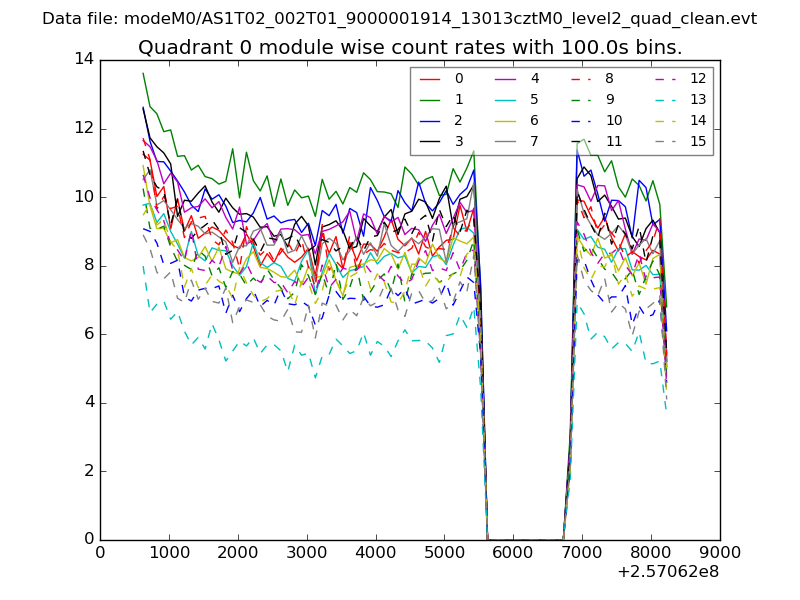
| Module-wise count rates for Quadrant A Data is divided into 100 sec bins |
 |
 |
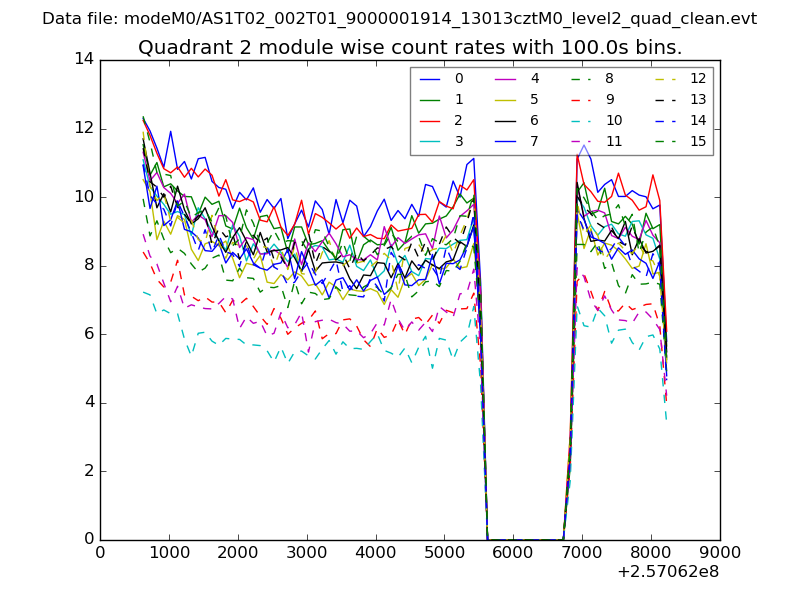
| Module-wise count rates for Quadrant B Data is divided into 100 sec bins |
 |
 |
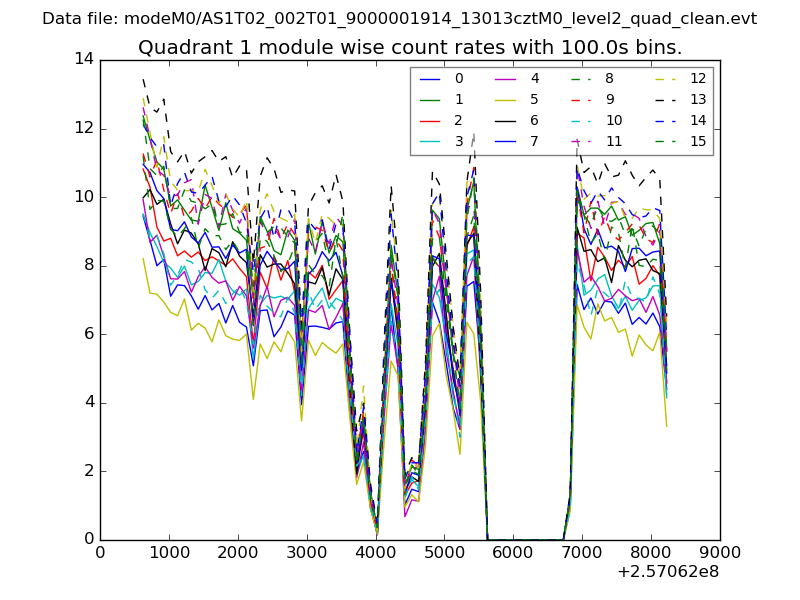
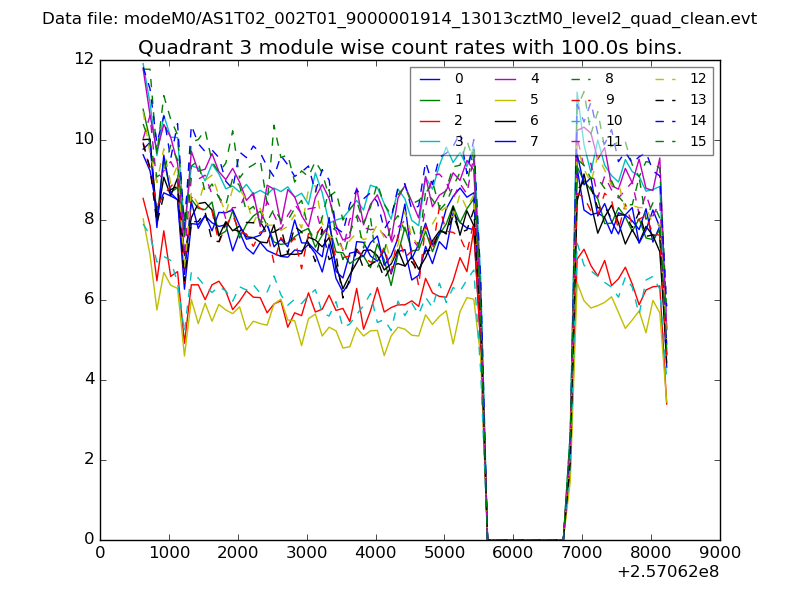
| Module-wise count rates for Quadrant C Data is divided into 100 sec bins |
 |
 |
| Module-wise count rates for Quadrant D Data is divided into 100 sec bins |
 |
 |
| Parameter | Plot |
|---|---|
| CZT HV Monitor | 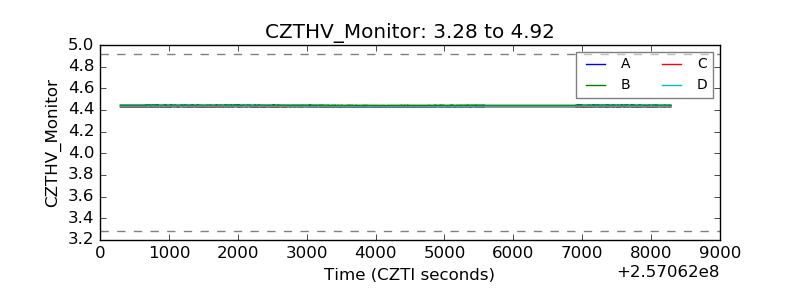 |
| D_VDD | 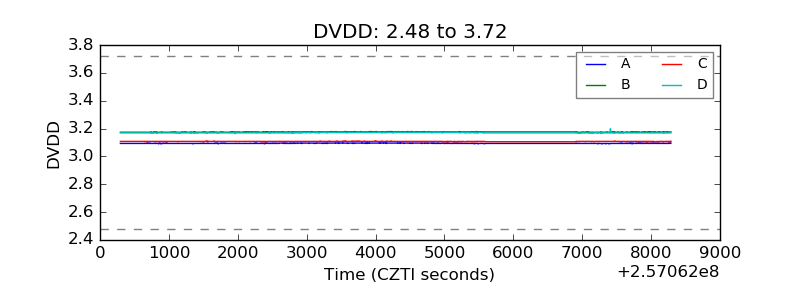 |
| Temperature 1 | 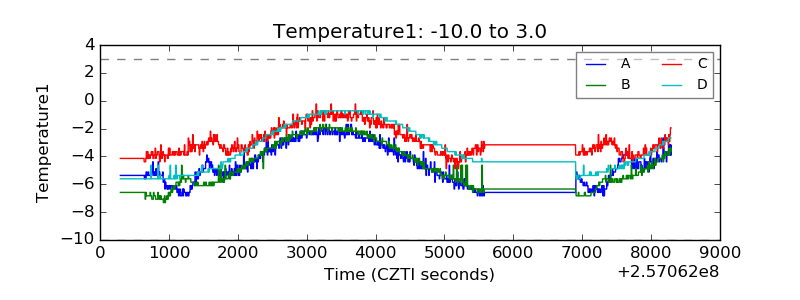 |
| Veto HV Monitor |  |
| Veto LLD | 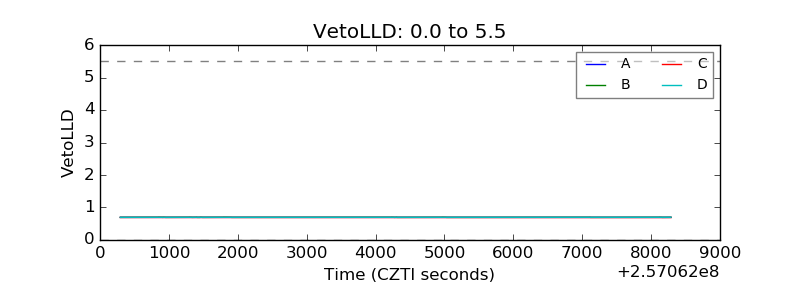 |
| Alpha Counter | 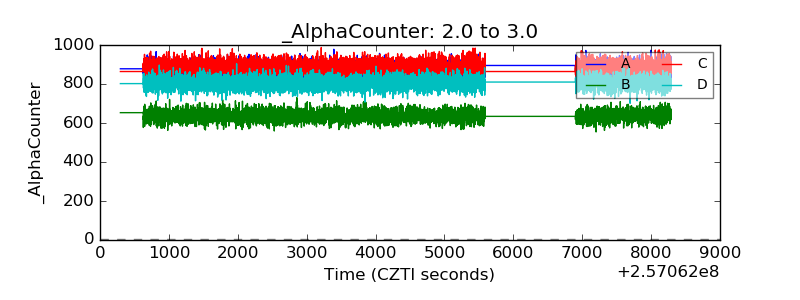 |
| _CPM_Rate | 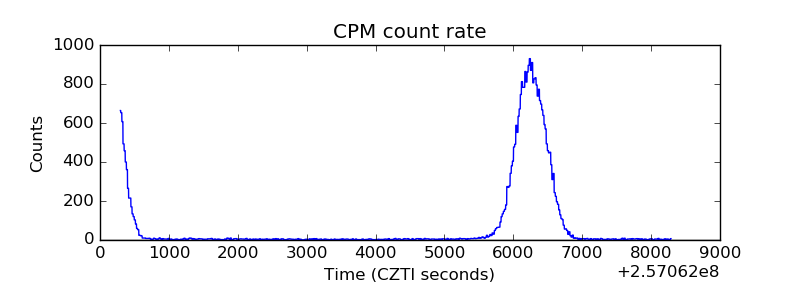 |
| CZT Counter | 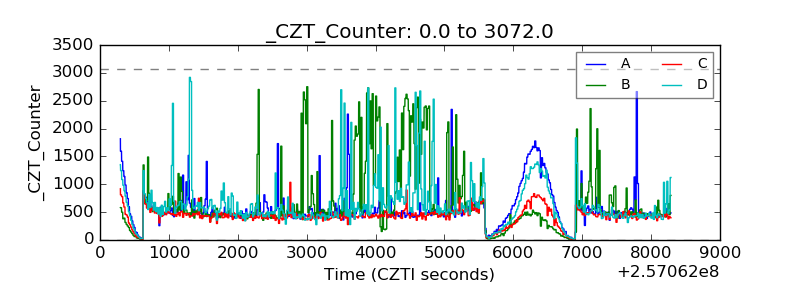 |
| +2.5 Volts monitor |  |
| +5 Volts monitor |  |
| _ROLL_ROT | 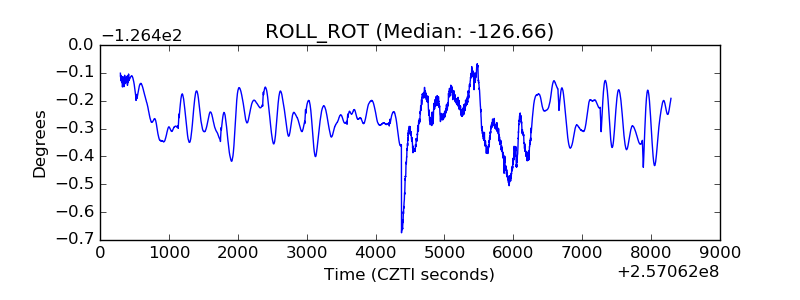 |
| _Roll_DEC | 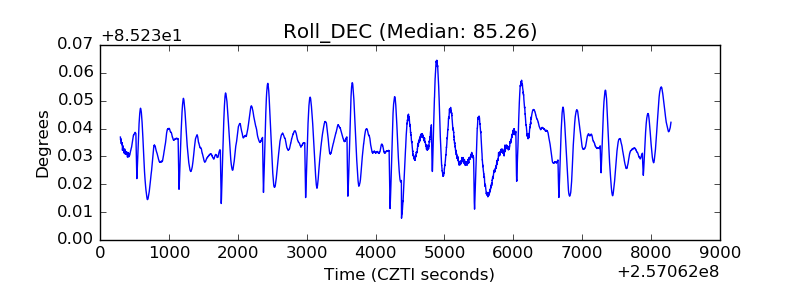 |
| _Roll_RA | 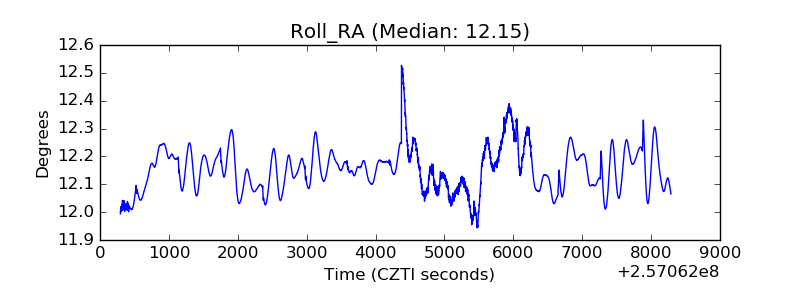 |
| Veto Counter | 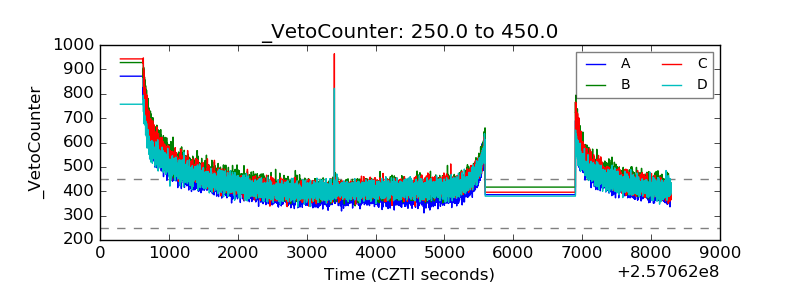 |