| Param | Original file | Final file |
|---|---|---|
| Filename | modeM0/AS1T02_002T01_9000001914_13015cztM0_level2.evt | modeM0/AS1T02_002T01_9000001914_13015cztM0_level2_quad_clean.evt |
| Size (bytes) | 581,322,240 | 128,949,120 |
| Size | 554.4 MB | 123.0 MB |
| Events in quadrant A | 3,430,729 | 891,431 |
| Events in quadrant B | 6,074,369 | 783,485 |
| Events in quadrant C | 3,127,907 | 890,891 |
| Events in quadrant D | 4,495,929 | 850,129 |
| Mode M9 | |||
|---|---|---|---|
| Quadrant | BADHDUFLAG | Total packets | Discarded packets |
| A | 0 | 7 | 0 |
| B | 0 | 7 | 0 |
| C | 0 | 7 | 0 |
| D | 0 | 7 | 0 |
| Mode M0 | |||
|---|---|---|---|
| Quadrant | BADHDUFLAG | Total packets | Discarded packets |
| A | 0 | 14860 | 3 |
| B | 0 | 22630 | 2 |
| C | 0 | 14367 | 2 |
| D | 0 | 18181 | 2 |
| Mode SS | |||
|---|---|---|---|
| Quadrant | BADHDUFLAG | Total packets | Discarded packets |
| A | 0 | 142 | 0 |
| B | 0 | 142 | 0 |
| C | 0 | 142 | 0 |
| D | 0 | 142 | 0 |
| Quadrant | Total seconds | Saturated seconds | Saturation percentage |
|---|---|---|---|
| A | 7019 | 117 | 1.666904% |
| B | 7019 | 1327 | 18.905827% |
| C | 7019 | 43 | 0.612623% |
| D | 7020 | 340 | 4.843305% |
Noise dominated data is calculated using 1-second bins in cleaned event files. If a bin has >2000 counts, and if more than 50% of those come from <1% of pixels, then it is considered to be noise-dominated and hence unusable.
| Quadrant | # 1 sec bins | Bins with >0 counts | Bins with >2000 counts | High rate bins dominated by noise | Noise dominated (total time) | Noise dominated (detector-on time) | Marked lightcurve |
|---|---|---|---|---|---|---|---|
| A | 7720 | 7021 | 20 | 20 | 0.26% | 0.28% | 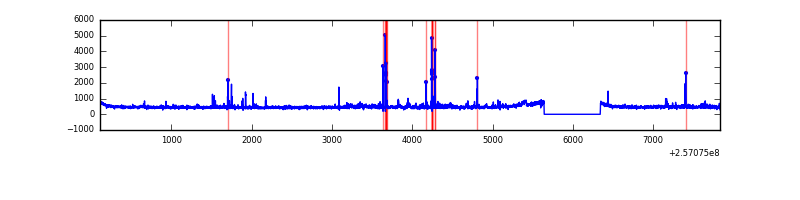 |
| B | 7720 | 7021 | 949 | 949 | 12.29% | 13.52% | 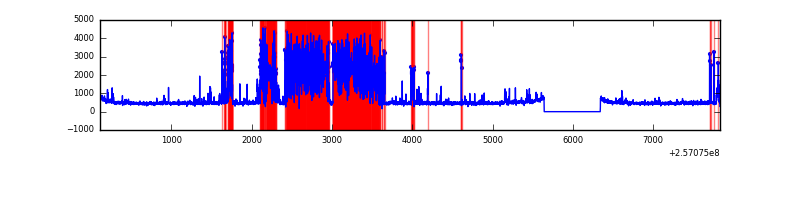 |
| C | 7720 | 7021 | 6 | 6 | 0.08% | 0.09% | 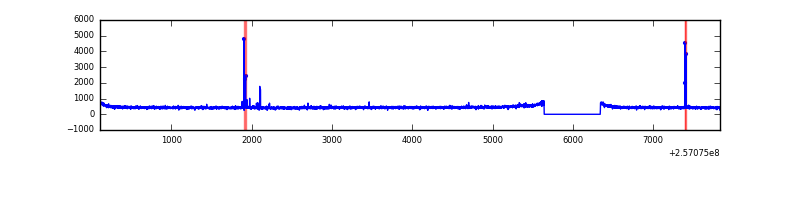 |
| D | 7721 | 7022 | 219 | 219 | 2.84% | 3.12% |  |
Top three noisy pixels from each quadrant. If the there are fewer than three noisy pixels in the level2.evt file, extra rows are filled as -1
| Pixel properties | Quadrant properties | ||||||
|---|---|---|---|---|---|---|---|
| Quadrant | DetID | PixID | Counts | Sigma | Mean | Median | Sigma |
| A | 12 | 189 | 102609 | 620.65 | 817 | 799 | 164.0 |
| A | 15 | 223 | 61091 | 367.55 | 817 | 799 | 164.0 |
| A | 15 | 174 | 36487 | 217.56 | 817 | 799 | 164.0 |
| B | 4 | 239 | 2996564 | 21882.47 | 726 | 706 | 136.9 |
| B | 3 | 64 | 81450 | 589.77 | 726 | 706 | 136.9 |
| B | 0 | 214 | 29648 | 211.4 | 726 | 706 | 136.9 |
| C | 0 | 207 | 30690 | 165.91 | 788 | 789 | 180.2 |
| C | 14 | 234 | 16679 | 88.17 | 788 | 789 | 180.2 |
| C | 13 | 61 | 5727 | 27.4 | 788 | 789 | 180.2 |
| D | 1 | 52 | 1453017 | 7723.77 | 781 | 758 | 188.0 |
| D | 8 | 195 | 44762 | 234.03 | 781 | 758 | 188.0 |
| D | 2 | 234 | 23019 | 118.39 | 781 | 758 | 188.0 |
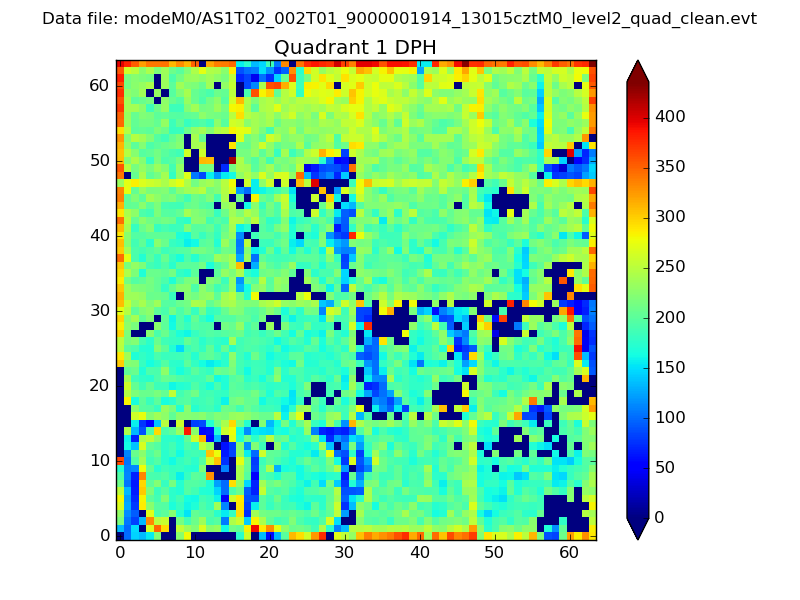
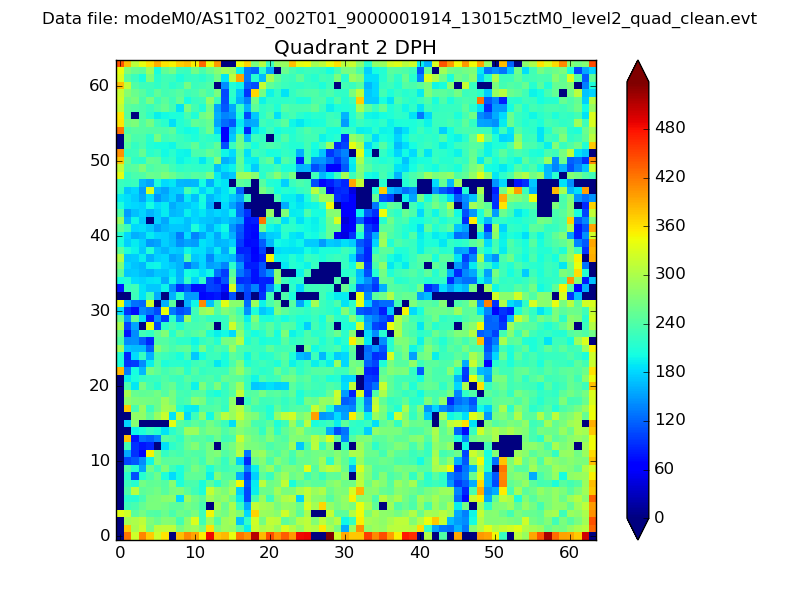
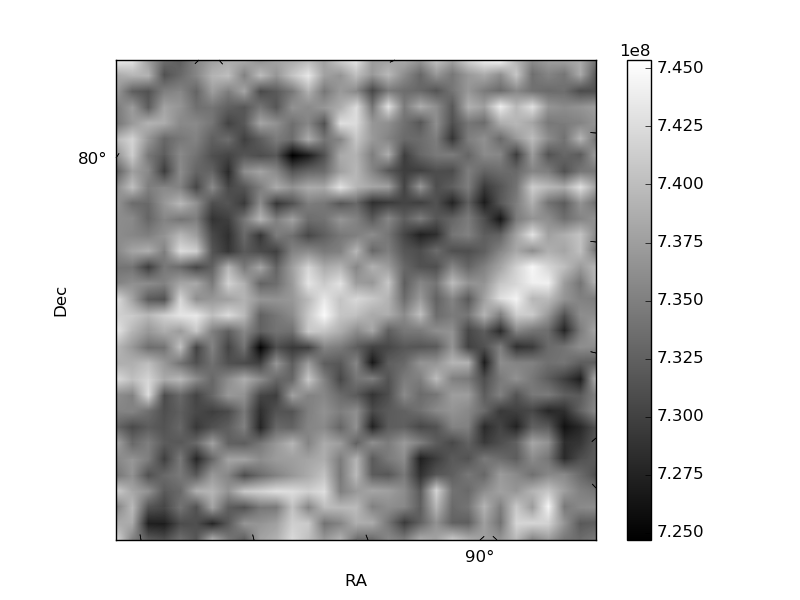
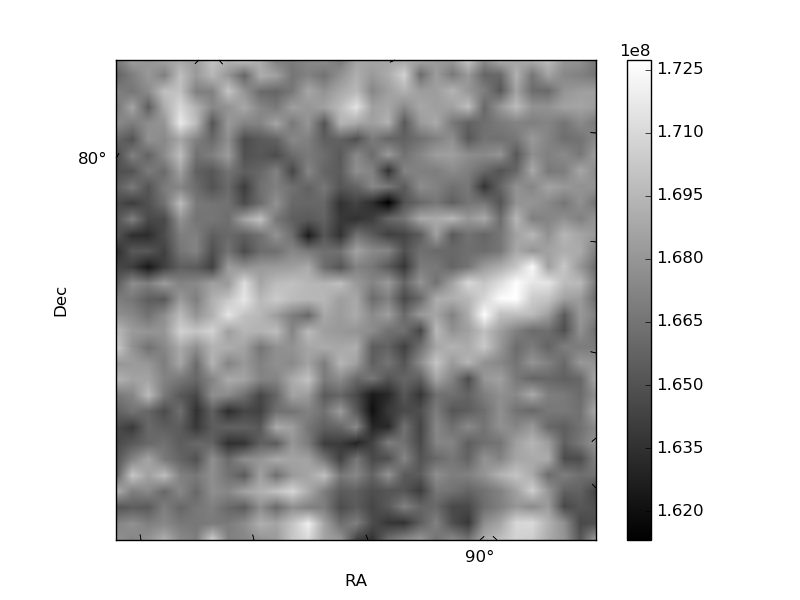
Histogram calculated using DETX and DETY for each event in the final _common_clean file
| Quadrant A | 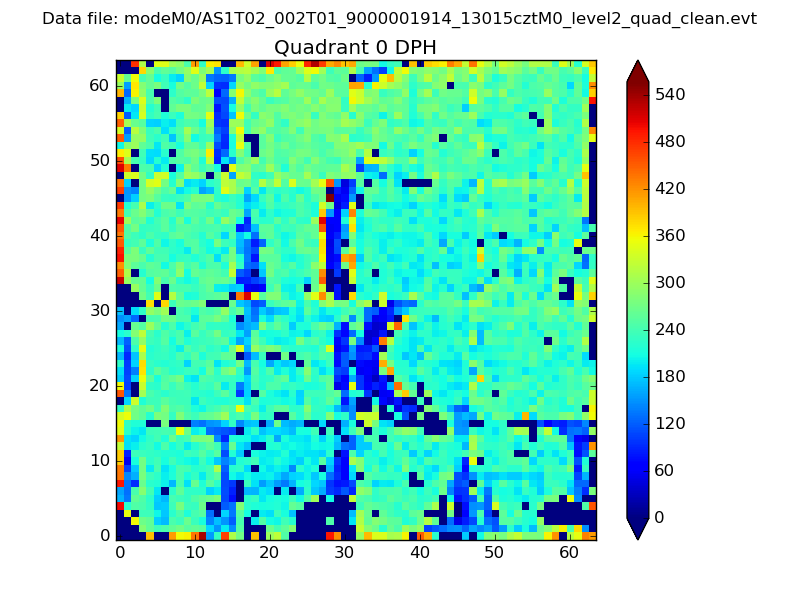 |
 |
Quadrant B |
|---|---|---|---|
| Quadrant D | 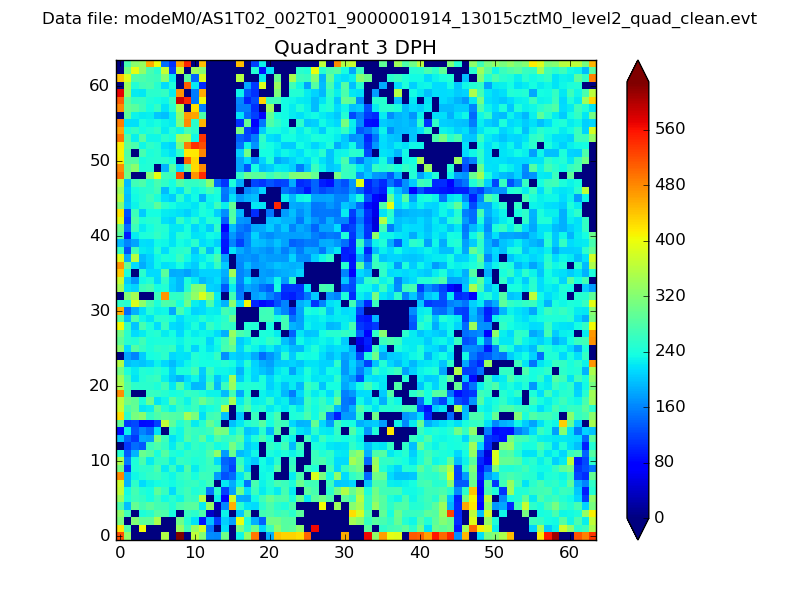 |
 |
Quadrant C |
| Plot type | Count rate plots | Images |
|---|---|---|
| Comparison with Poisson distribution Blue bars denote a histogram of data divided into 1 sec bins. Red curve is a Poisson curve with rate = median count rate of data. |
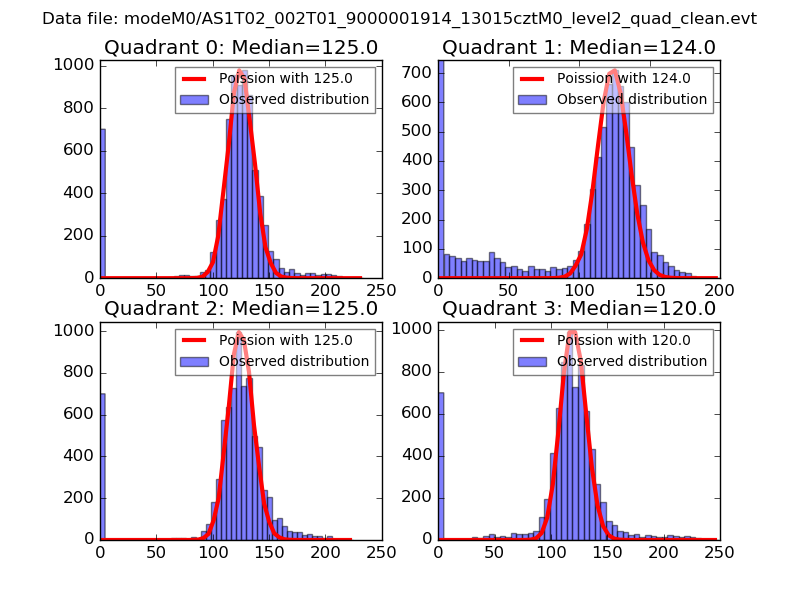 |
 |
| Quadrant-wise count rates Data is divided into 100 sec bins |
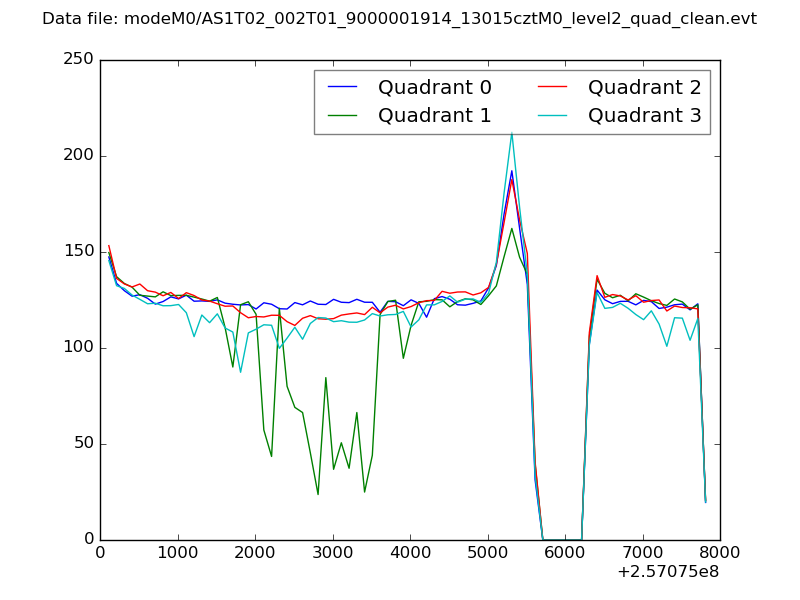 |
|
| Module-wise count rates for Quadrant A Data is divided into 100 sec bins |
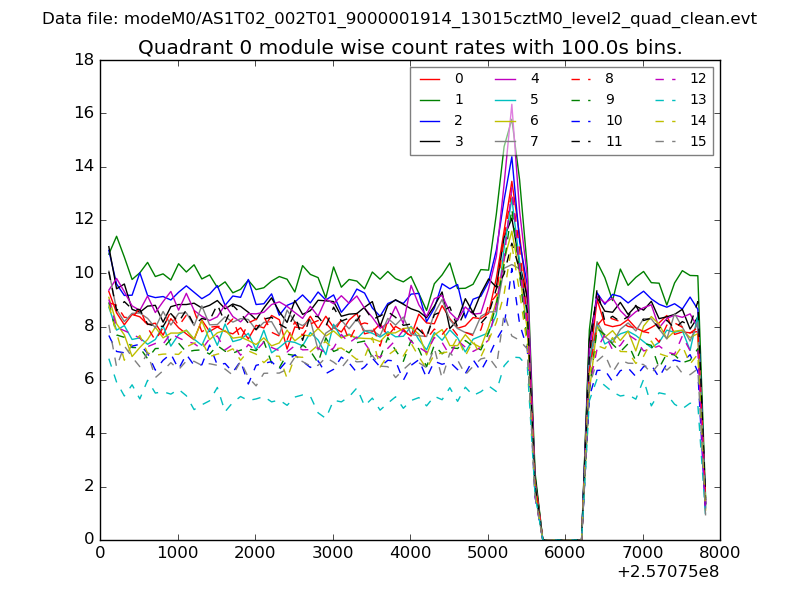 |
 |
| Module-wise count rates for Quadrant B Data is divided into 100 sec bins |
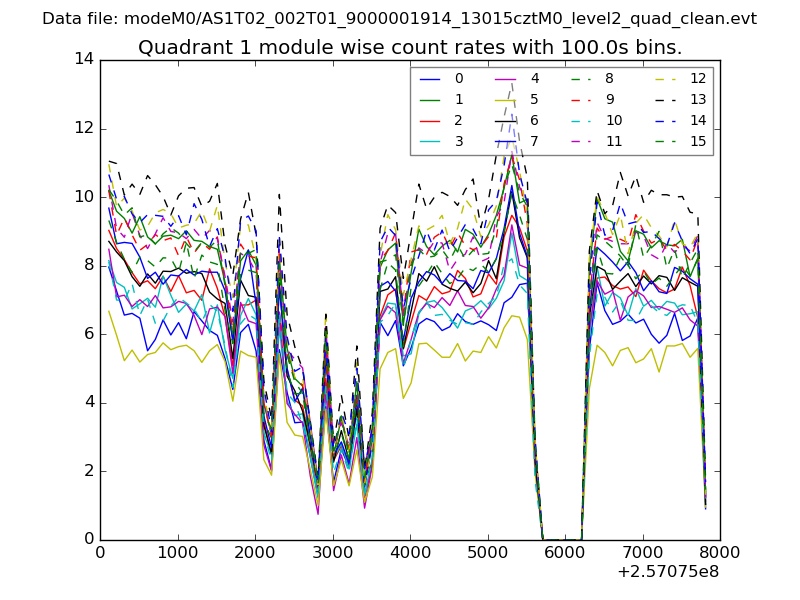 |
 |
| Module-wise count rates for Quadrant C Data is divided into 100 sec bins |
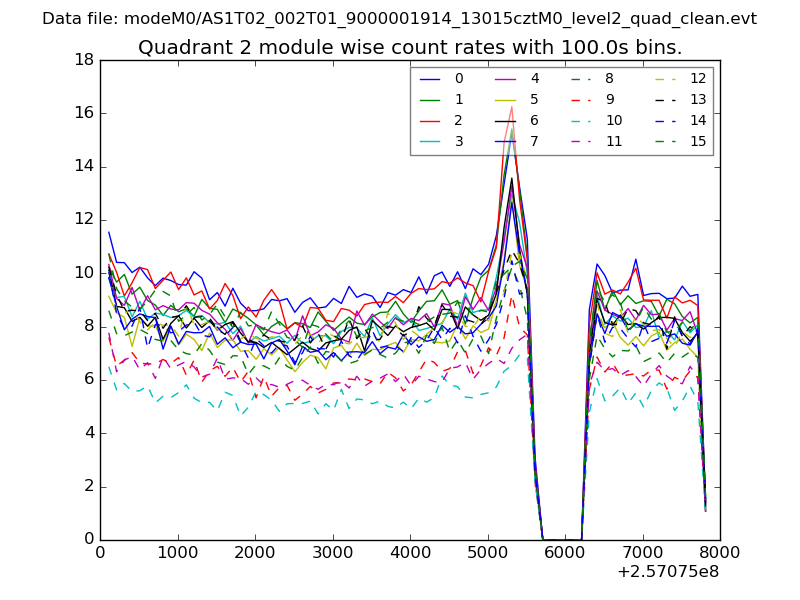 |
 |
| Module-wise count rates for Quadrant D Data is divided into 100 sec bins |
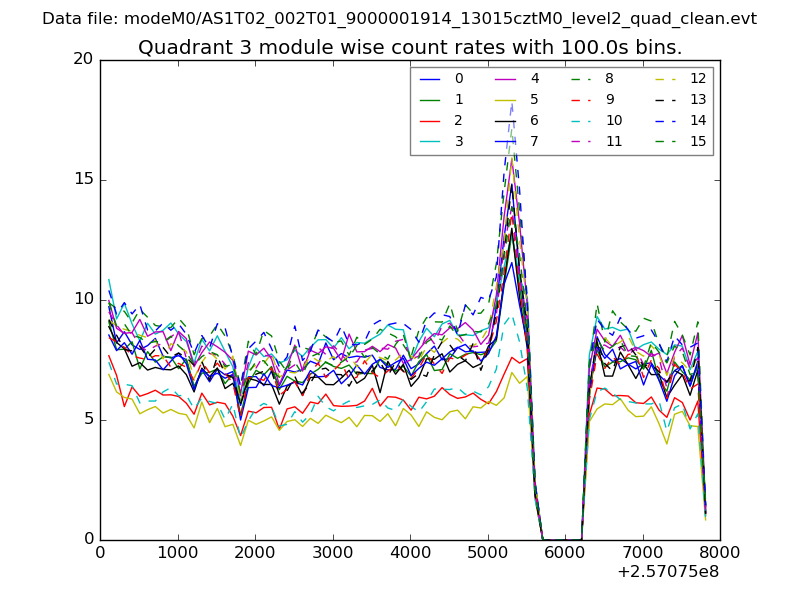 |
 |
| Parameter | Plot |
|---|---|
| CZT HV Monitor | 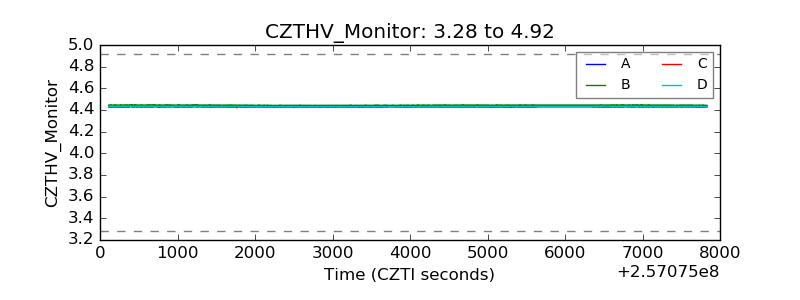 |
| D_VDD | 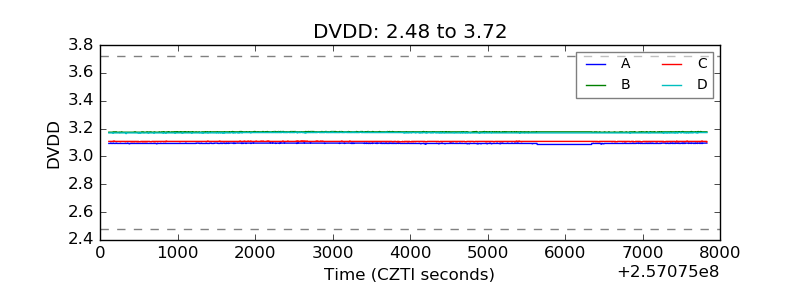 |
| Temperature 1 | 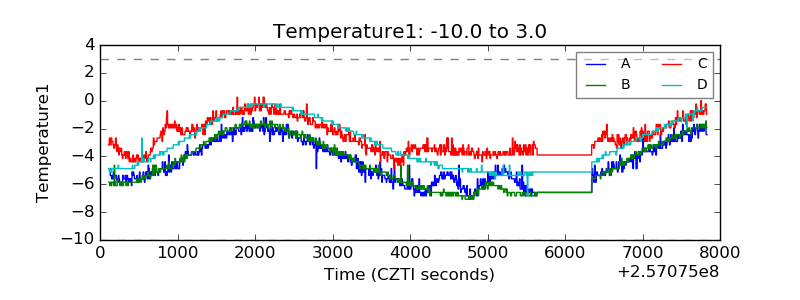 |
| Veto HV Monitor | 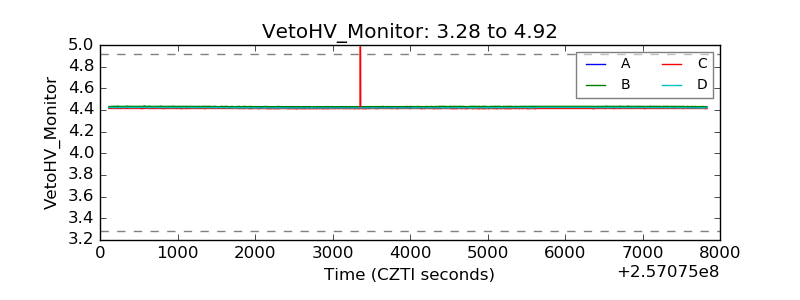 |
| Veto LLD | 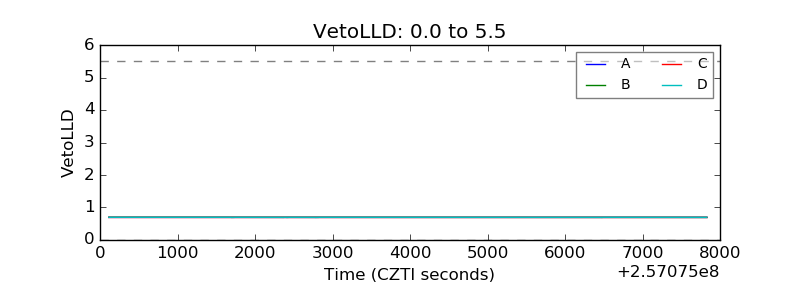 |
| Alpha Counter | 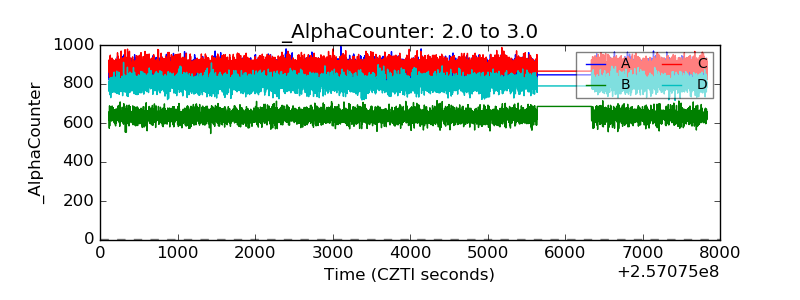 |
| _CPM_Rate | 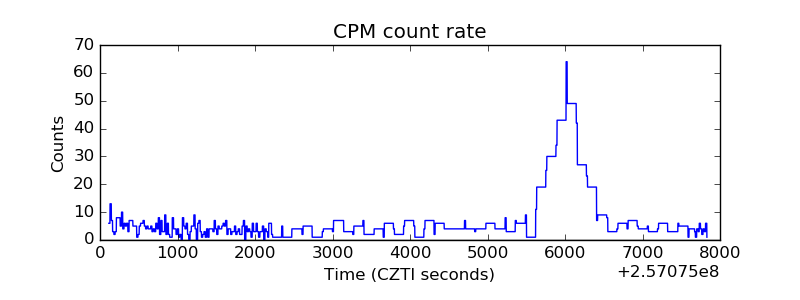 |
| CZT Counter | 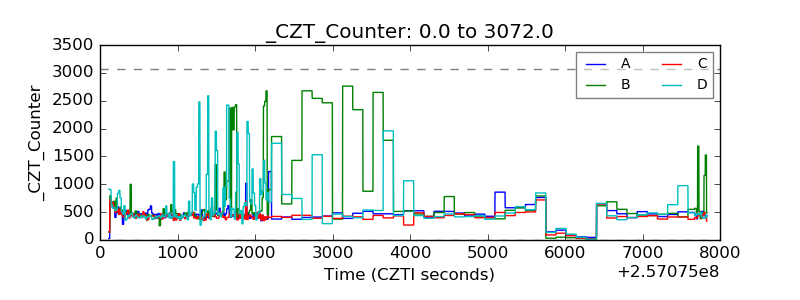 |
| +2.5 Volts monitor |  |
| +5 Volts monitor | 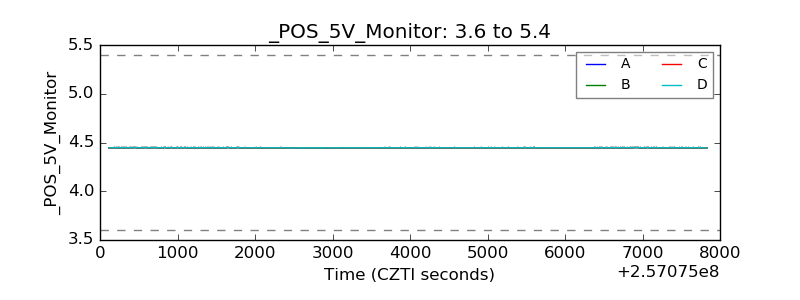 |
| _ROLL_ROT | 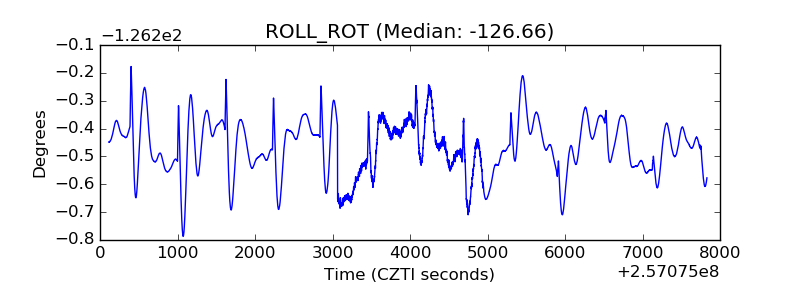 |
| _Roll_DEC | 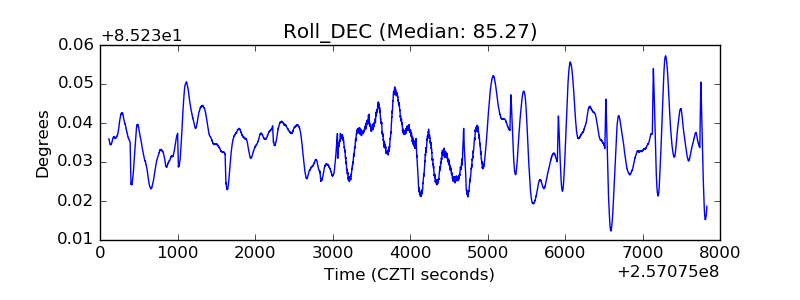 |
| _Roll_RA | 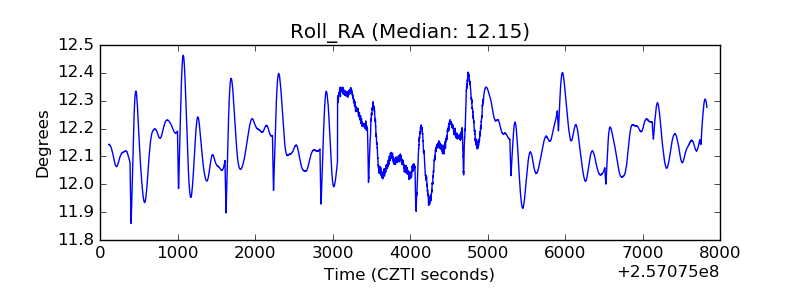 |
| Veto Counter | 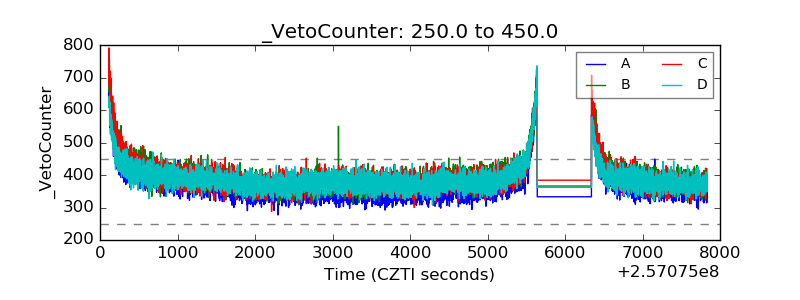 |