| Param | Original file | Final file |
|---|---|---|
| Filename | modeM0/AS1T02_002T01_9000001914_13016cztM0_level2.evt | modeM0/AS1T02_002T01_9000001914_13016cztM0_level2_quad_clean.evt |
| Size (bytes) | 549,567,360 | 123,376,320 |
| Size | 524.1 MB | 117.7 MB |
| Events in quadrant A | 3,603,082 | 837,028 |
| Events in quadrant B | 5,608,566 | 748,981 |
| Events in quadrant C | 3,146,956 | 850,976 |
| Events in quadrant D | 3,810,508 | 812,518 |
| Mode M9 | |||
|---|---|---|---|
| Quadrant | BADHDUFLAG | Total packets | Discarded packets |
| A | 0 | 3 | 0 |
| B | 0 | 3 | 0 |
| C | 0 | 3 | 0 |
| D | 0 | 3 | 0 |
| Mode M0 | |||
|---|---|---|---|
| Quadrant | BADHDUFLAG | Total packets | Discarded packets |
| A | 0 | 15372 | 2 |
| B | 0 | 21265 | 1 |
| C | 0 | 14481 | 1 |
| D | 0 | 16158 | 1 |
| Mode SS | |||
|---|---|---|---|
| Quadrant | BADHDUFLAG | Total packets | Discarded packets |
| A | 0 | 142 | 0 |
| B | 0 | 142 | 0 |
| C | 0 | 142 | 0 |
| D | 0 | 142 | 0 |
| Quadrant | Total seconds | Saturated seconds | Saturation percentage |
|---|---|---|---|
| A | 6984 | 183 | 2.620275% |
| B | 6984 | 1220 | 17.468499% |
| C | 6984 | 41 | 0.587056% |
| D | 6984 | 147 | 2.104811% |
Noise dominated data is calculated using 1-second bins in cleaned event files. If a bin has >2000 counts, and if more than 50% of those come from <1% of pixels, then it is considered to be noise-dominated and hence unusable.
| Quadrant | # 1 sec bins | Bins with >0 counts | Bins with >2000 counts | High rate bins dominated by noise | Noise dominated (total time) | Noise dominated (detector-on time) | Marked lightcurve |
|---|---|---|---|---|---|---|---|
| A | 7290 | 6986 | 107 | 107 | 1.47% | 1.53% | 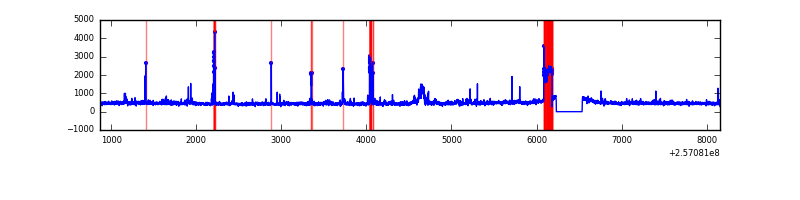 |
| B | 7289 | 6985 | 794 | 794 | 10.89% | 11.37% | 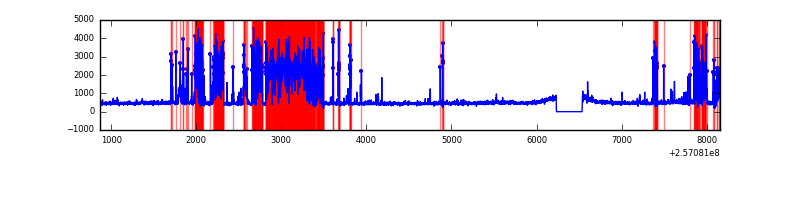 |
| C | 7290 | 6986 | 8 | 8 | 0.11% | 0.11% | 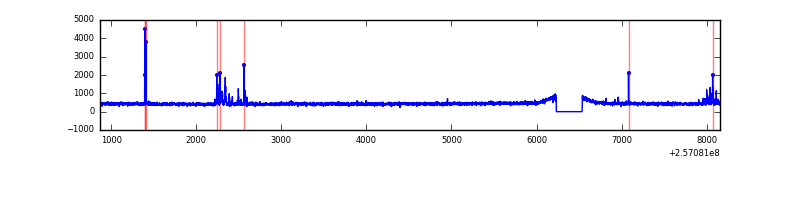 |
| D | 7290 | 6986 | 92 | 92 | 1.26% | 1.32% | 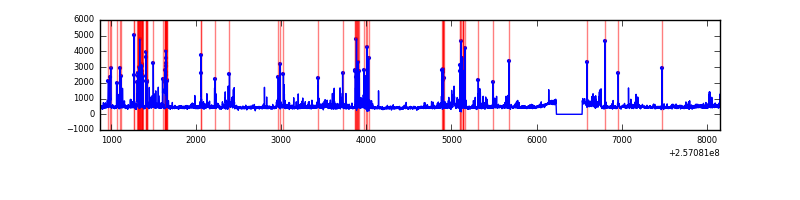 |
Top three noisy pixels from each quadrant. If the there are fewer than three noisy pixels in the level2.evt file, extra rows are filled as -1
| Pixel properties | Quadrant properties | ||||||
|---|---|---|---|---|---|---|---|
| Quadrant | DetID | PixID | Counts | Sigma | Mean | Median | Sigma |
| A | 15 | 223 | 277760 | 1739.93 | 785 | 767 | 159.2 |
| A | 15 | 239 | 108374 | 675.93 | 785 | 767 | 159.2 |
| A | 12 | 189 | 105946 | 660.68 | 785 | 767 | 159.2 |
| B | 4 | 239 | 2431299 | 17936.45 | 709 | 689 | 135.5 |
| B | 3 | 64 | 242086 | 1781.37 | 709 | 689 | 135.5 |
| B | 3 | 209 | 43924 | 319.05 | 709 | 689 | 135.5 |
| C | 0 | 207 | 92166 | 511.83 | 778 | 781 | 178.5 |
| C | 14 | 234 | 20614 | 111.08 | 778 | 781 | 178.5 |
| C | 13 | 61 | 5744 | 27.8 | 778 | 781 | 178.5 |
| D | 1 | 52 | 795541 | 4290.69 | 774 | 752 | 185.2 |
| D | 8 | 195 | 61842 | 329.8 | 774 | 752 | 185.2 |
| D | 2 | 234 | 25335 | 132.71 | 774 | 752 | 185.2 |
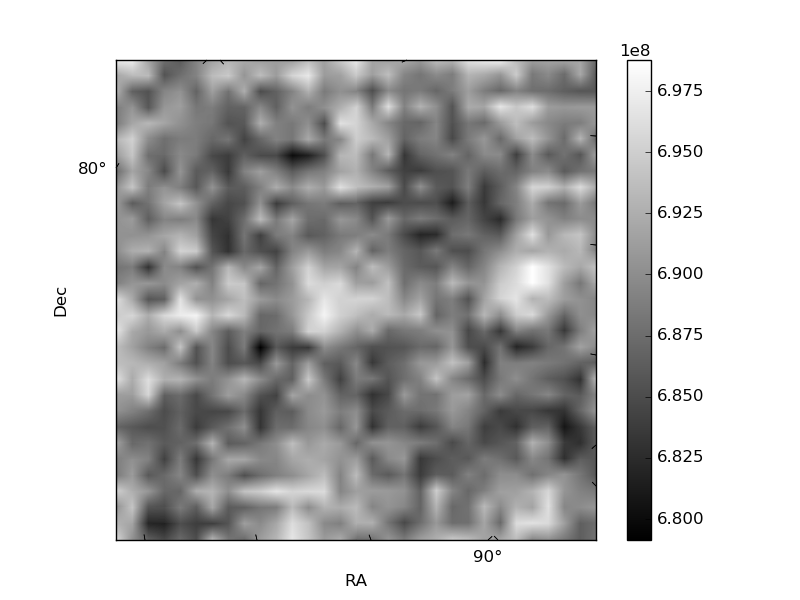
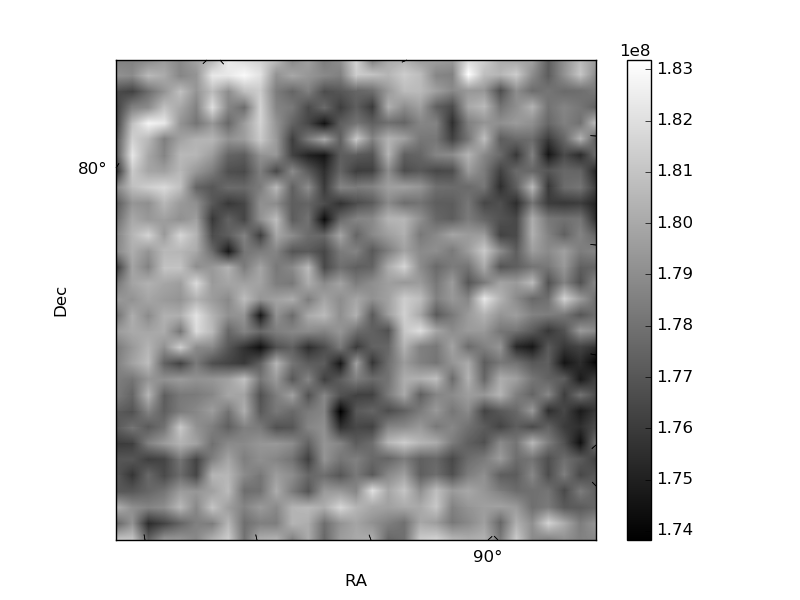
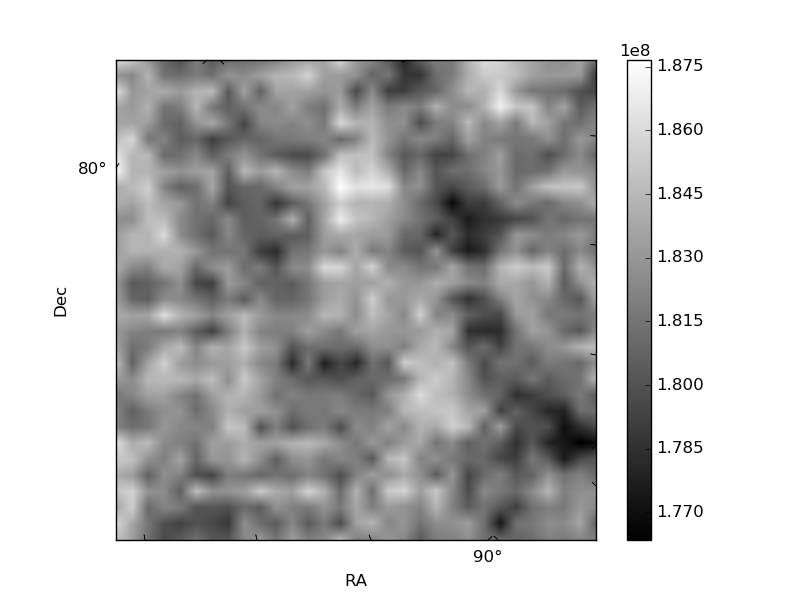
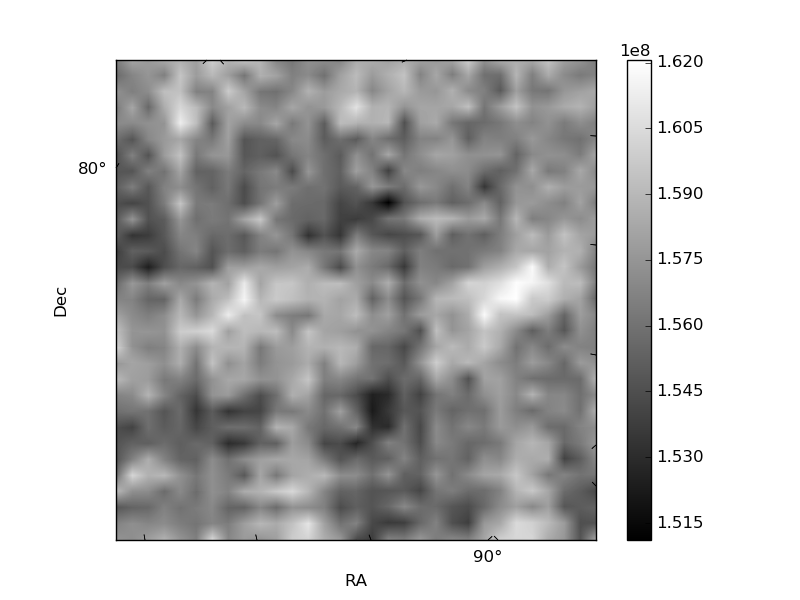
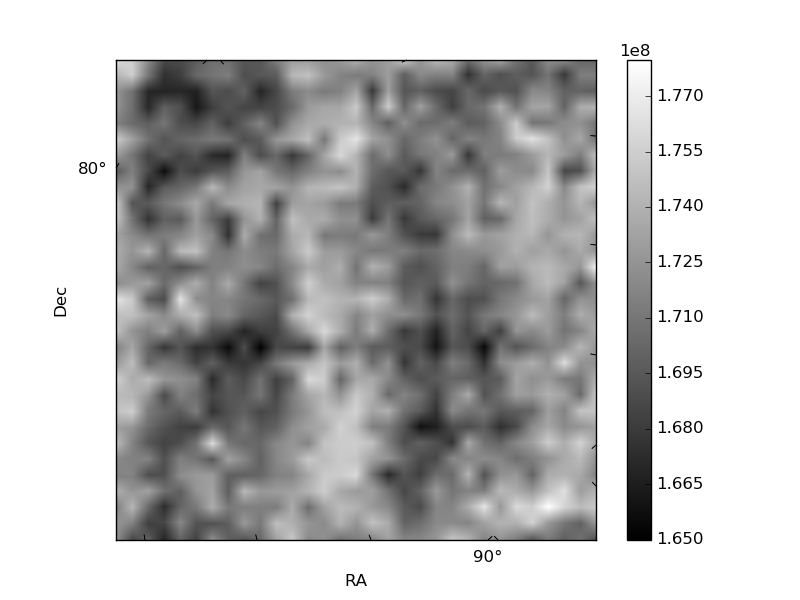
Histogram calculated using DETX and DETY for each event in the final _common_clean file
| Quadrant A | 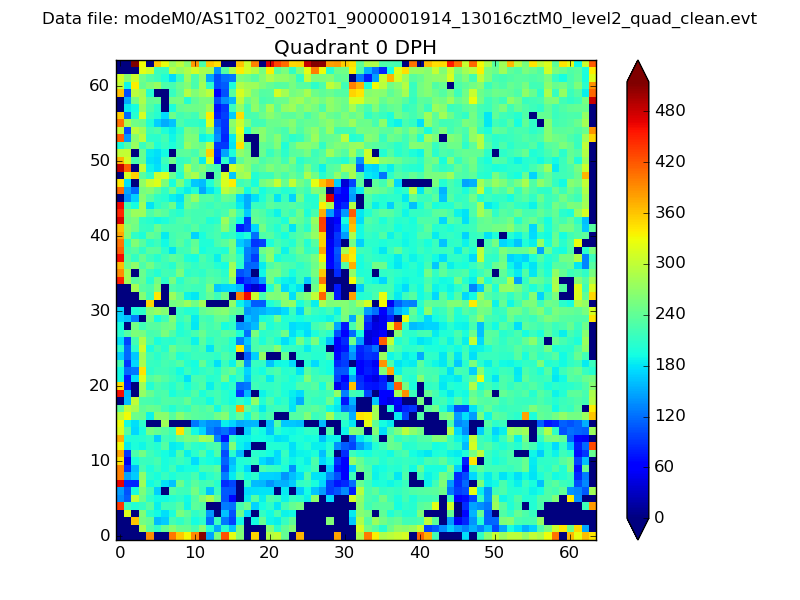 |
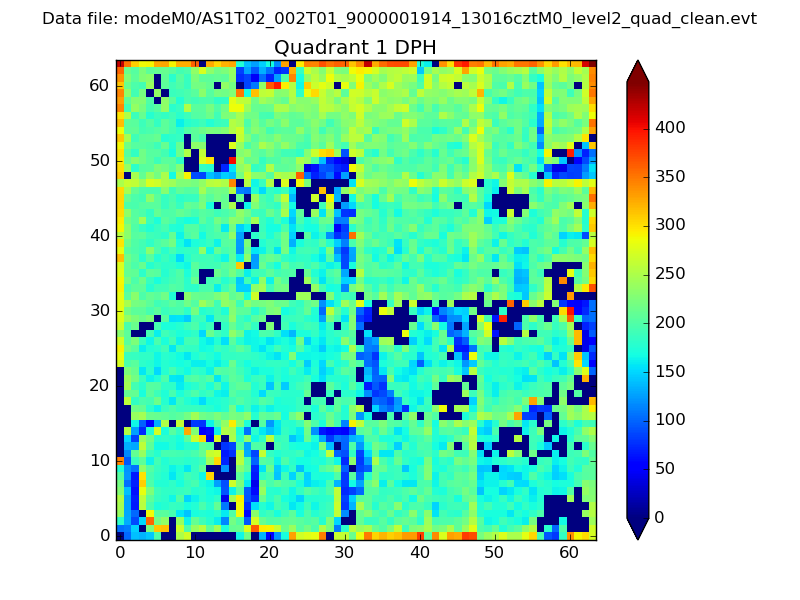 |
Quadrant B |
|---|---|---|---|
| Quadrant D | 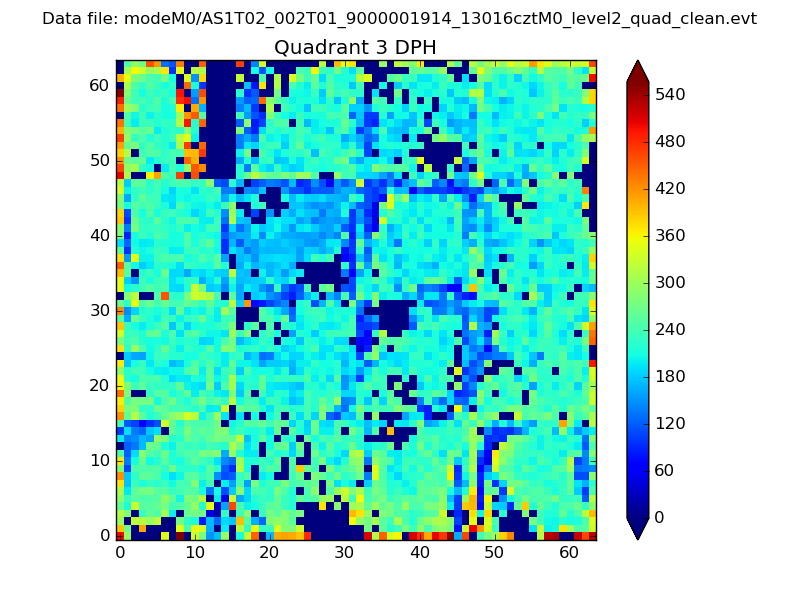 |
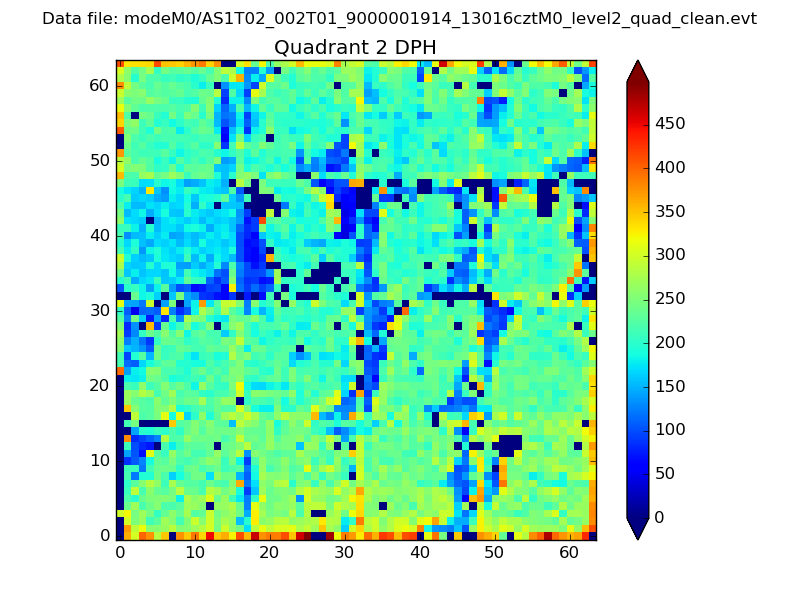 |
Quadrant C |
| Plot type | Count rate plots | Images |
|---|---|---|
| Comparison with Poisson distribution Blue bars denote a histogram of data divided into 1 sec bins. Red curve is a Poisson curve with rate = median count rate of data. |
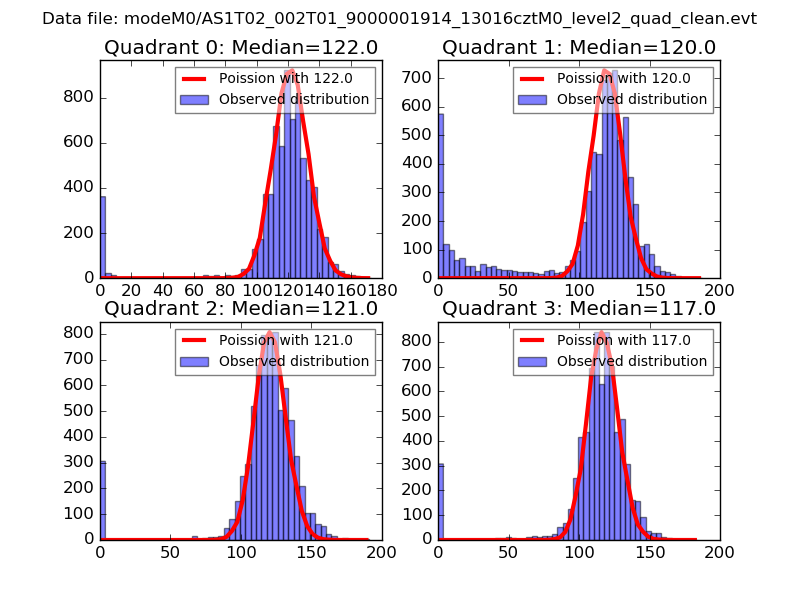 |
 |
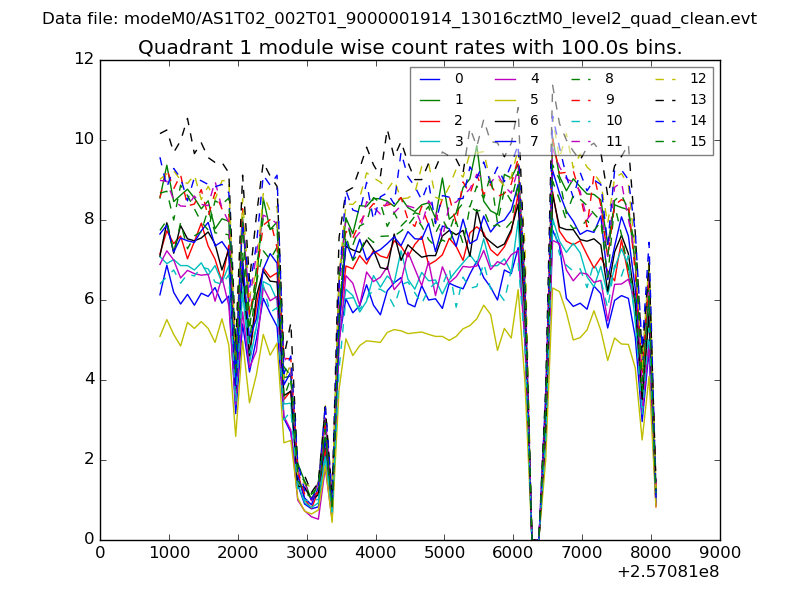
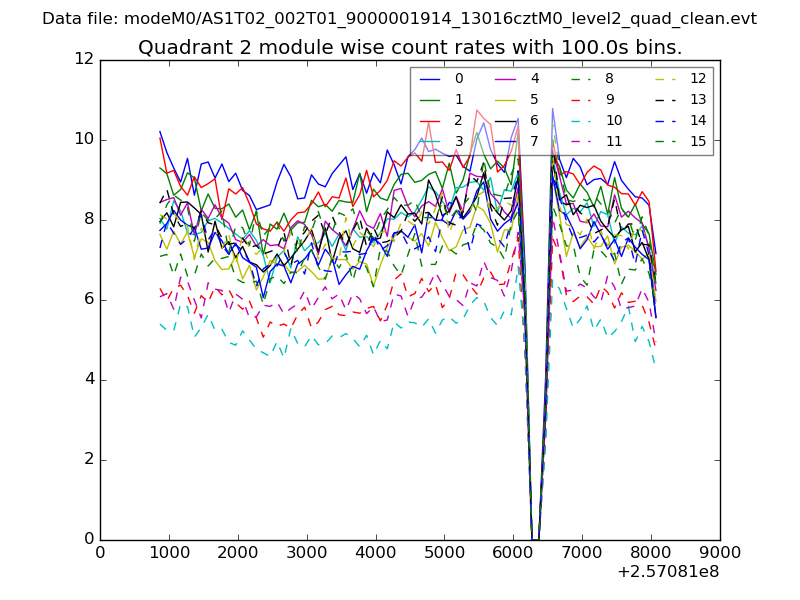
| Quadrant-wise count rates Data is divided into 100 sec bins |
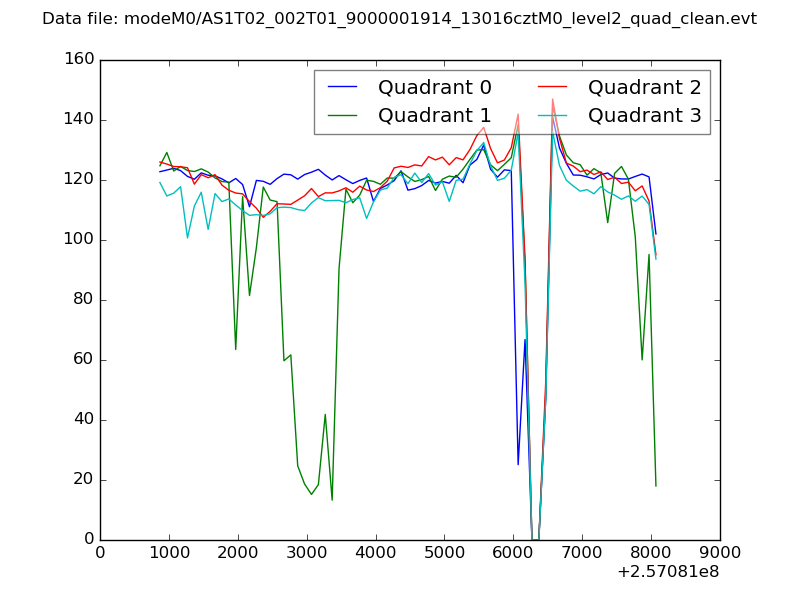 |
|
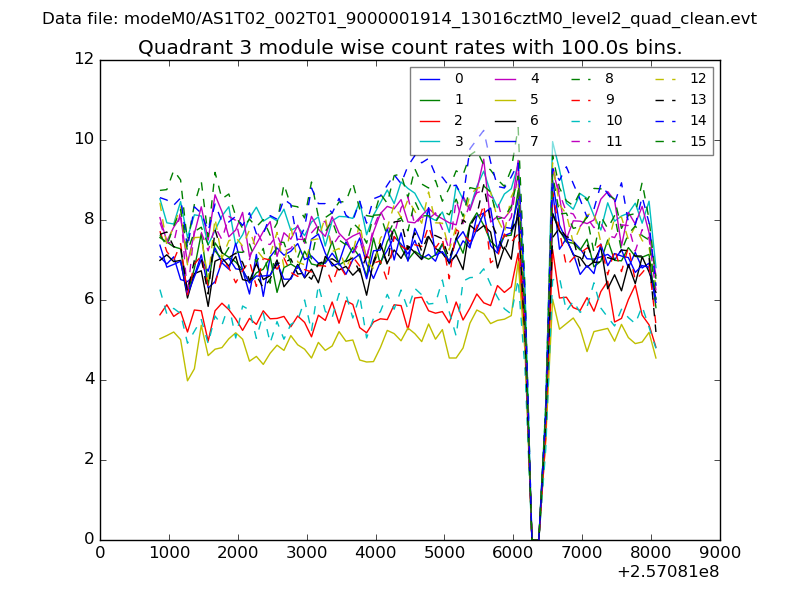
| Module-wise count rates for Quadrant A Data is divided into 100 sec bins |
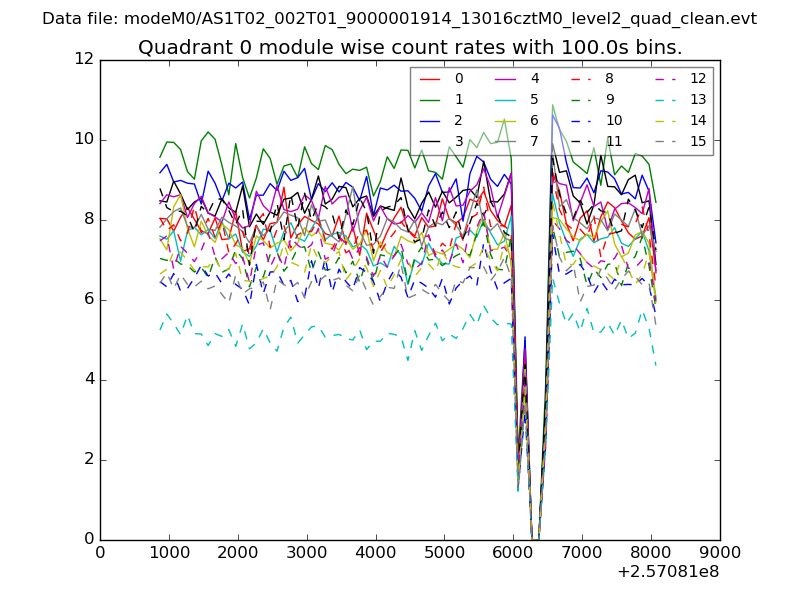 |
 |
| Module-wise count rates for Quadrant B Data is divided into 100 sec bins |
 |
 |
| Module-wise count rates for Quadrant C Data is divided into 100 sec bins |
 |
 |
| Module-wise count rates for Quadrant D Data is divided into 100 sec bins |
 |
 |
| Parameter | Plot |
|---|---|
| CZT HV Monitor | 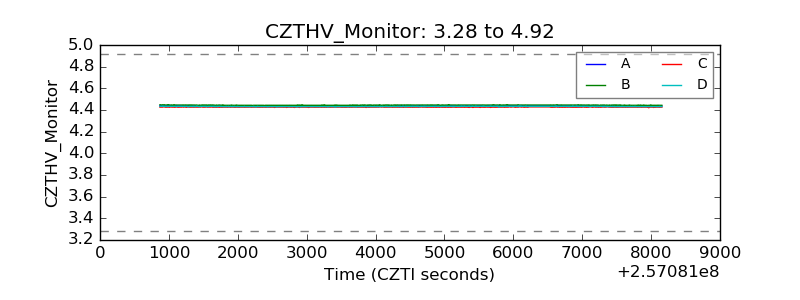 |
| D_VDD | 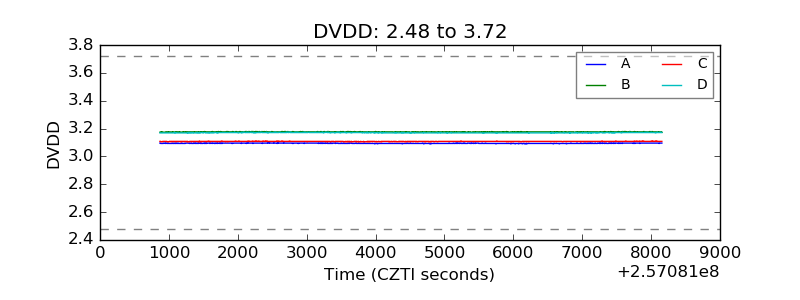 |
| Temperature 1 | 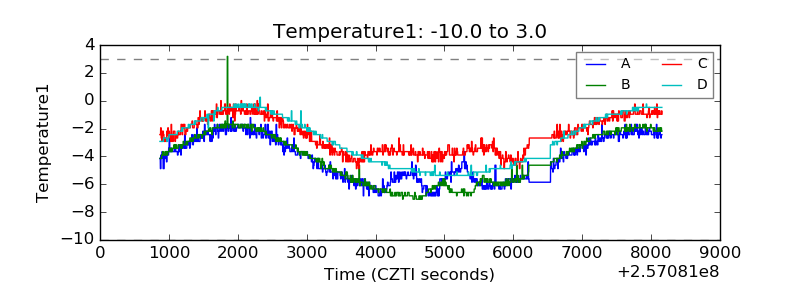 |
| Veto HV Monitor | 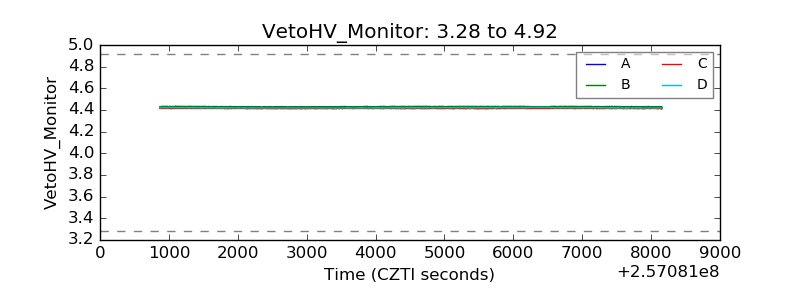 |
| Veto LLD | 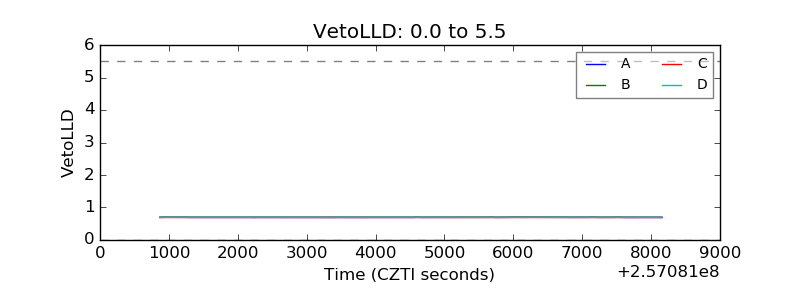 |
| Alpha Counter | 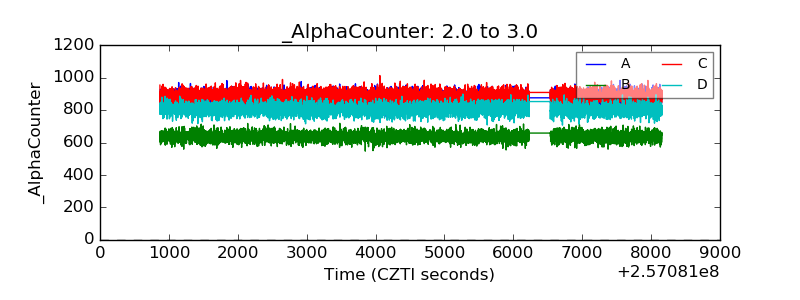 |
| _CPM_Rate | 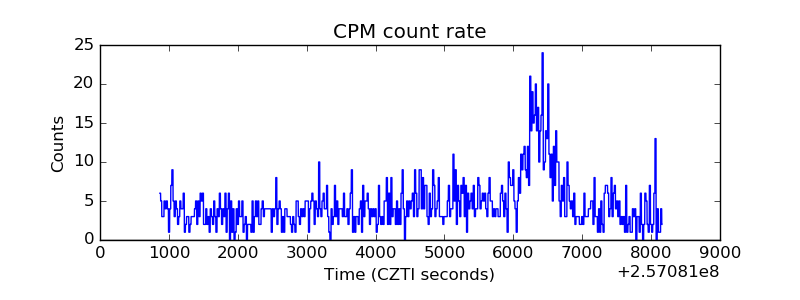 |
| CZT Counter | 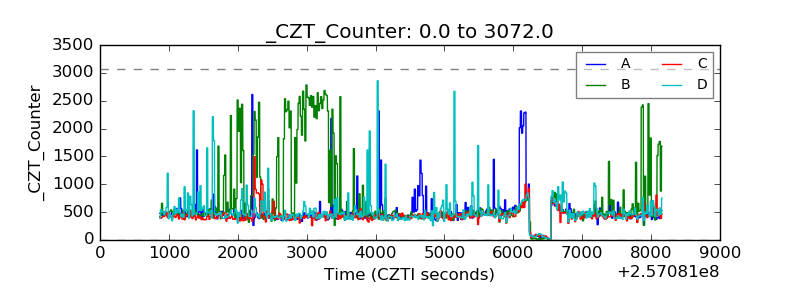 |
| +2.5 Volts monitor |  |
| +5 Volts monitor |  |
| _ROLL_ROT | 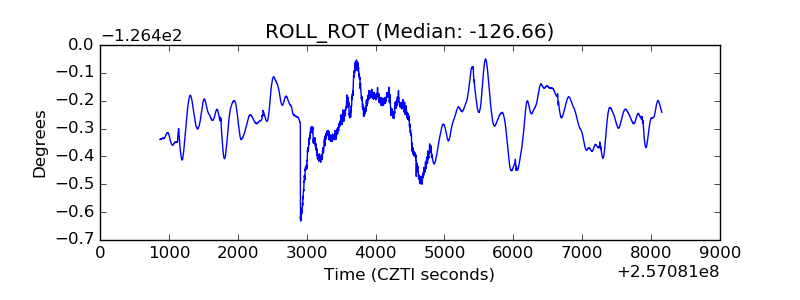 |
| _Roll_DEC | 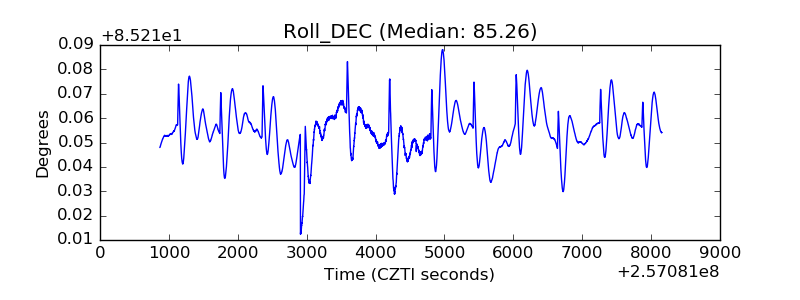 |
| _Roll_RA | 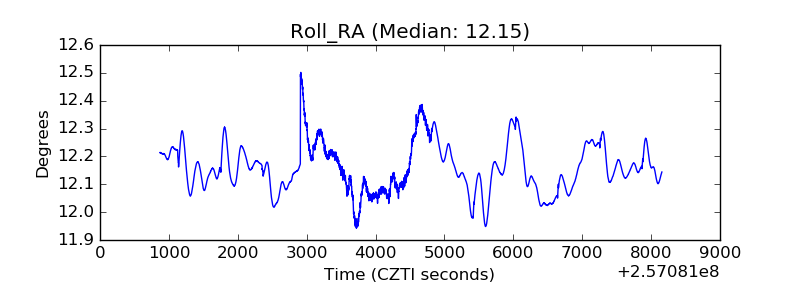 |
| Veto Counter | 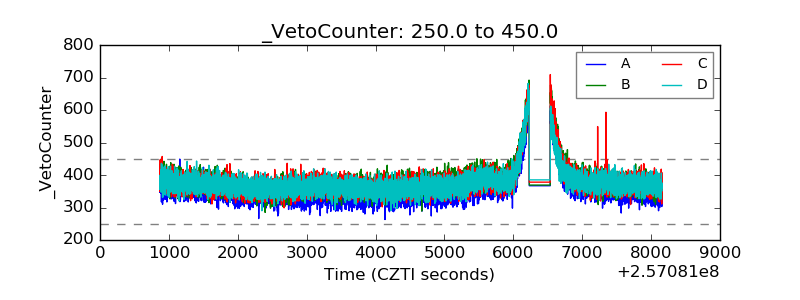 |