| Param | Original file | Final file |
|---|---|---|
| Filename | modeM0/AS1T02_002T01_9000001914_13020cztM0_level2.evt | modeM0/AS1T02_002T01_9000001914_13020cztM0_level2_quad_clean.evt |
| Size (bytes) | 203,307,840 | 37,696,320 |
| Size | 193.9 MB | 36.0 MB |
| Events in quadrant A | 1,025,130 | 275,251 |
| Events in quadrant B | 2,811,554 | 177,977 |
| Events in quadrant C | 1,050,728 | 265,323 |
| Events in quadrant D | 1,112,114 | 257,415 |
| Mode M0 | |||
|---|---|---|---|
| Quadrant | BADHDUFLAG | Total packets | Discarded packets |
| A | 0 | 4616 | 0 |
| B | 0 | 9859 | 0 |
| C | 0 | 4811 | 0 |
| D | 0 | 4863 | 0 |
| Mode SS | |||
|---|---|---|---|
| Quadrant | BADHDUFLAG | Total packets | Discarded packets |
| A | 0 | 44 | 0 |
| B | 0 | 44 | 0 |
| C | 0 | 44 | 0 |
| D | 0 | 44 | 0 |
| Quadrant | Total seconds | Saturated seconds | Saturation percentage |
|---|---|---|---|
| A | 2289 | 2 | 0.087374% |
| B | 2289 | 999 | 43.643512% |
| C | 2289 | 6 | 0.262123% |
| D | 2289 | 8 | 0.349498% |
Noise dominated data is calculated using 1-second bins in cleaned event files. If a bin has >2000 counts, and if more than 50% of those come from <1% of pixels, then it is considered to be noise-dominated and hence unusable.
| Quadrant | # 1 sec bins | Bins with >0 counts | Bins with >2000 counts | High rate bins dominated by noise | Noise dominated (total time) | Noise dominated (detector-on time) | Marked lightcurve |
|---|---|---|---|---|---|---|---|
| A | 2290 | 2290 | 0 | 0 | 0.00% | 0.00% | 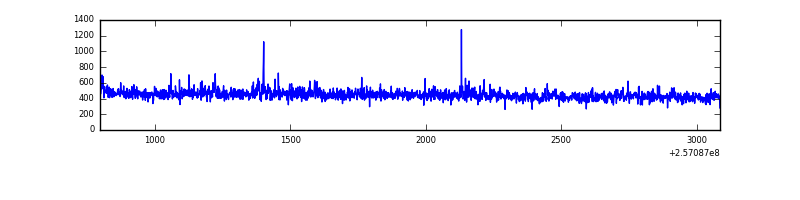 |
| B | 2289 | 2289 | 593 | 593 | 25.91% | 25.91% | 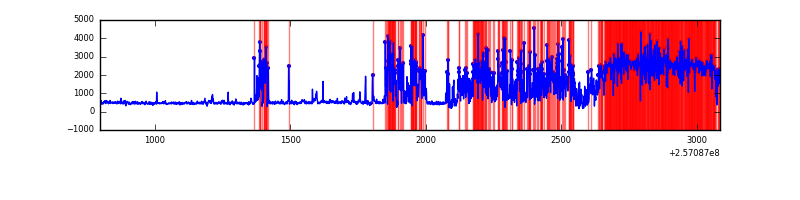 |
| C | 2290 | 2290 | 5 | 5 | 0.22% | 0.22% | 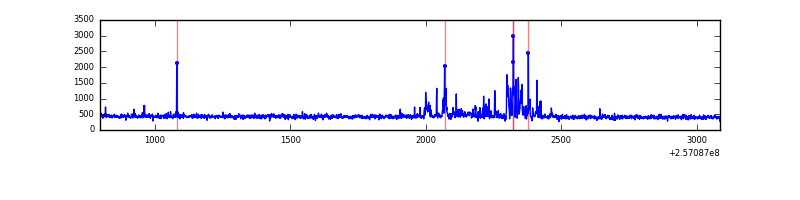 |
| D | 2290 | 2290 | 4 | 4 | 0.17% | 0.17% | 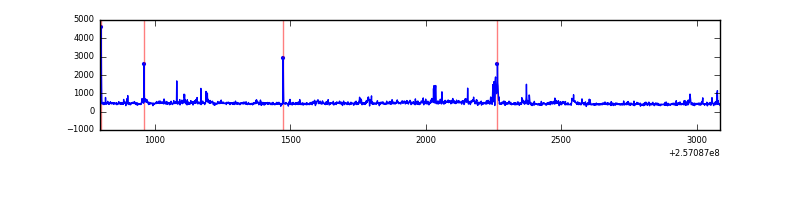 |
Top three noisy pixels from each quadrant. If the there are fewer than three noisy pixels in the level2.evt file, extra rows are filled as -1
| Pixel properties | Quadrant properties | ||||||
|---|---|---|---|---|---|---|---|
| Quadrant | DetID | PixID | Counts | Sigma | Mean | Median | Sigma |
| A | 12 | 189 | 19208 | 355.27 | 256 | 250 | 53.4 |
| A | 1 | 162 | 6612 | 119.22 | 256 | 250 | 53.4 |
| A | 15 | 223 | 3815 | 66.81 | 256 | 250 | 53.4 |
| B | 4 | 239 | 2044544 | 59539.97 | 171 | 167 | 34.3 |
| B | 3 | 64 | 35843 | 1039.02 | 171 | 167 | 34.3 |
| B | 3 | 209 | 24046 | 695.45 | 171 | 167 | 34.3 |
| C | 0 | 207 | 90666 | 1562.89 | 245 | 246 | 57.9 |
| C | 14 | 234 | 3931 | 63.69 | 245 | 246 | 57.9 |
| C | 13 | 61 | 1743 | 25.88 | 245 | 246 | 57.9 |
| D | 1 | 52 | 133108 | 2219.92 | 248 | 241 | 59.9 |
| D | 8 | 195 | 20829 | 343.98 | 248 | 241 | 59.9 |
| D | 2 | 234 | 9124 | 148.42 | 248 | 241 | 59.9 |
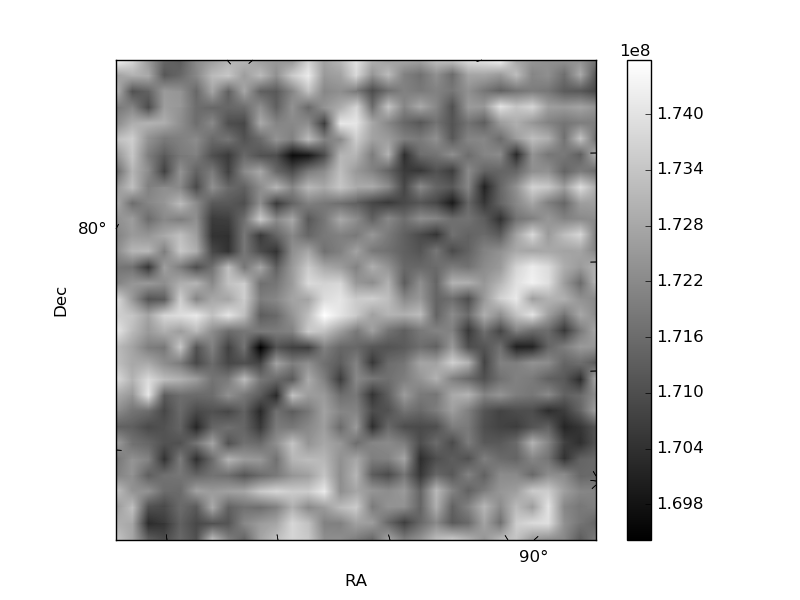
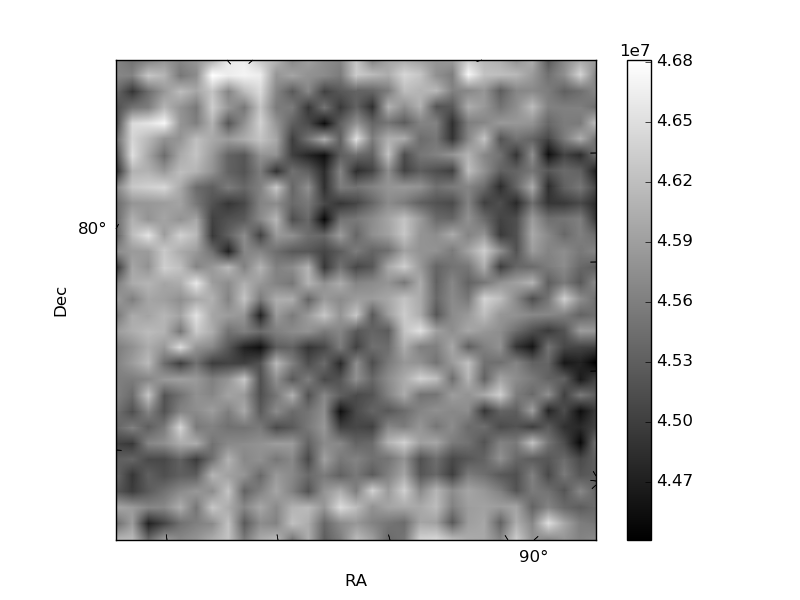
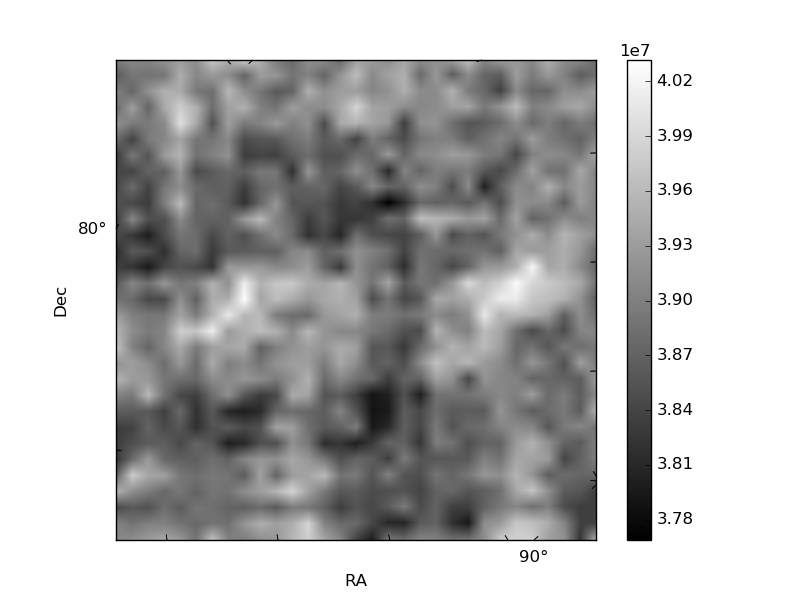
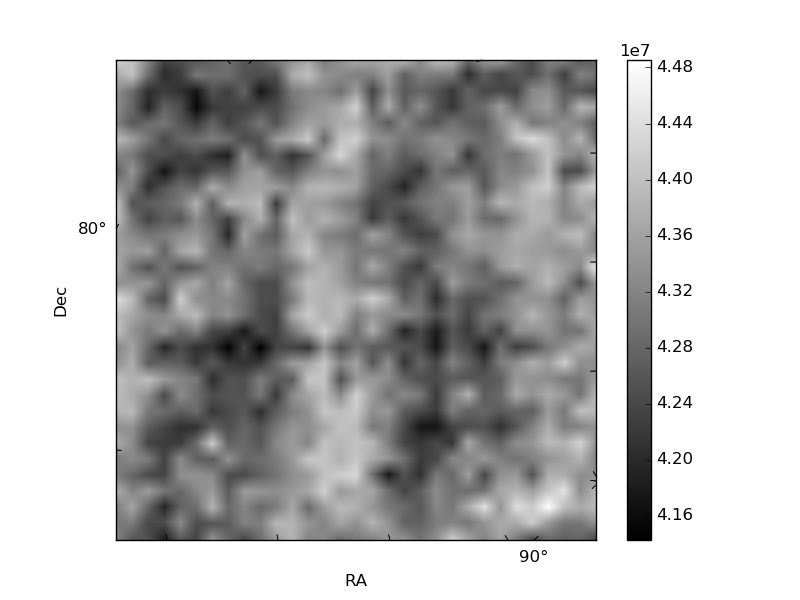
Histogram calculated using DETX and DETY for each event in the final _common_clean file
| Quadrant A | 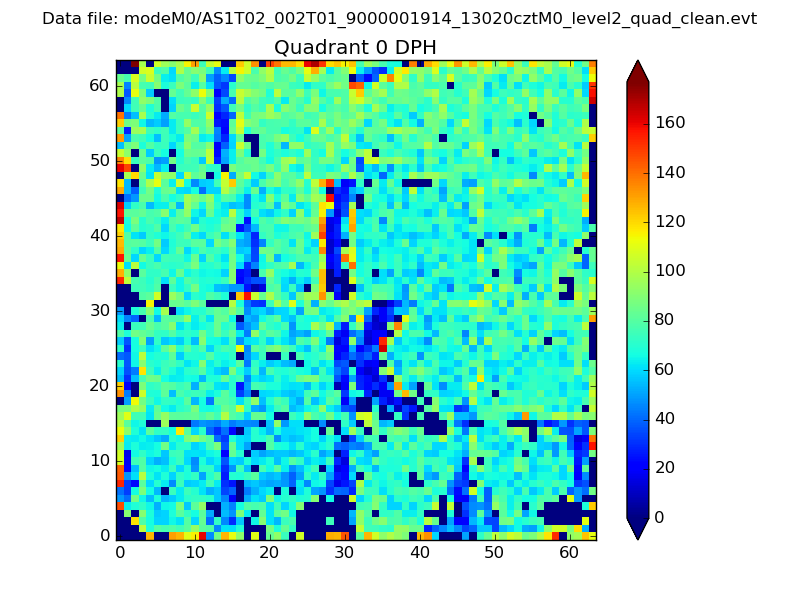 |
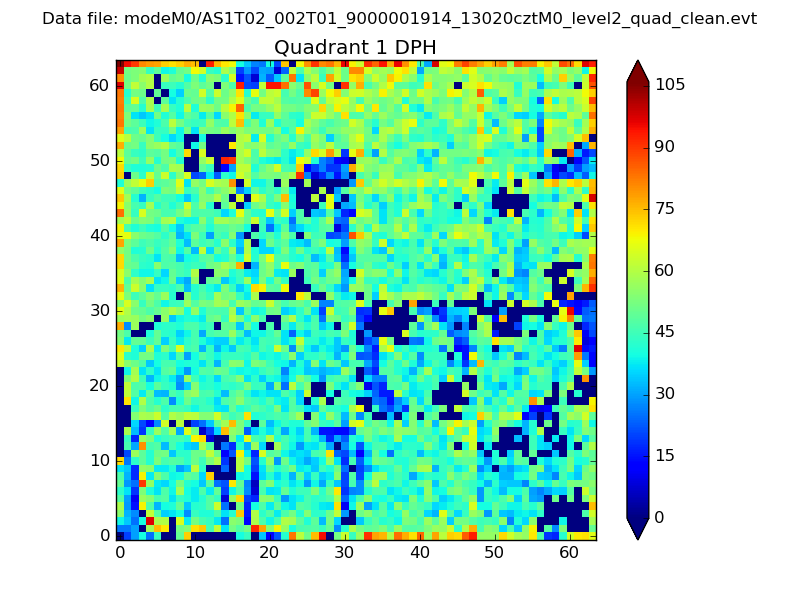 |
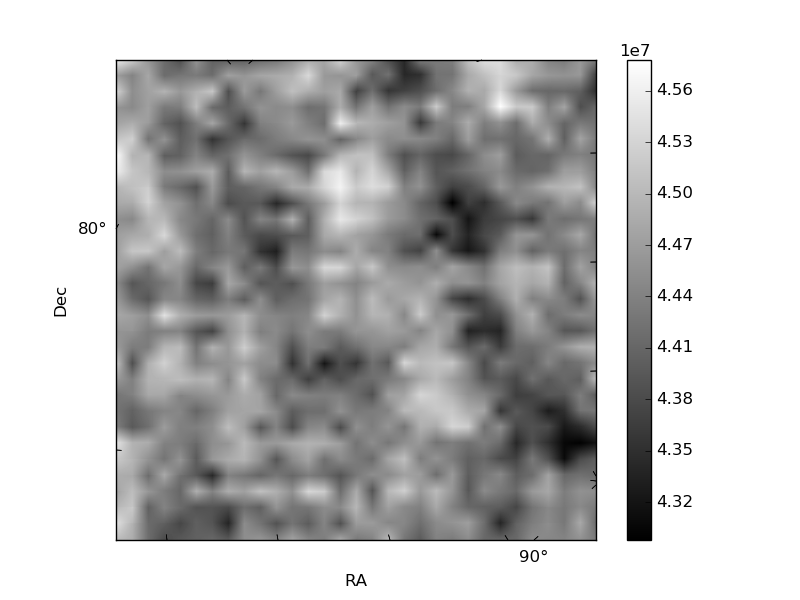
Quadrant B |
|---|---|---|---|
| Quadrant D | 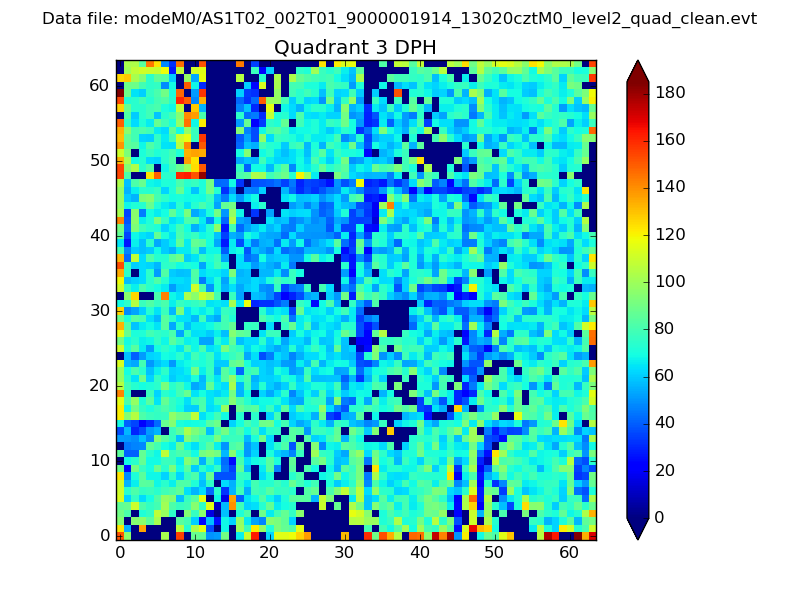 |
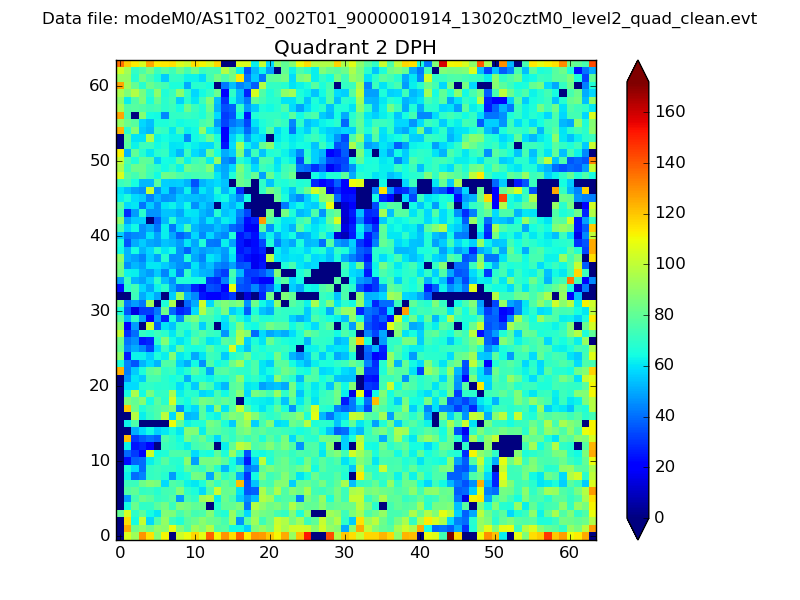 |
Quadrant C |
| Plot type | Count rate plots | Images |
|---|---|---|
| Comparison with Poisson distribution Blue bars denote a histogram of data divided into 1 sec bins. Red curve is a Poisson curve with rate = median count rate of data. |
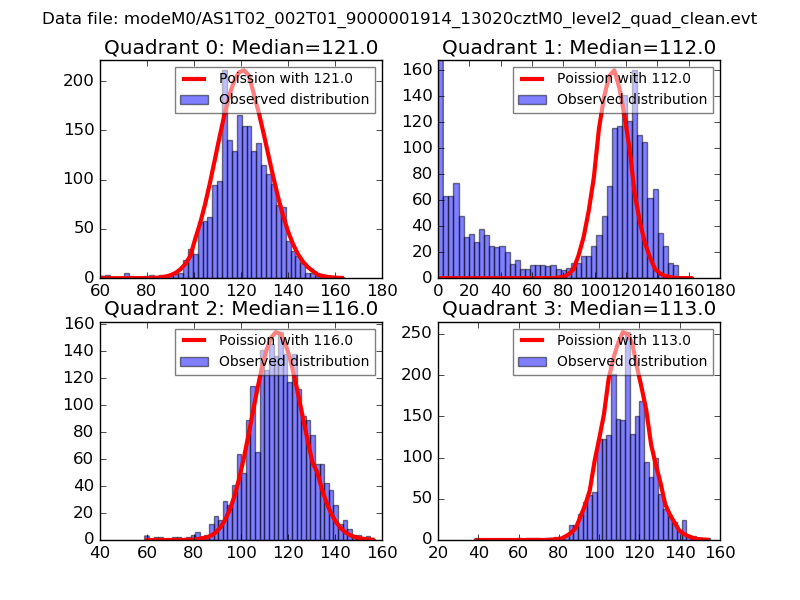 |
 |
| Quadrant-wise count rates Data is divided into 100 sec bins |
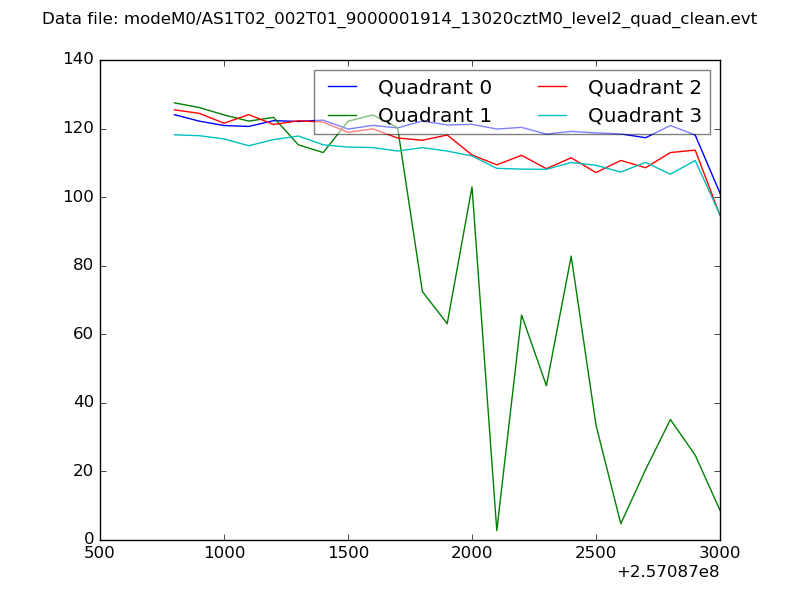 |
|
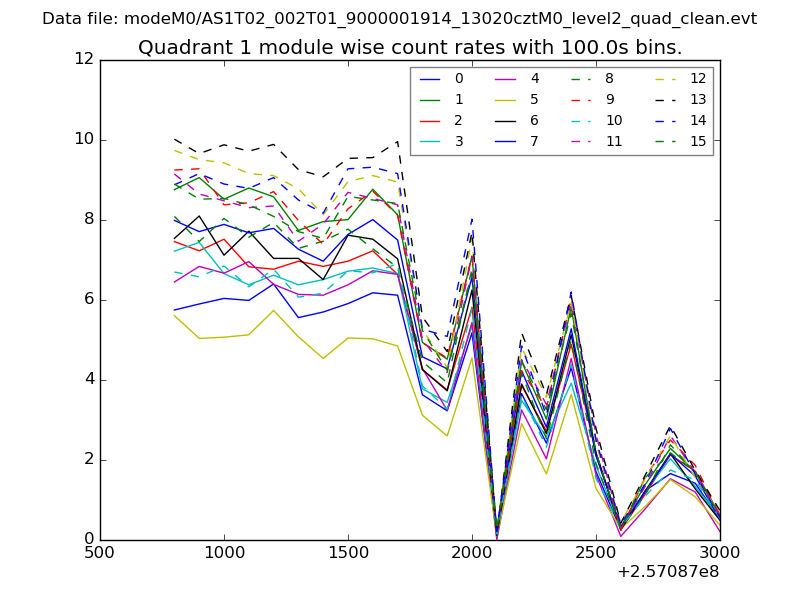
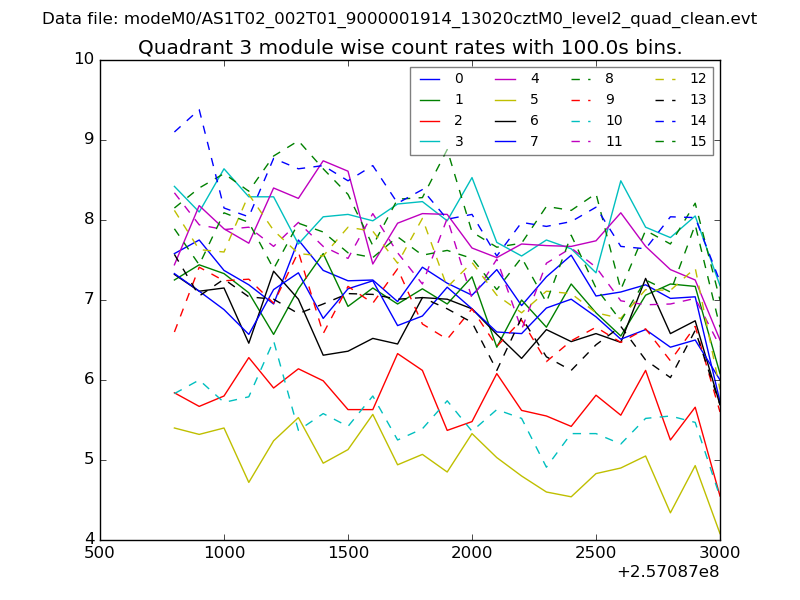
| Module-wise count rates for Quadrant A Data is divided into 100 sec bins |
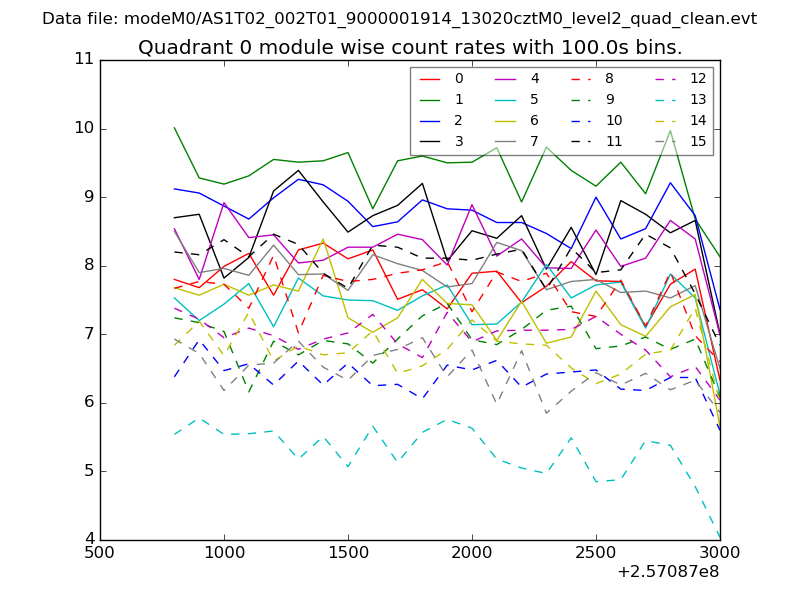 |
 |
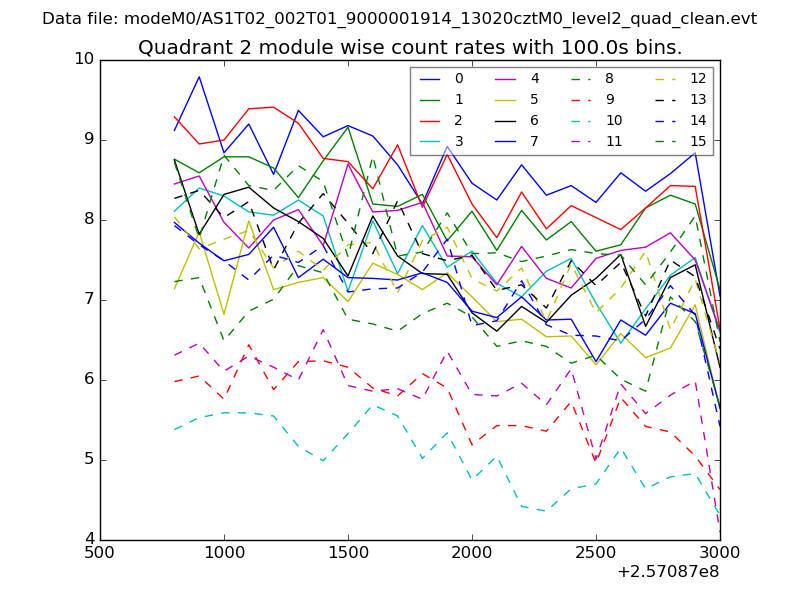
| Module-wise count rates for Quadrant B Data is divided into 100 sec bins |
 |
 |
| Module-wise count rates for Quadrant C Data is divided into 100 sec bins |
 |
 |
| Module-wise count rates for Quadrant D Data is divided into 100 sec bins |
 |
 |
| Parameter | Plot |
|---|---|
| CZT HV Monitor | 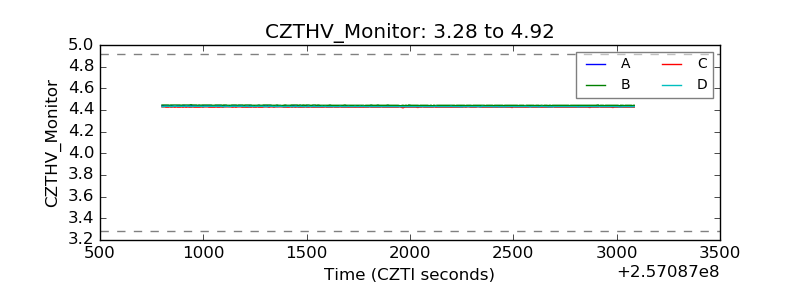 |
| D_VDD | 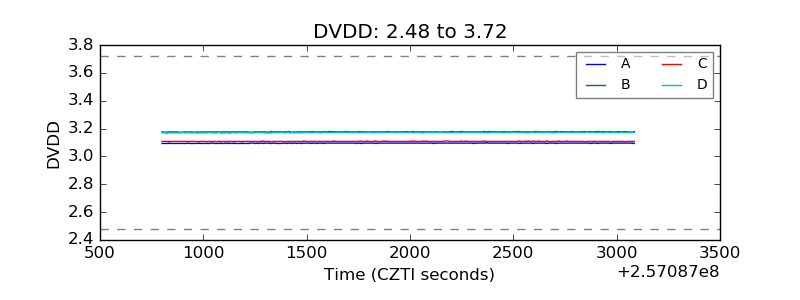 |
| Temperature 1 | 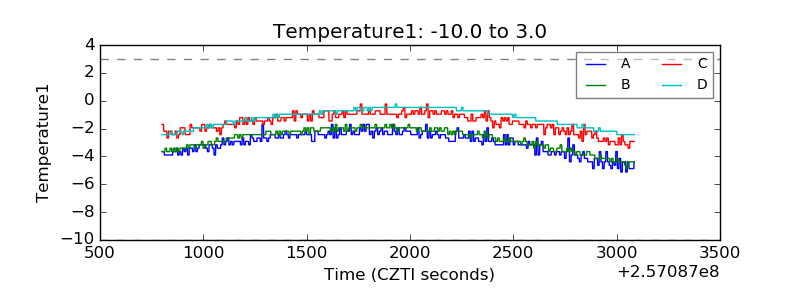 |
| Veto HV Monitor | 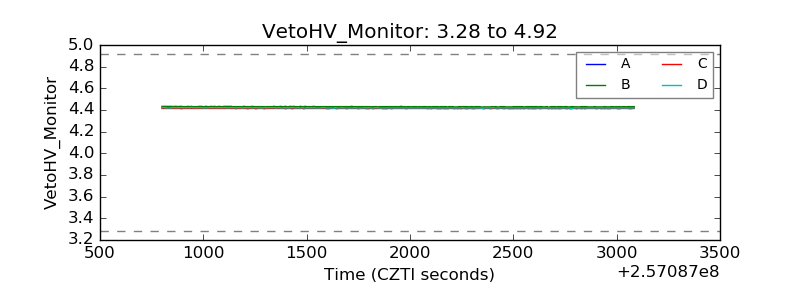 |
| Veto LLD | 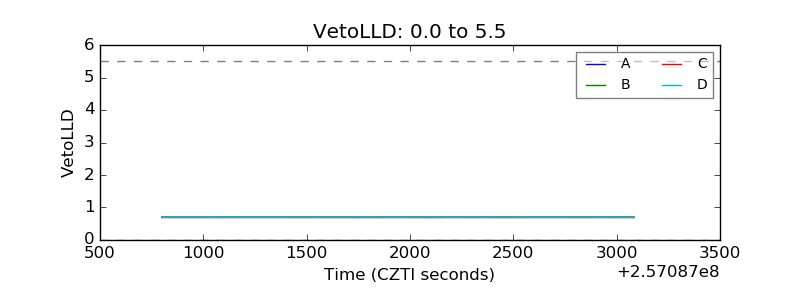 |
| Alpha Counter | 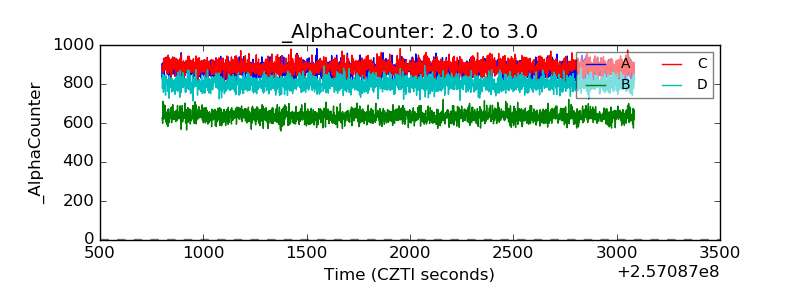 |
| _CPM_Rate | 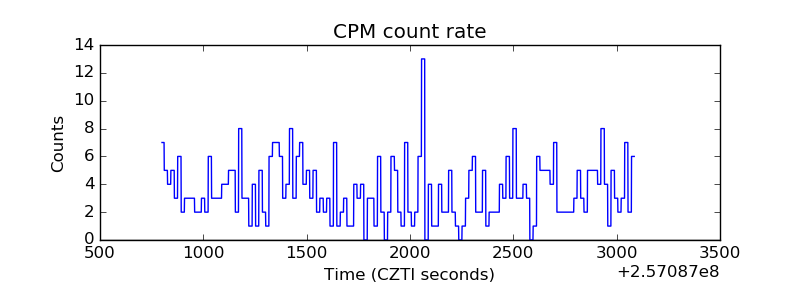 |
| CZT Counter | 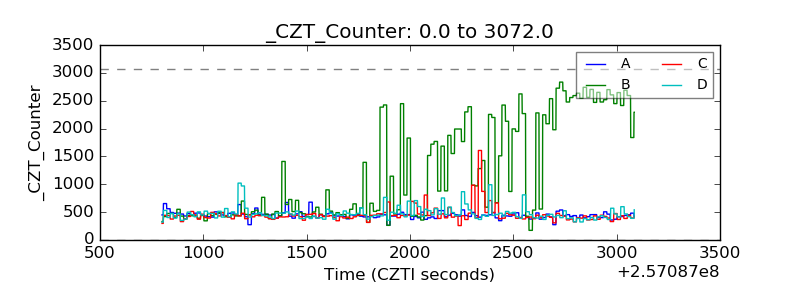 |
| +2.5 Volts monitor |  |
| +5 Volts monitor |  |
| _ROLL_ROT | 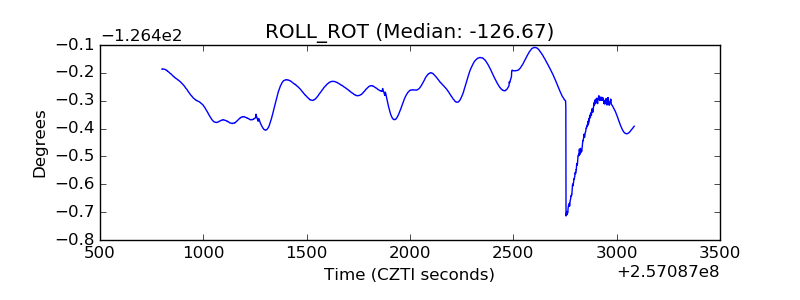 |
| _Roll_DEC | 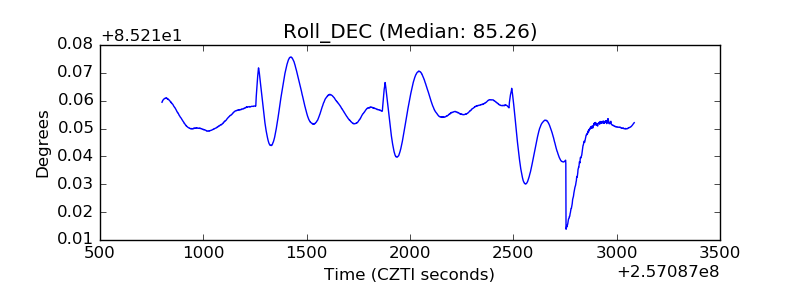 |
| _Roll_RA | 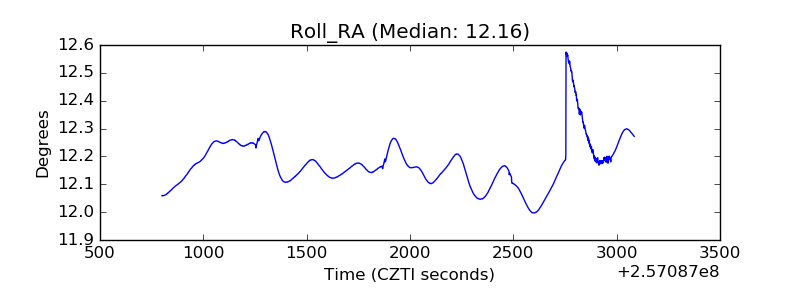 |
| Veto Counter | 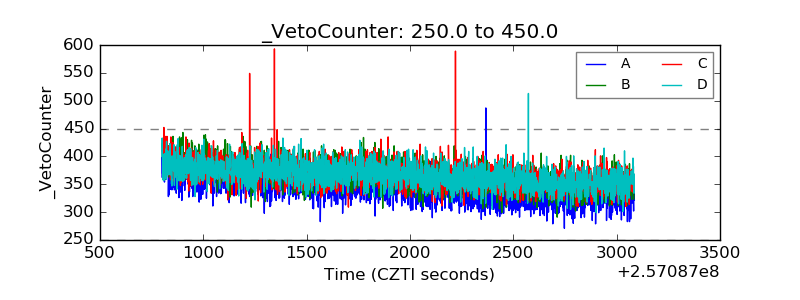 |