| Param | Original file | Final file |
|---|---|---|
| Filename | modeM0/AS1A04_216T01_9000001916_13020cztM0_level2.evt | modeM0/AS1A04_216T01_9000001916_13020cztM0_level2_quad_clean.evt |
| Size (bytes) | 964,284,480 | 164,721,600 |
| Size | 919.6 MB | 157.1 MB |
| Events in quadrant A | 6,040,215 | 1,096,938 |
| Events in quadrant B | 9,717,676 | 936,212 |
| Events in quadrant C | 5,420,886 | 1,086,144 |
| Events in quadrant D | 7,199,494 | 1,026,147 |
| Mode M9 | |||
|---|---|---|---|
| Quadrant | BADHDUFLAG | Total packets | Discarded packets |
| A | 0 | 6 | 0 |
| B | 0 | 6 | 0 |
| C | 0 | 6 | 0 |
| D | 0 | 6 | 0 |
| Mode SS | |||
|---|---|---|---|
| Quadrant | BADHDUFLAG | Total packets | Discarded packets |
| A | 0 | 248 | 0 |
| B | 0 | 248 | 0 |
| C | 0 | 248 | 0 |
| D | 0 | 248 | 0 |
| Mode M0 | |||
|---|---|---|---|
| Quadrant | BADHDUFLAG | Total packets | Discarded packets |
| A | 0 | 25991 | 3 |
| B | 0 | 36906 | 2 |
| C | 0 | 24986 | 2 |
| D | 0 | 30303 | 2 |
| Quadrant | Total seconds | Saturated seconds | Saturation percentage |
|---|---|---|---|
| A | 12186 | 196 | 1.608403% |
| B | 12186 | 2130 | 17.479074% |
| C | 12186 | 84 | 0.689316% |
| D | 12186 | 467 | 3.832267% |
Noise dominated data is calculated using 1-second bins in cleaned event files. If a bin has >2000 counts, and if more than 50% of those come from <1% of pixels, then it is considered to be noise-dominated and hence unusable.
| Quadrant | # 1 sec bins | Bins with >0 counts | Bins with >2000 counts | High rate bins dominated by noise | Noise dominated (total time) | Noise dominated (detector-on time) | Marked lightcurve |
|---|---|---|---|---|---|---|---|
| A | 12762 | 12189 | 12 | 12 | 0.09% | 0.10% | 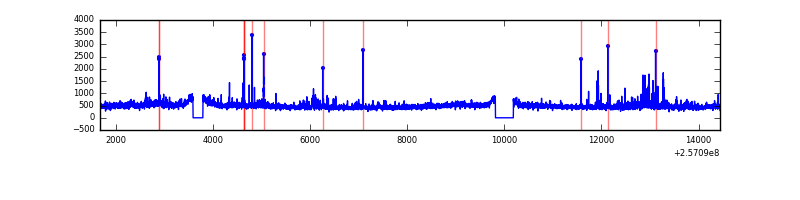 |
| B | 12762 | 12189 | 1386 | 1386 | 10.86% | 11.37% | 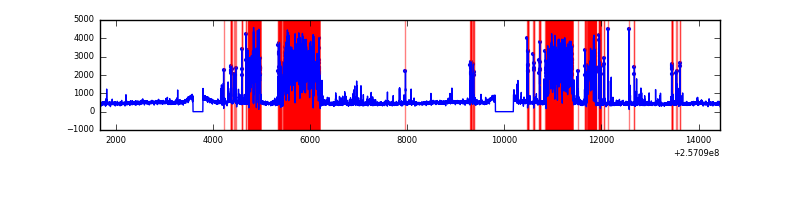 |
| C | 12762 | 12189 | 6 | 6 | 0.05% | 0.05% | 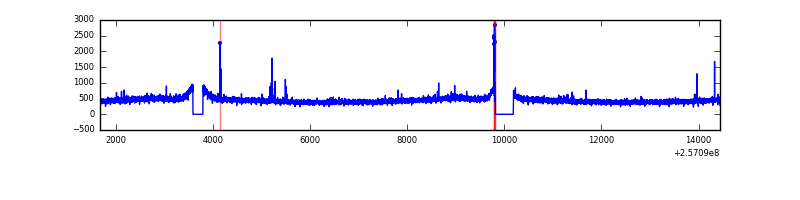 |
| D | 12762 | 12189 | 276 | 276 | 2.16% | 2.26% | 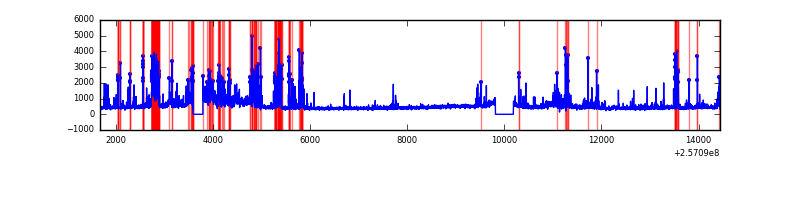 |
Top three noisy pixels from each quadrant. If the there are fewer than three noisy pixels in the level2.evt file, extra rows are filled as -1
| Pixel properties | Quadrant properties | ||||||
|---|---|---|---|---|---|---|---|
| Quadrant | DetID | PixID | Counts | Sigma | Mean | Median | Sigma |
| A | 12 | 189 | 221291 | 773.65 | 1408 | 1375 | 284.3 |
| A | 15 | 223 | 125930 | 438.17 | 1408 | 1375 | 284.3 |
| A | 15 | 174 | 84924 | 293.92 | 1408 | 1375 | 284.3 |
| B | 4 | 239 | 4267882 | 17673.67 | 1267 | 1233 | 241.4 |
| B | 3 | 64 | 203581 | 838.18 | 1267 | 1233 | 241.4 |
| B | 0 | 85 | 115914 | 475.04 | 1267 | 1233 | 241.4 |
| C | 14 | 234 | 41709 | 126.75 | 1377 | 1382 | 318.2 |
| C | 13 | 61 | 10207 | 27.74 | 1377 | 1382 | 318.2 |
| C | 12 | 4 | 10077 | 27.33 | 1377 | 1382 | 318.2 |
| D | 1 | 52 | 1872536 | 5773.58 | 1348 | 1307 | 324.1 |
| D | 8 | 195 | 103316 | 314.74 | 1348 | 1307 | 324.1 |
| D | 14 | 34 | 82565 | 250.72 | 1348 | 1307 | 324.1 |
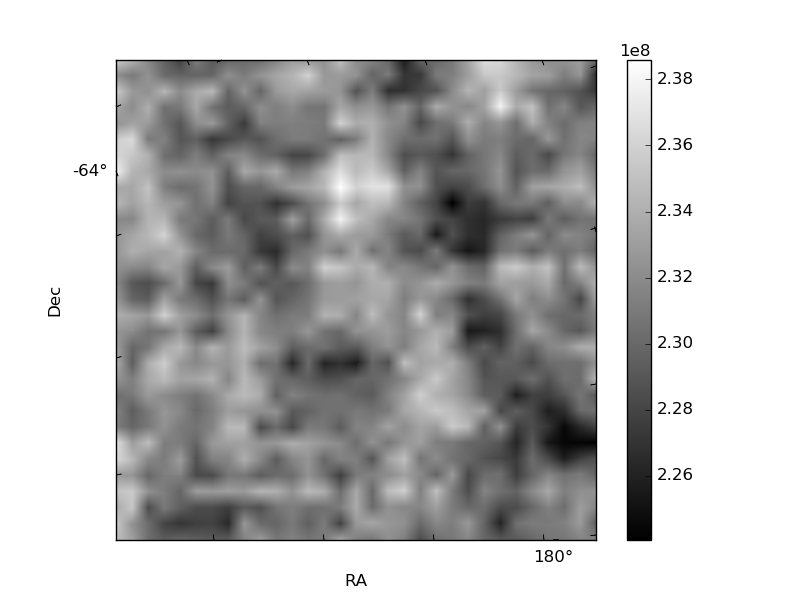
Histogram calculated using DETX and DETY for each event in the final _common_clean file
| Quadrant A |  |
 |
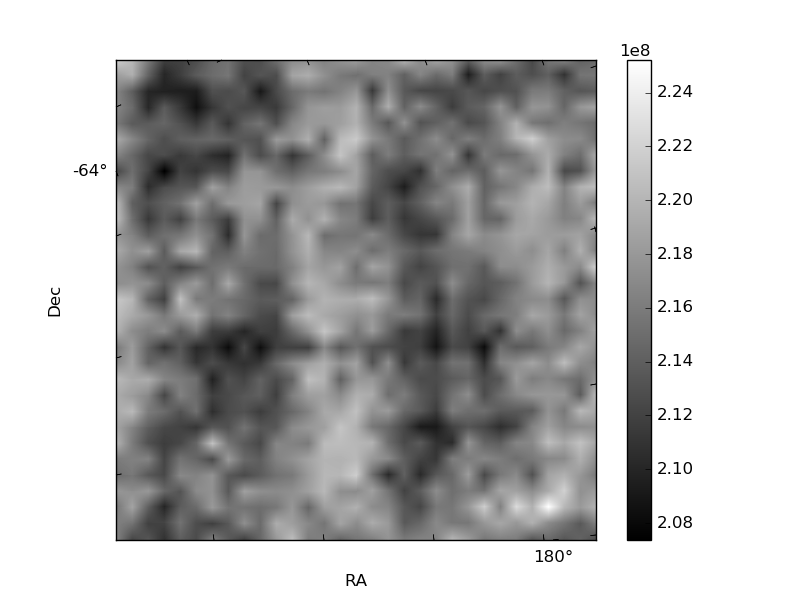
Quadrant B |
|---|---|---|---|
| Quadrant D |  |
 |
Quadrant C |
| Plot type | Count rate plots | Images |
|---|---|---|
| Comparison with Poisson distribution Blue bars denote a histogram of data divided into 1 sec bins. Red curve is a Poisson curve with rate = median count rate of data. |
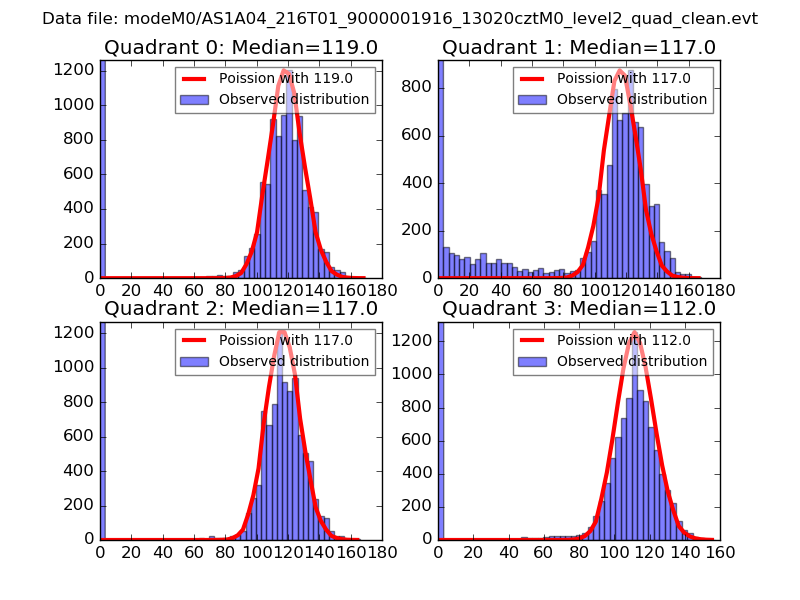 |
 |
| Quadrant-wise count rates Data is divided into 100 sec bins |
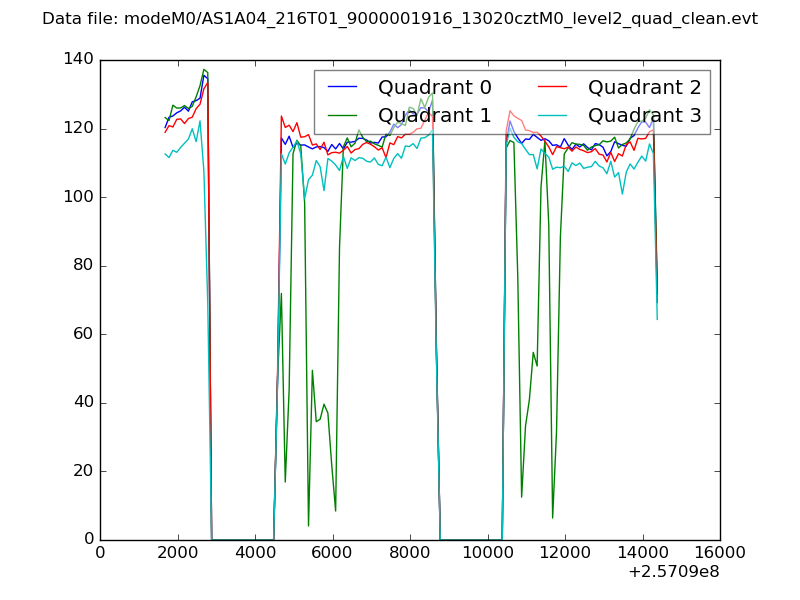 |
|
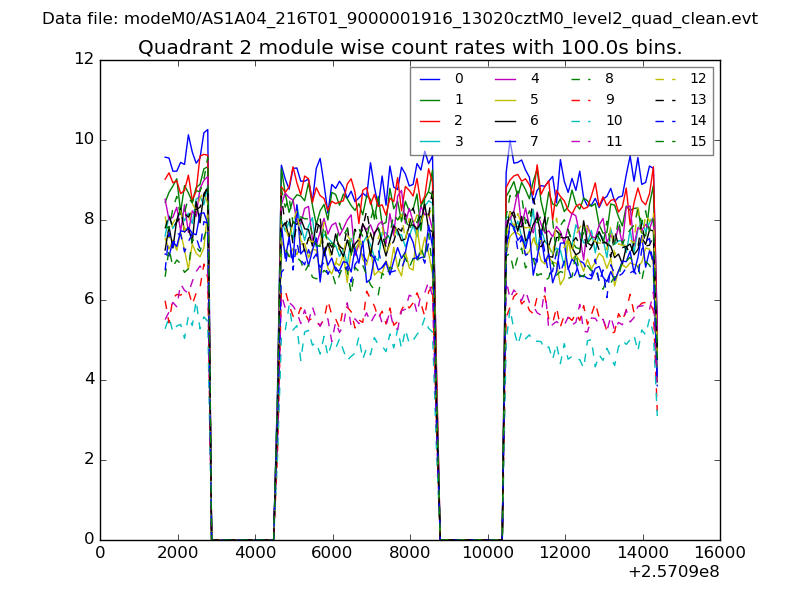
| Module-wise count rates for Quadrant A Data is divided into 100 sec bins |
 |
 |
| Module-wise count rates for Quadrant B Data is divided into 100 sec bins |
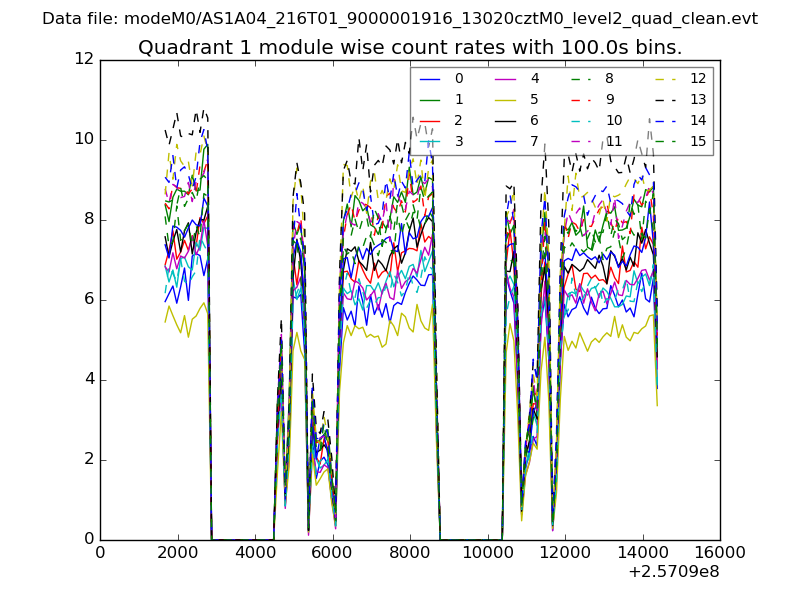 |
 |
| Module-wise count rates for Quadrant C Data is divided into 100 sec bins |
 |
 |
| Module-wise count rates for Quadrant D Data is divided into 100 sec bins |
 |
 |
| Parameter | Plot |
|---|---|
| CZT HV Monitor | 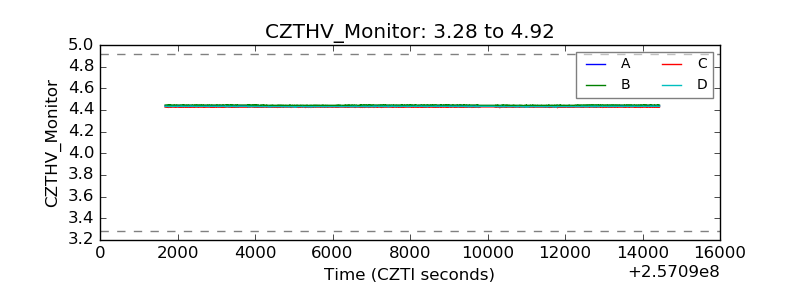 |
| D_VDD |  |
| Temperature 1 |  |
| Veto HV Monitor |  |
| Veto LLD |  |
| Alpha Counter | 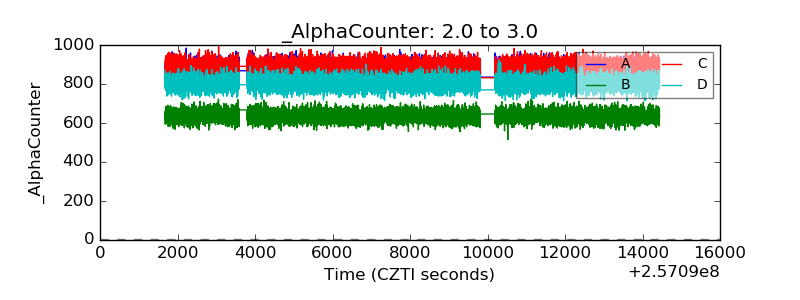 |
| _CPM_Rate | 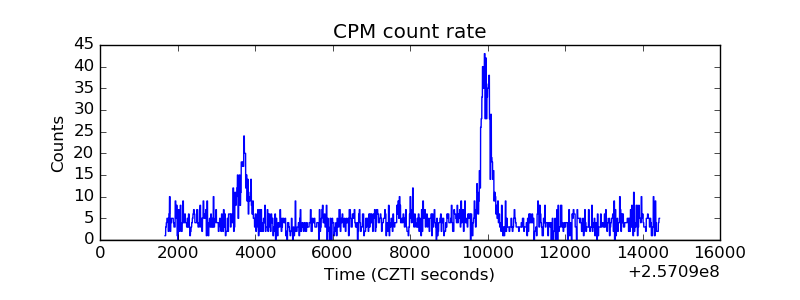 |
| CZT Counter |  |
| +2.5 Volts monitor |  |
| +5 Volts monitor |  |
| _ROLL_ROT |  |
| _Roll_DEC |  |
| _Roll_RA |  |
| Veto Counter |  |