| Param | Original file | Final file |
|---|---|---|
| Filename | modeM0/AS1A04_216T01_9000001916_13022cztM0_level2.evt | modeM0/AS1A04_216T01_9000001916_13022cztM0_level2_quad_clean.evt |
| Size (bytes) | 540,835,200 | 86,904,000 |
| Size | 515.8 MB | 82.9 MB |
| Events in quadrant A | 3,649,579 | 554,341 |
| Events in quadrant B | 4,528,495 | 522,628 |
| Events in quadrant C | 3,027,317 | 565,303 |
| Events in quadrant D | 4,715,944 | 518,891 |
| Mode M9 | |||
|---|---|---|---|
| Quadrant | BADHDUFLAG | Total packets | Discarded packets |
| A | 0 | 18 | 0 |
| B | 0 | 18 | 0 |
| C | 0 | 18 | 0 |
| D | 0 | 19 | 0 |
| Mode SS | |||
|---|---|---|---|
| Quadrant | BADHDUFLAG | Total packets | Discarded packets |
| A | 0 | 136 | 0 |
| B | 0 | 136 | 0 |
| C | 0 | 136 | 0 |
| D | 0 | 136 | 0 |
| Mode M0 | |||
|---|---|---|---|
| Quadrant | BADHDUFLAG | Total packets | Discarded packets |
| A | 0 | 15303 | 3 |
| B | 0 | 17993 | 2 |
| C | 0 | 13632 | 2 |
| D | 0 | 18840 | 2 |
| Quadrant | Total seconds | Saturated seconds | Saturation percentage |
|---|---|---|---|
| A | 6747 | 162 | 2.401067% |
| B | 6747 | 655 | 9.708018% |
| C | 6747 | 11 | 0.163035% |
| D | 6747 | 372 | 5.513562% |
Noise dominated data is calculated using 1-second bins in cleaned event files. If a bin has >2000 counts, and if more than 50% of those come from <1% of pixels, then it is considered to be noise-dominated and hence unusable.
| Quadrant | # 1 sec bins | Bins with >0 counts | Bins with >2000 counts | High rate bins dominated by noise | Noise dominated (total time) | Noise dominated (detector-on time) | Marked lightcurve |
|---|---|---|---|---|---|---|---|
| A | 7808 | 6749 | 109 | 109 | 1.40% | 1.62% | 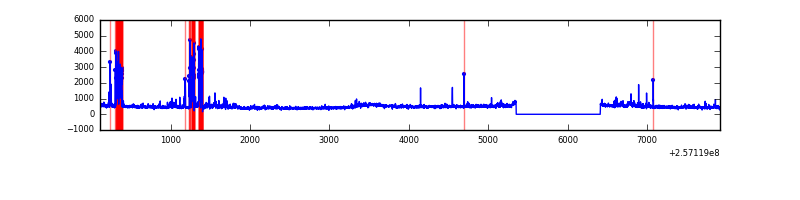 |
| B | 7808 | 6748 | 464 | 464 | 5.94% | 6.88% | 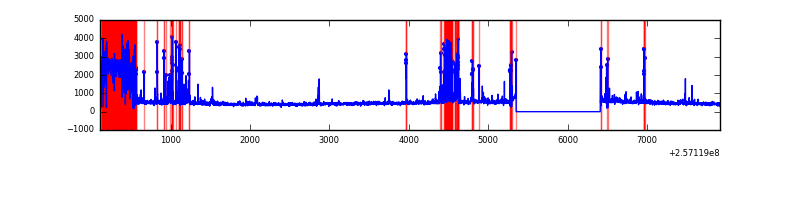 |
| C | 7808 | 6749 | 1 | 1 | 0.01% | 0.01% | 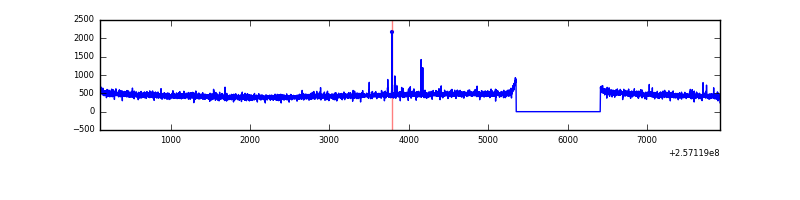 |
| D | 7808 | 6749 | 307 | 307 | 3.93% | 4.55% | 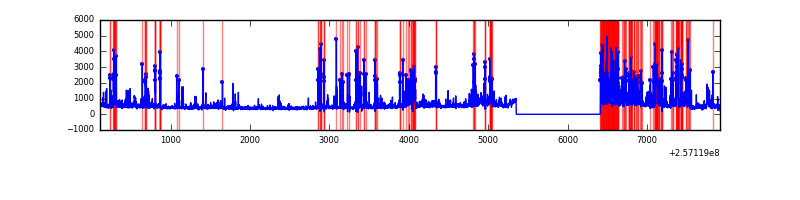 |
Top three noisy pixels from each quadrant. If the there are fewer than three noisy pixels in the level2.evt file, extra rows are filled as -1
| Pixel properties | Quadrant properties | ||||||
|---|---|---|---|---|---|---|---|
| Quadrant | DetID | PixID | Counts | Sigma | Mean | Median | Sigma |
| A | 15 | 223 | 249559 | 1579.2 | 772 | 758 | 157.5 |
| A | 12 | 189 | 158557 | 1001.59 | 772 | 758 | 157.5 |
| A | 15 | 239 | 109362 | 689.34 | 772 | 758 | 157.5 |
| B | 4 | 239 | 1432848 | 10386.29 | 732 | 714 | 137.9 |
| B | 3 | 64 | 145708 | 1051.54 | 732 | 714 | 137.9 |
| B | 0 | 219 | 41419 | 295.21 | 732 | 714 | 137.9 |
| C | 14 | 234 | 11994 | 62.98 | 767 | 770 | 178.2 |
| C | 8 | 128 | 10630 | 55.33 | 767 | 770 | 178.2 |
| C | 12 | 4 | 5942 | 29.02 | 767 | 770 | 178.2 |
| D | 1 | 52 | 1872959 | 10594.11 | 736 | 716 | 176.7 |
| D | 8 | 195 | 33442 | 185.18 | 736 | 716 | 176.7 |
| D | 2 | 234 | 22979 | 125.98 | 736 | 716 | 176.7 |
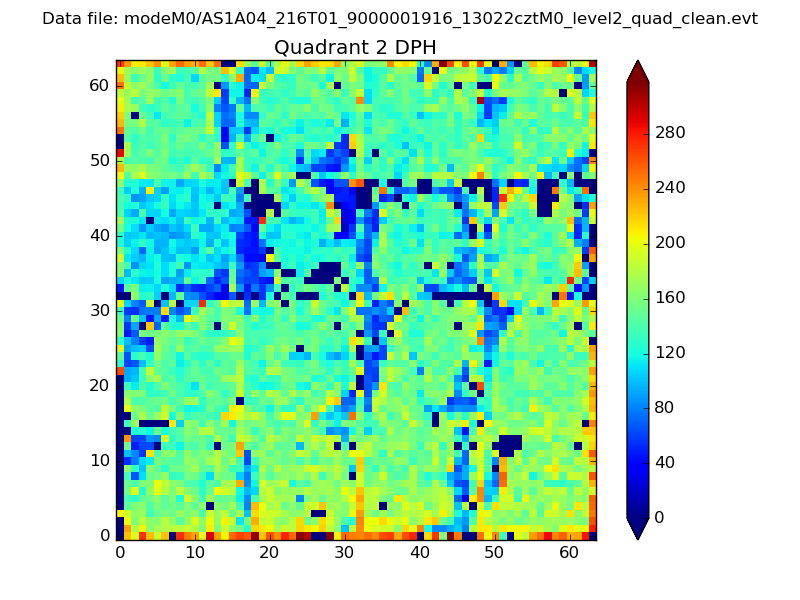
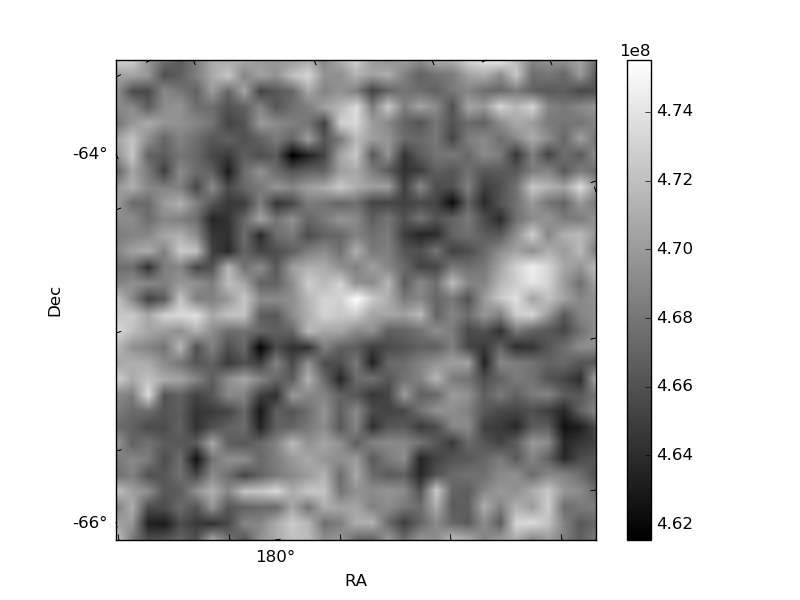
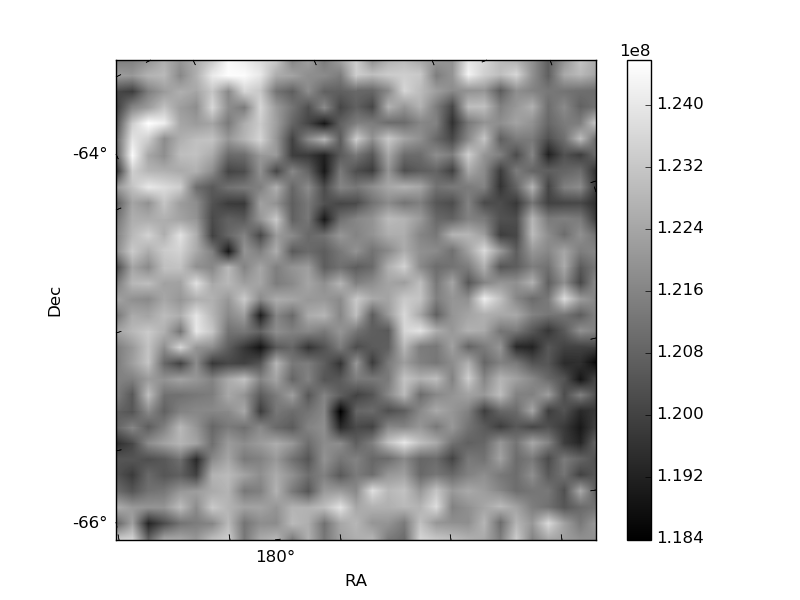
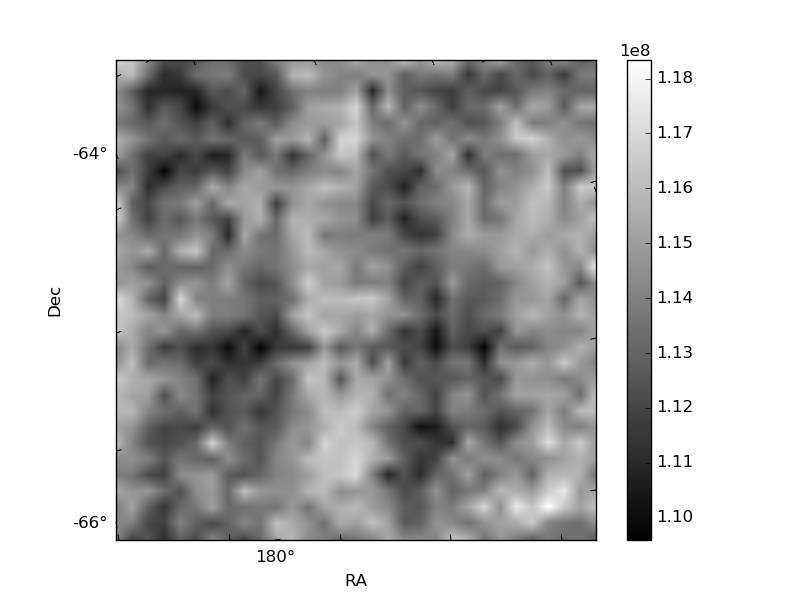
Histogram calculated using DETX and DETY for each event in the final _common_clean file
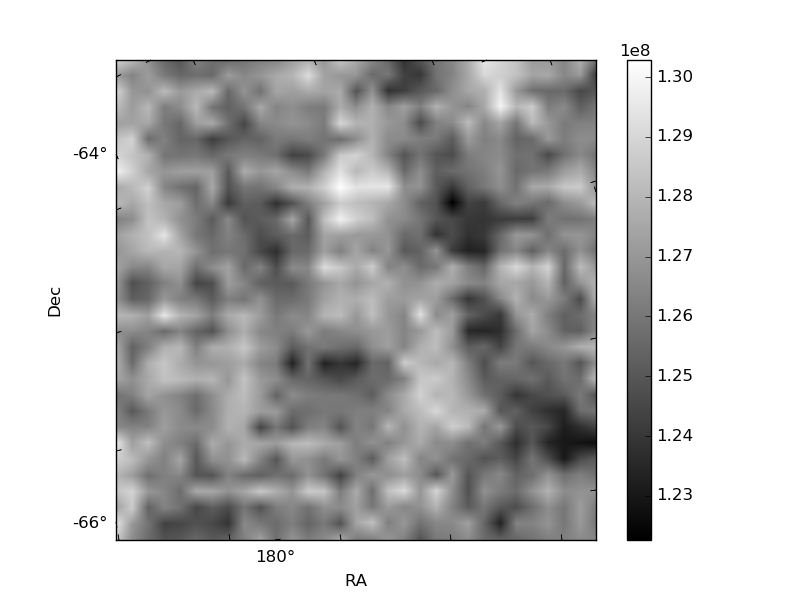
| Quadrant A | 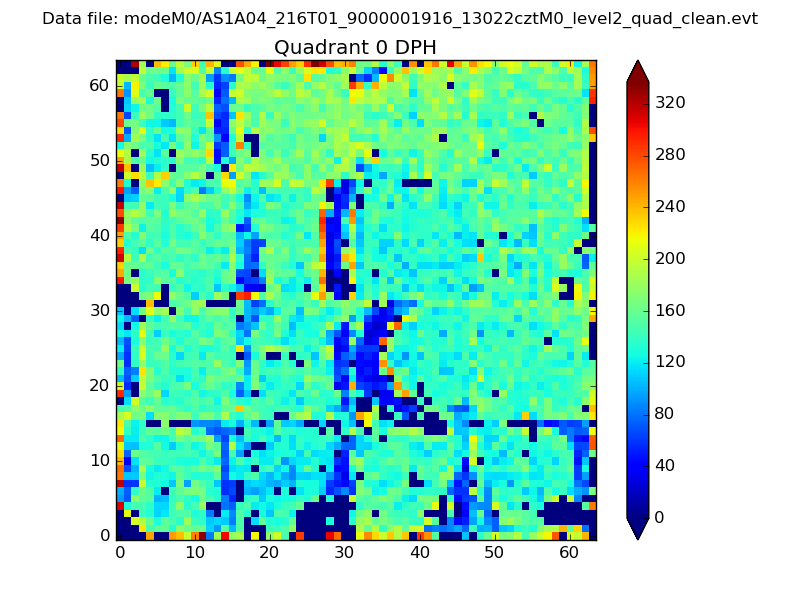 |
 |
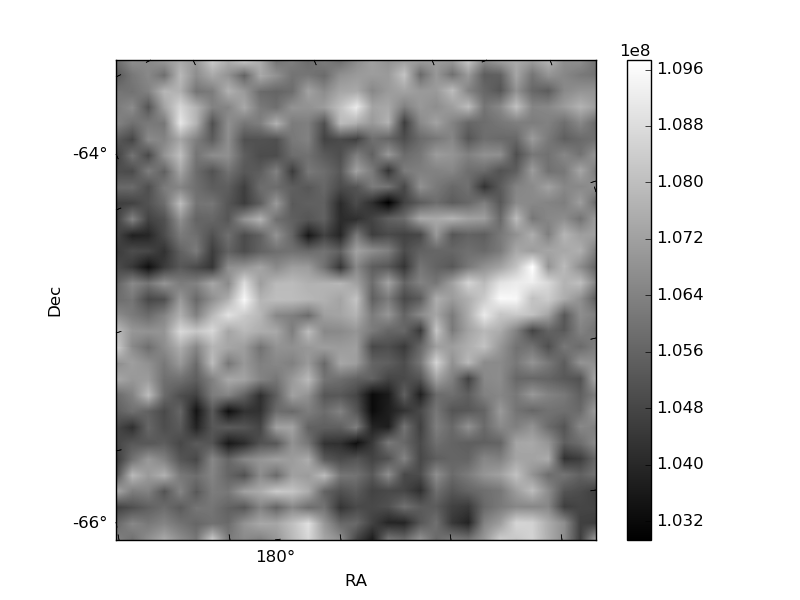
Quadrant B |
|---|---|---|---|
| Quadrant D | 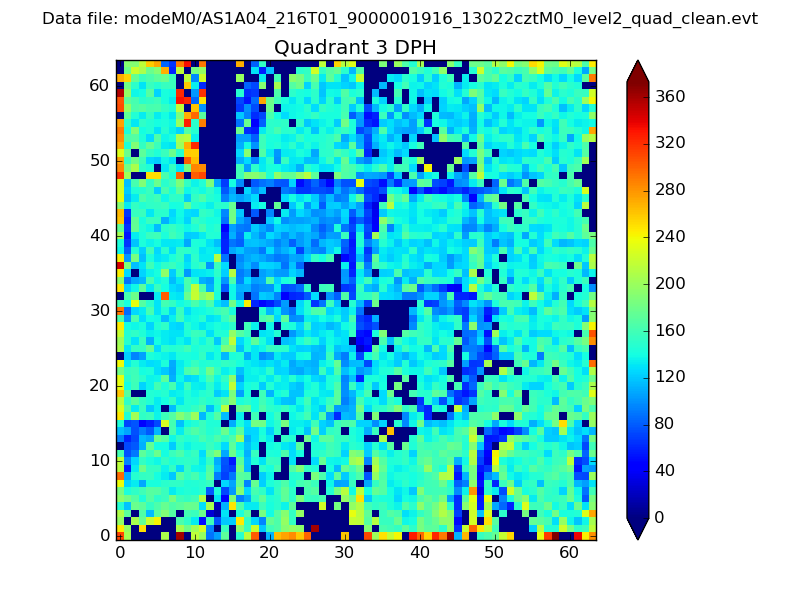 |
 |
Quadrant C |
| Plot type | Count rate plots | Images |
|---|---|---|
| Comparison with Poisson distribution Blue bars denote a histogram of data divided into 1 sec bins. Red curve is a Poisson curve with rate = median count rate of data. |
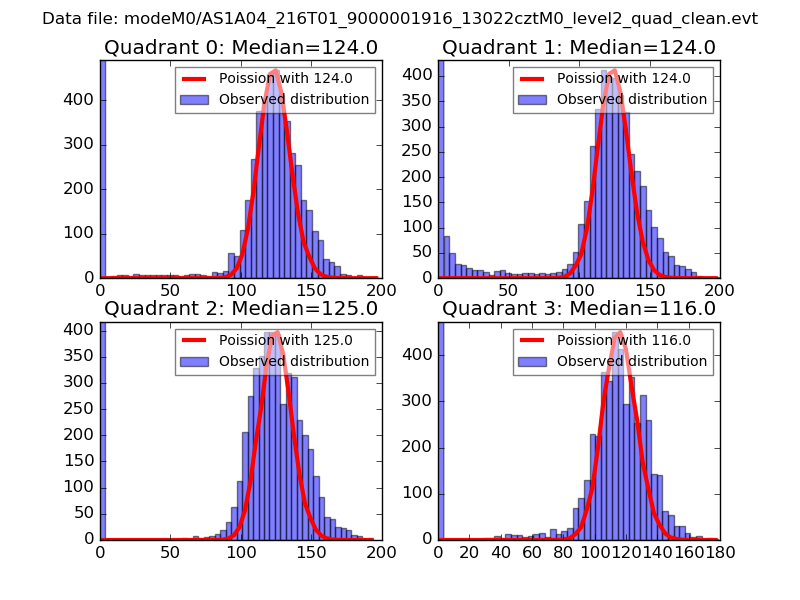 |
 |
| Quadrant-wise count rates Data is divided into 100 sec bins |
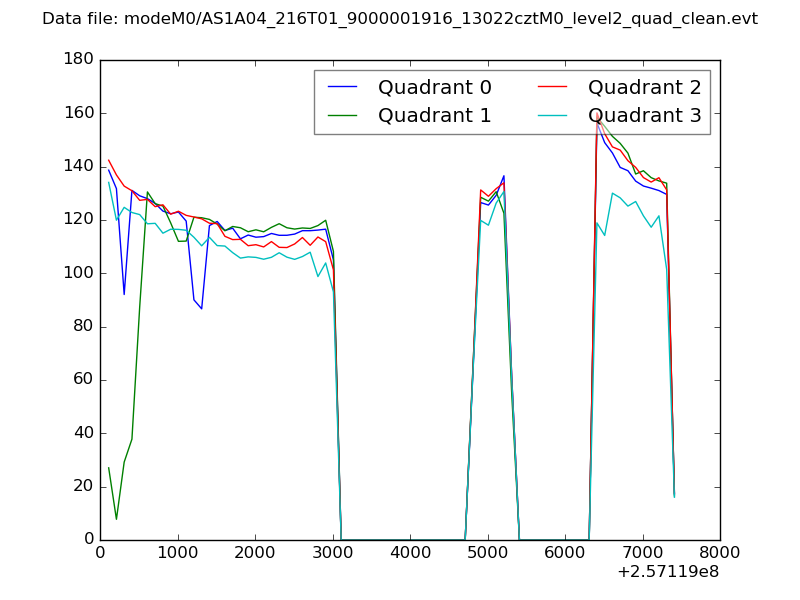 |
|
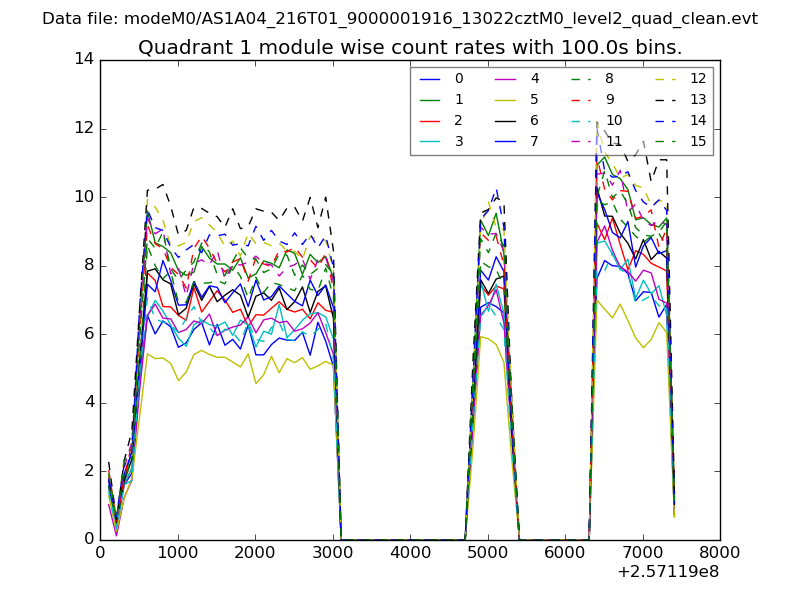
| Module-wise count rates for Quadrant A Data is divided into 100 sec bins |
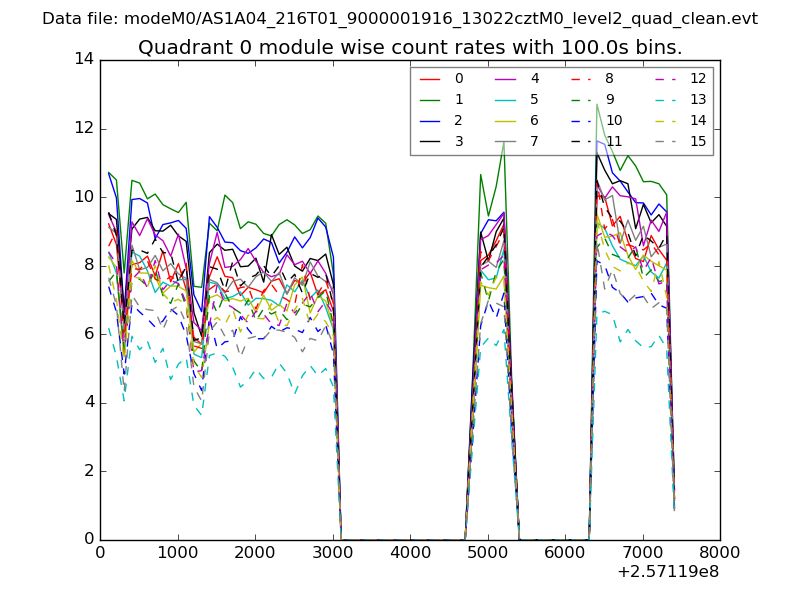 |
 |
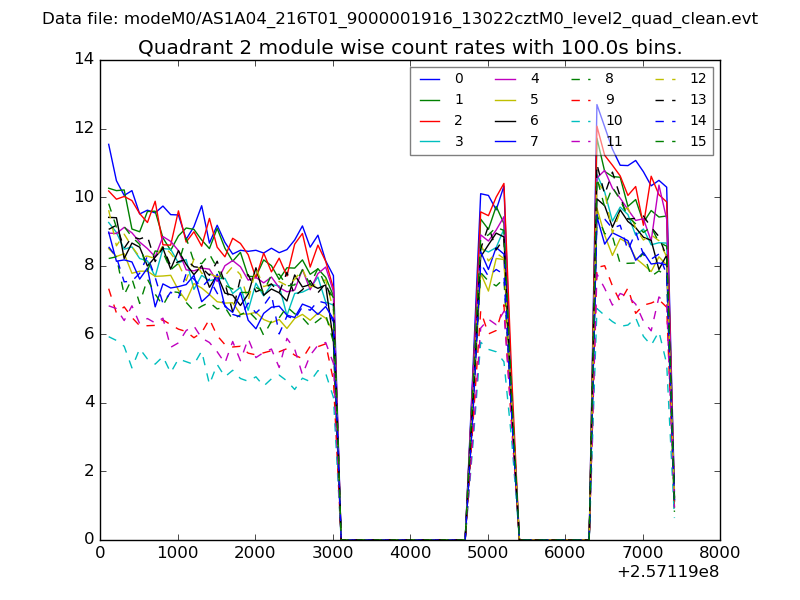
| Module-wise count rates for Quadrant B Data is divided into 100 sec bins |
 |
 |
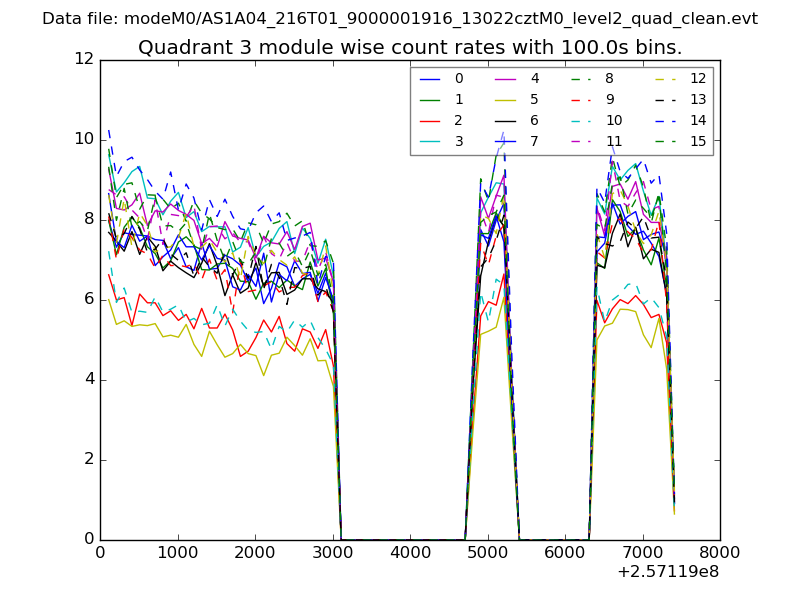
| Module-wise count rates for Quadrant C Data is divided into 100 sec bins |
 |
 |
| Module-wise count rates for Quadrant D Data is divided into 100 sec bins |
 |
 |
| Parameter | Plot |
|---|---|
| CZT HV Monitor | 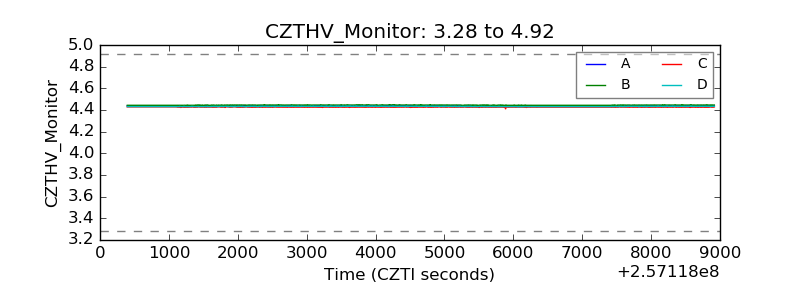 |
| D_VDD | 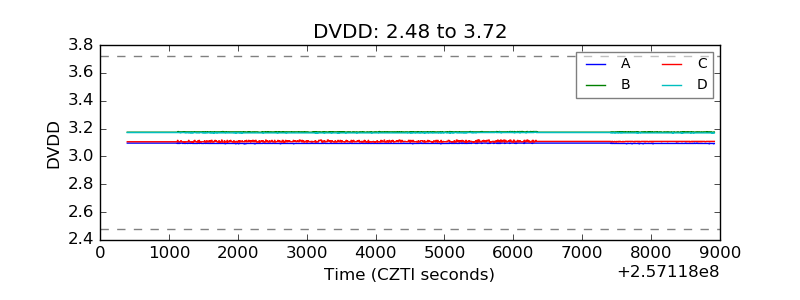 |
| Temperature 1 | 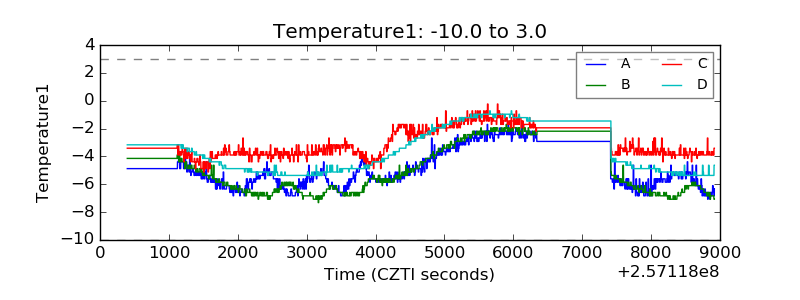 |
| Veto HV Monitor | 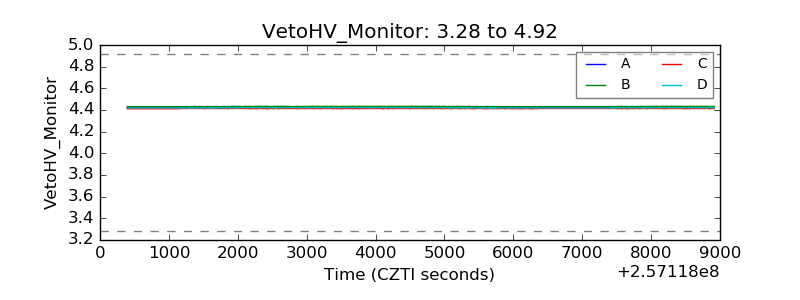 |
| Veto LLD | 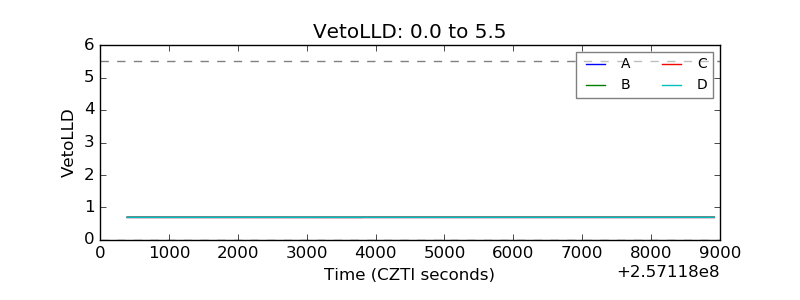 |
| Alpha Counter | 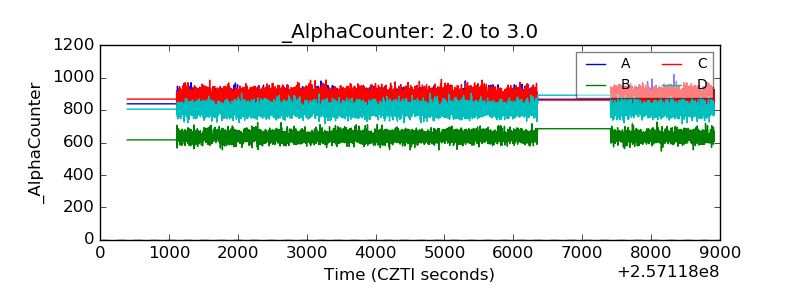 |
| _CPM_Rate | 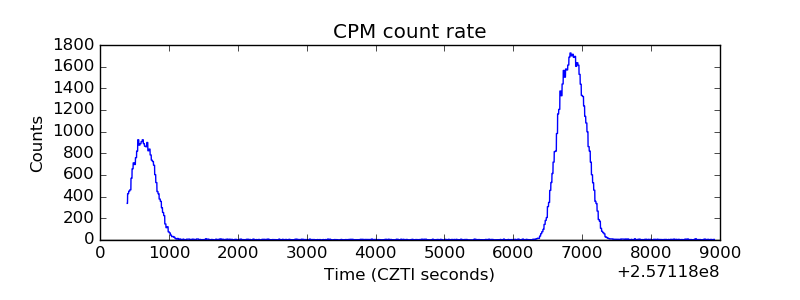 |
| CZT Counter | 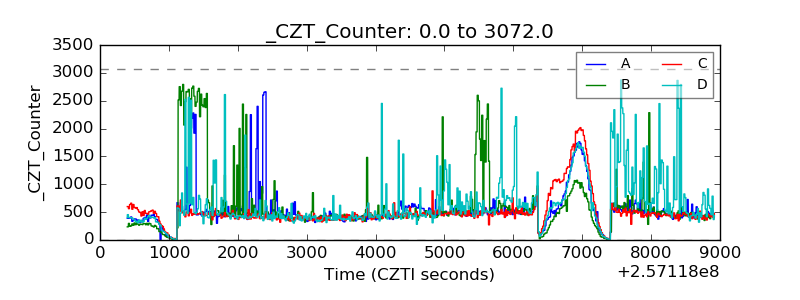 |
| +2.5 Volts monitor |  |
| +5 Volts monitor |  |
| _ROLL_ROT | 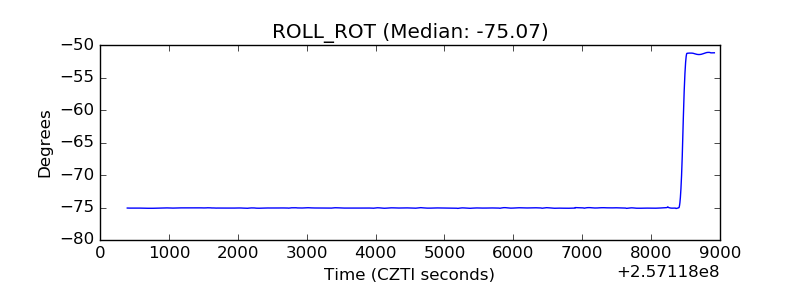 |
| _Roll_DEC | 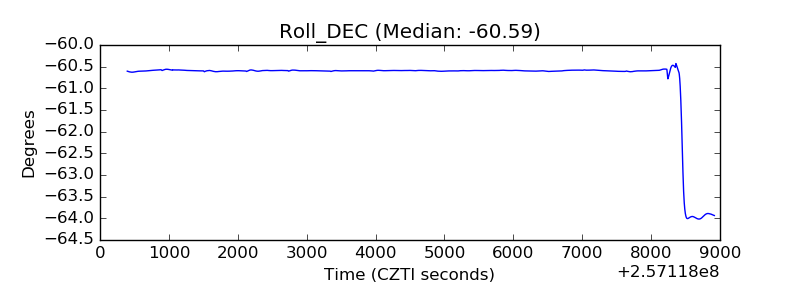 |
| _Roll_RA | 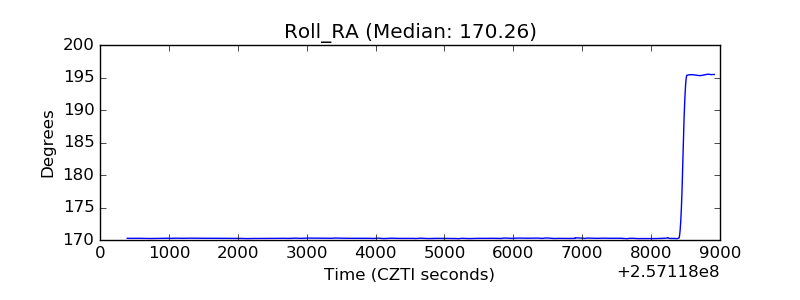 |
| Veto Counter | 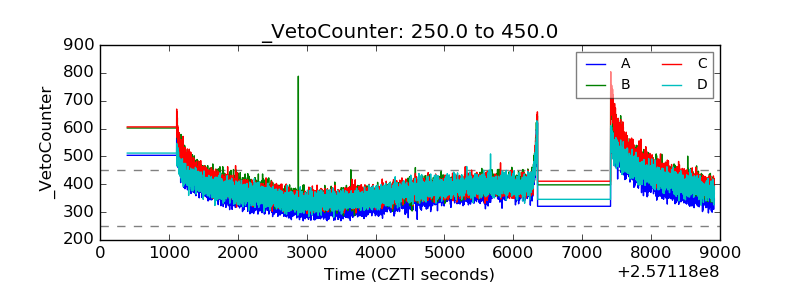 |