| Param | Original file | Final file |
|---|---|---|
| Filename | modeM0/AS1A04_216T01_9000001916_13024cztM0_level2.evt | modeM0/AS1A04_216T01_9000001916_13024cztM0_level2_quad_clean.evt |
| Size (bytes) | 582,914,880 | 80,965,440 |
| Size | 555.9 MB | 77.2 MB |
| Events in quadrant A | 3,293,642 | 517,334 |
| Events in quadrant B | 3,988,597 | 508,546 |
| Events in quadrant C | 3,045,497 | 521,248 |
| Events in quadrant D | 6,879,444 | 444,889 |
| Mode M9 | |||
|---|---|---|---|
| Quadrant | BADHDUFLAG | Total packets | Discarded packets |
| A | 0 | 21 | 0 |
| B | 0 | 21 | 0 |
| C | 0 | 21 | 0 |
| D | 0 | 21 | 0 |
| Mode SS | |||
|---|---|---|---|
| Quadrant | BADHDUFLAG | Total packets | Discarded packets |
| A | 0 | 134 | 0 |
| B | 0 | 134 | 0 |
| C | 0 | 134 | 0 |
| D | 0 | 134 | 0 |
| Mode M0 | |||
|---|---|---|---|
| Quadrant | BADHDUFLAG | Total packets | Discarded packets |
| A | 0 | 13993 | 3 |
| B | 0 | 16218 | 2 |
| C | 0 | 13402 | 2 |
| D | 0 | 25126 | 2 |
| Quadrant | Total seconds | Saturated seconds | Saturation percentage |
|---|---|---|---|
| A | 6587 | 14 | 0.212540% |
| B | 6587 | 446 | 6.770912% |
| C | 6587 | 12 | 0.182177% |
| D | 6587 | 898 | 13.632913% |
Noise dominated data is calculated using 1-second bins in cleaned event files. If a bin has >2000 counts, and if more than 50% of those come from <1% of pixels, then it is considered to be noise-dominated and hence unusable.
| Quadrant | # 1 sec bins | Bins with >0 counts | Bins with >2000 counts | High rate bins dominated by noise | Noise dominated (total time) | Noise dominated (detector-on time) | Marked lightcurve |
|---|---|---|---|---|---|---|---|
| A | 7748 | 6589 | 1 | 1 | 0.01% | 0.02% | 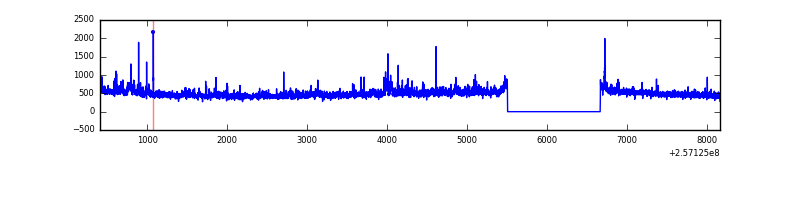 |
| B | 7748 | 6589 | 218 | 218 | 2.81% | 3.31% | 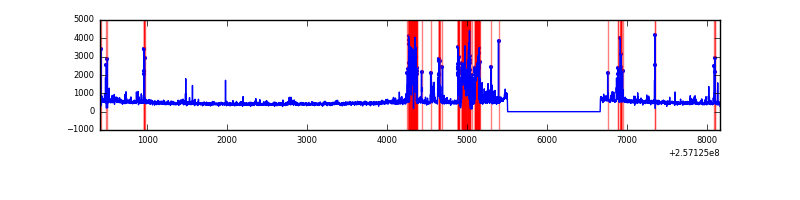 |
| C | 7748 | 6589 | 1 | 1 | 0.01% | 0.02% | 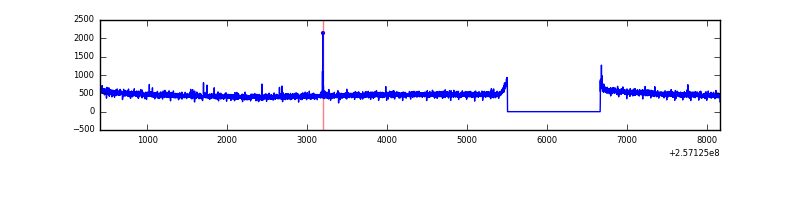 |
| D | 7748 | 6589 | 757 | 757 | 9.77% | 11.49% | 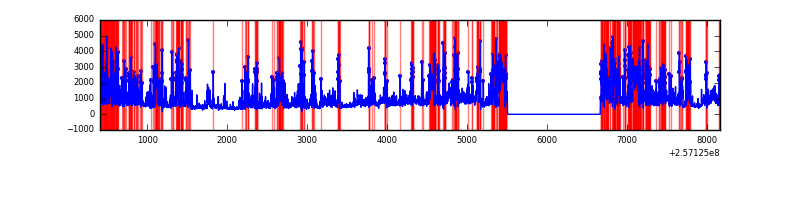 |
Top three noisy pixels from each quadrant. If the there are fewer than three noisy pixels in the level2.evt file, extra rows are filled as -1
| Pixel properties | Quadrant properties | ||||||
|---|---|---|---|---|---|---|---|
| Quadrant | DetID | PixID | Counts | Sigma | Mean | Median | Sigma |
| A | 12 | 189 | 178084 | 1127.15 | 781 | 766 | 157.3 |
| A | 1 | 162 | 25279 | 155.82 | 781 | 766 | 157.3 |
| A | 15 | 223 | 20962 | 128.38 | 781 | 766 | 157.3 |
| B | 4 | 239 | 873151 | 6174.11 | 756 | 736 | 141.3 |
| B | 3 | 64 | 61715 | 431.55 | 756 | 736 | 141.3 |
| B | 0 | 219 | 35562 | 246.46 | 756 | 736 | 141.3 |
| C | 14 | 234 | 6317 | 30.86 | 778 | 784 | 179.3 |
| C | 12 | 4 | 5958 | 28.86 | 778 | 784 | 179.3 |
| C | 13 | 61 | 5600 | 26.86 | 778 | 784 | 179.3 |
| D | 1 | 52 | 4090984 | 24215.85 | 712 | 693 | 168.9 |
| D | 8 | 195 | 88609 | 520.49 | 712 | 693 | 168.9 |
| D | 2 | 234 | 19042 | 108.63 | 712 | 693 | 168.9 |
Histogram calculated using DETX and DETY for each event in the final _common_clean file
| Quadrant A | 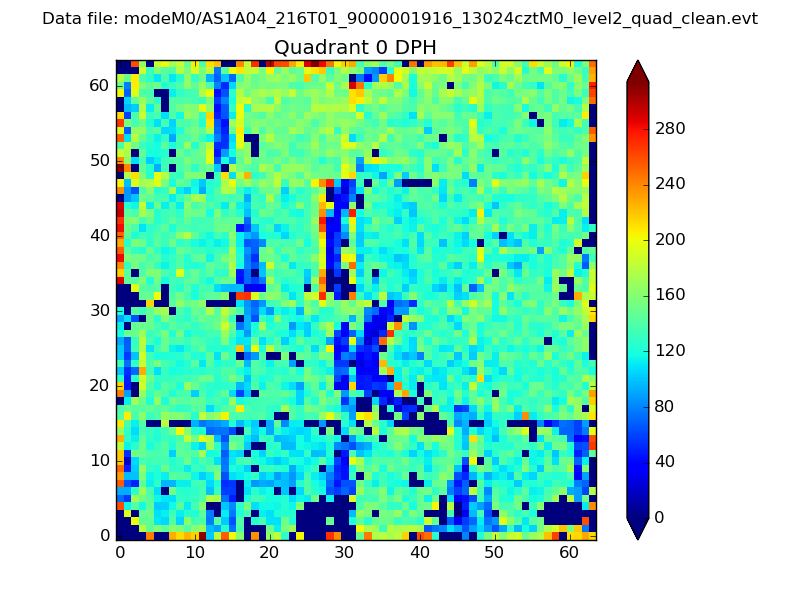 |
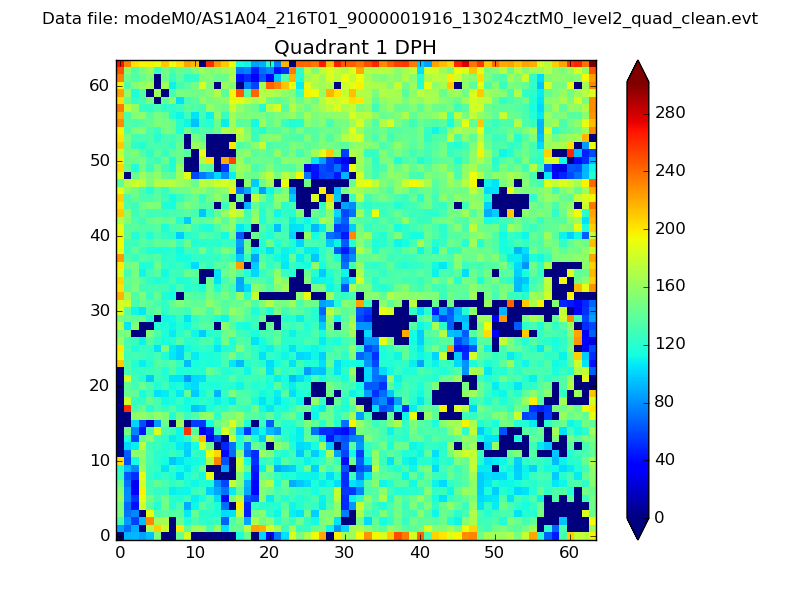 |
Quadrant B |
|---|---|---|---|
| Quadrant D | 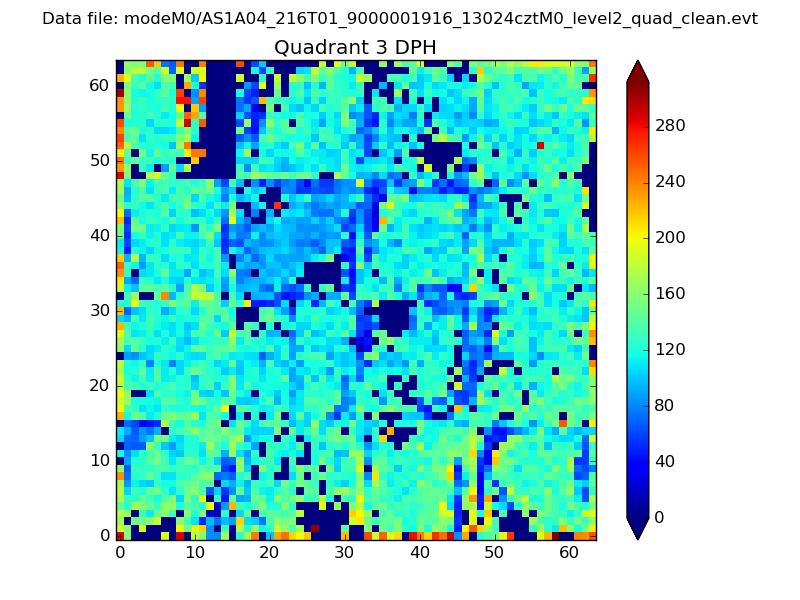 |
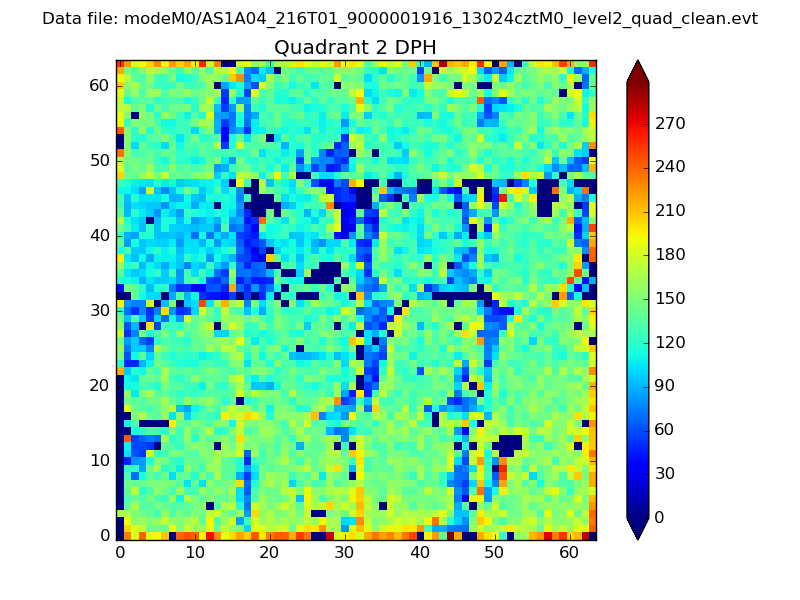 |
Quadrant C |
| Plot type | Count rate plots | Images |
|---|---|---|
| Comparison with Poisson distribution Blue bars denote a histogram of data divided into 1 sec bins. Red curve is a Poisson curve with rate = median count rate of data. |
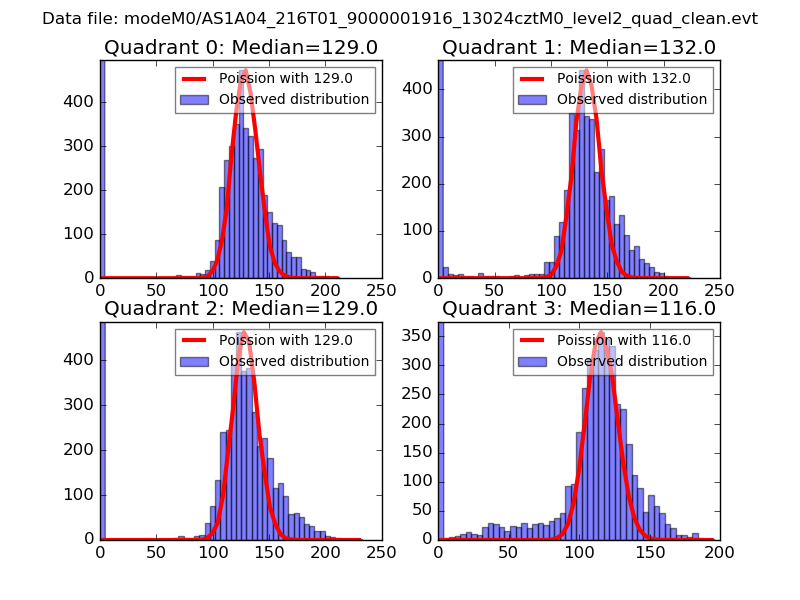 |
 |
| Quadrant-wise count rates Data is divided into 100 sec bins |
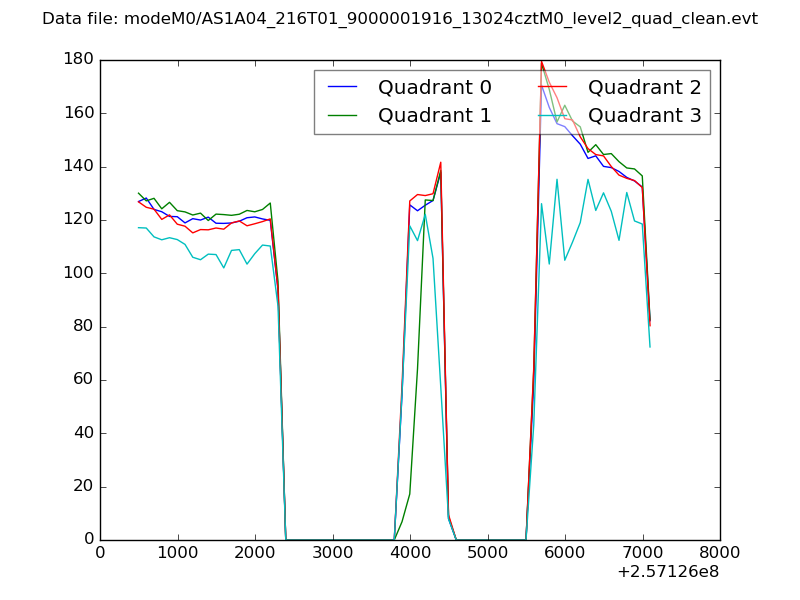 |
|
| Module-wise count rates for Quadrant A Data is divided into 100 sec bins |
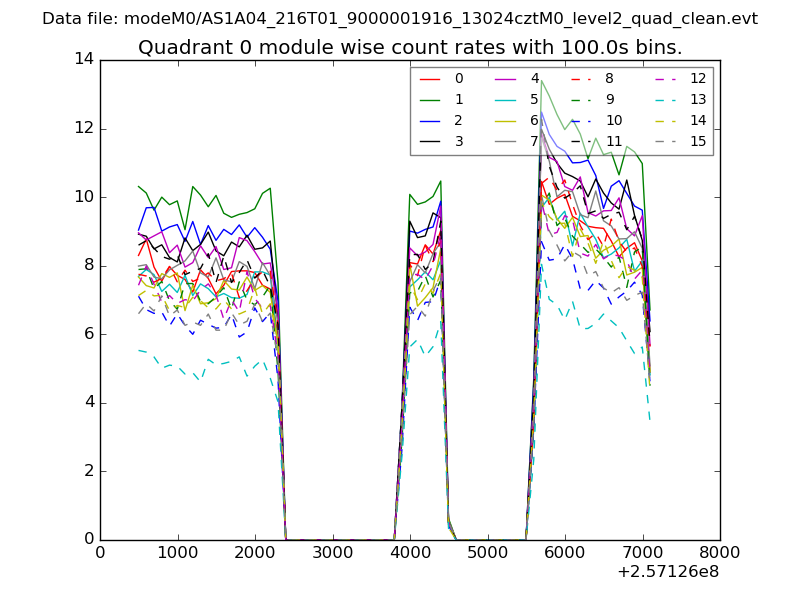 |
 |
| Module-wise count rates for Quadrant B Data is divided into 100 sec bins |
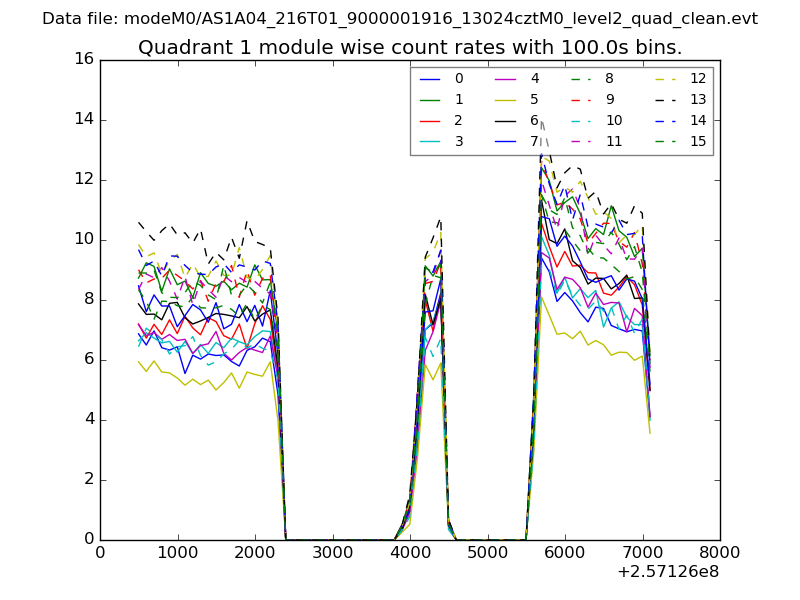 |
 |
| Module-wise count rates for Quadrant C Data is divided into 100 sec bins |
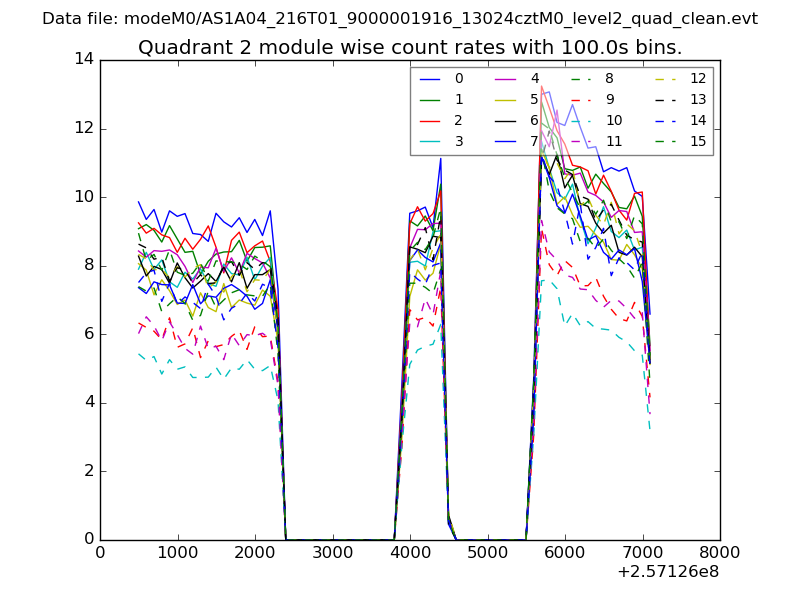 |
 |
| Module-wise count rates for Quadrant D Data is divided into 100 sec bins |
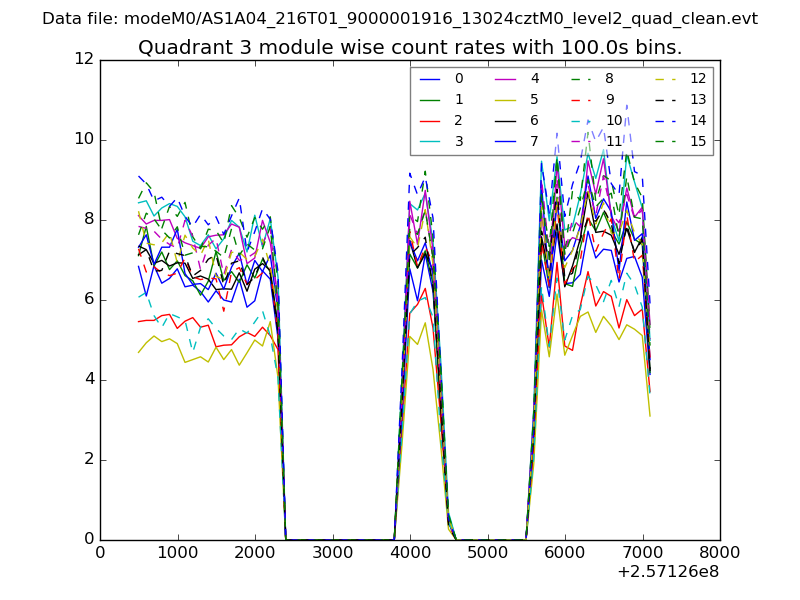 |
 |
| Parameter | Plot |
|---|---|
| CZT HV Monitor | 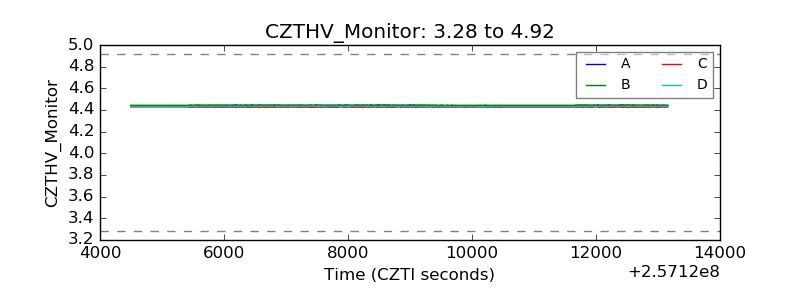 |
| D_VDD | 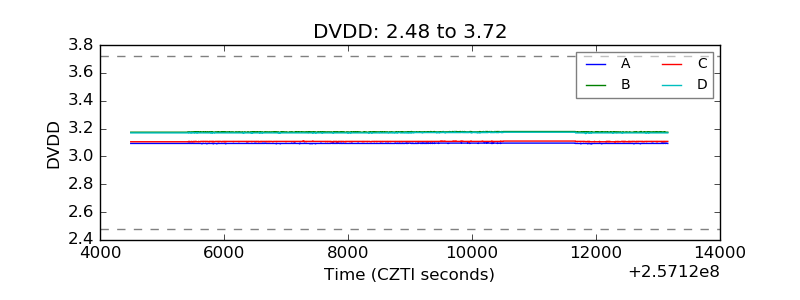 |
| Temperature 1 | 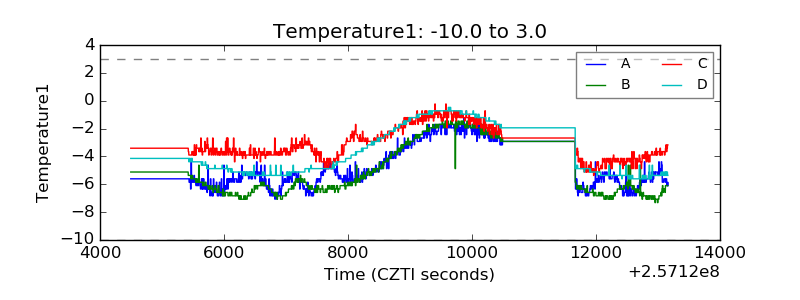 |
| Veto HV Monitor |  |
| Veto LLD | 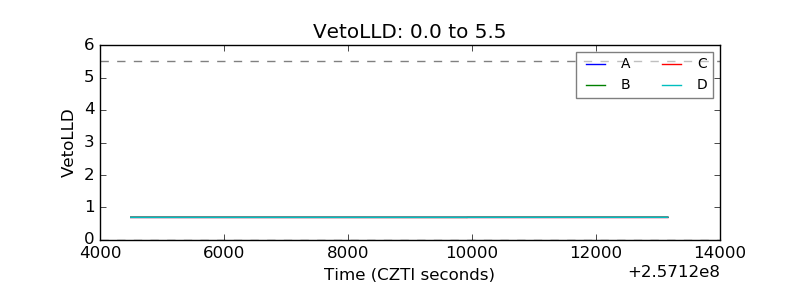 |
| Alpha Counter | 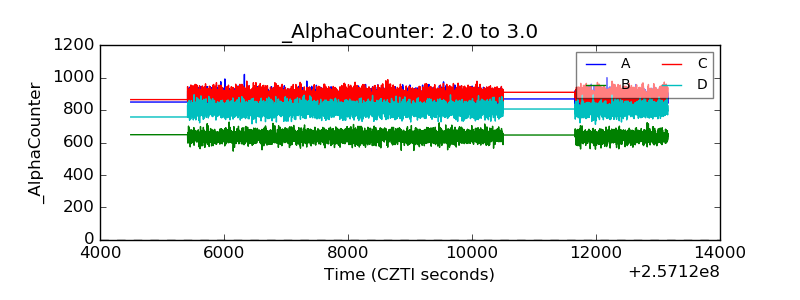 |
| _CPM_Rate | 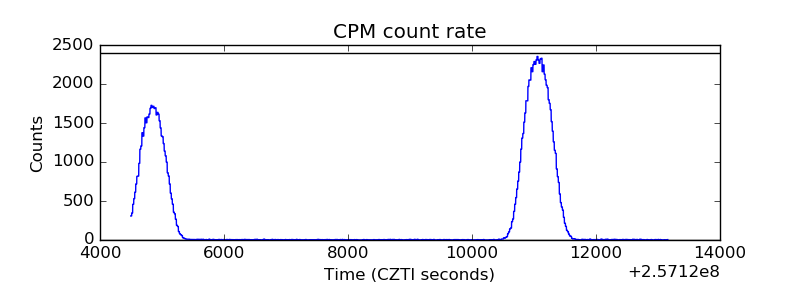 |
| CZT Counter | 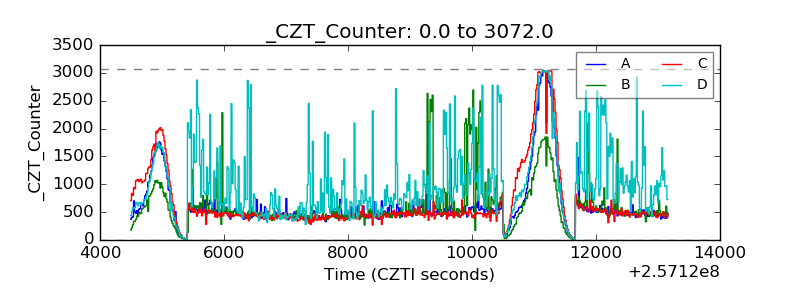 |
| +2.5 Volts monitor | 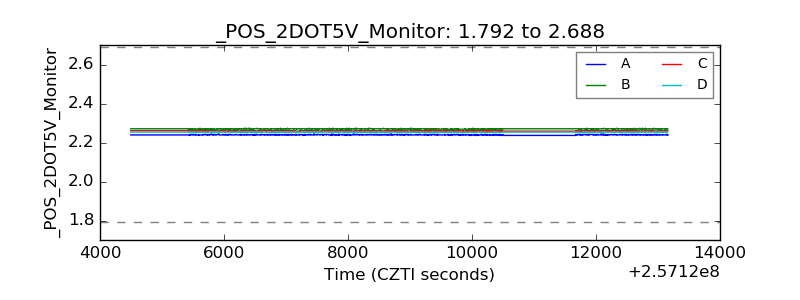 |
| +5 Volts monitor |  |
| _ROLL_ROT | 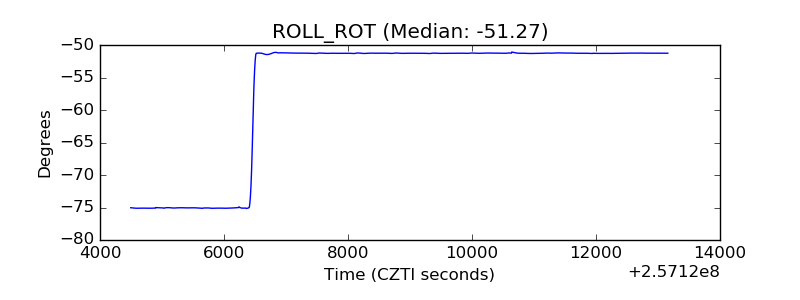 |
| _Roll_DEC | 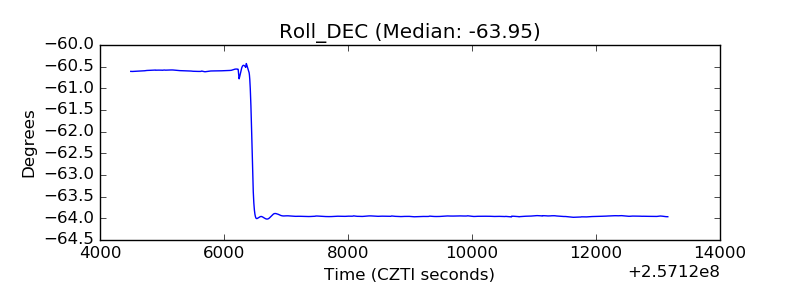 |
| _Roll_RA | 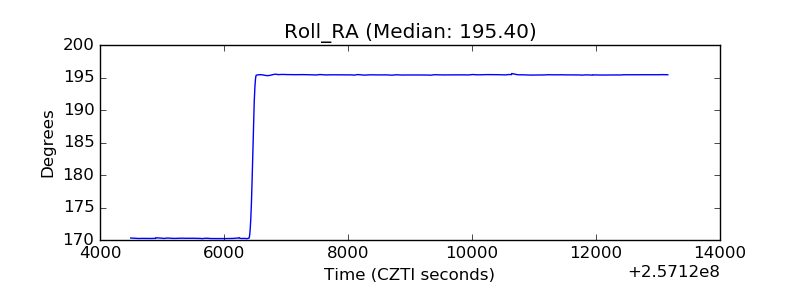 |
| Veto Counter | 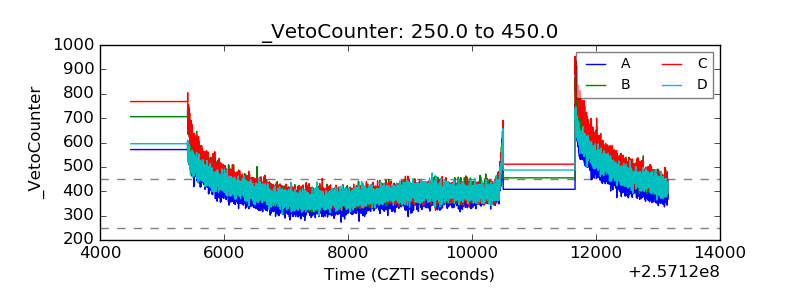 |