| Param | Original file | Final file |
|---|---|---|
| Filename | modeM0/AS1A04_216T01_9000001916_13025cztM0_level2.evt | modeM0/AS1A04_216T01_9000001916_13025cztM0_level2_quad_clean.evt |
| Size (bytes) | 556,436,160 | 103,809,600 |
| Size | 530.7 MB | 99.0 MB |
| Events in quadrant A | 3,235,162 | 687,179 |
| Events in quadrant B | 4,738,912 | 684,760 |
| Events in quadrant C | 3,095,090 | 700,978 |
| Events in quadrant D | 5,347,067 | 622,734 |
| Mode M9 | |||
|---|---|---|---|
| Quadrant | BADHDUFLAG | Total packets | Discarded packets |
| A | 0 | 14 | 0 |
| B | 0 | 14 | 0 |
| C | 0 | 14 | 0 |
| D | 0 | 15 | 0 |
| Mode SS | |||
|---|---|---|---|
| Quadrant | BADHDUFLAG | Total packets | Discarded packets |
| A | 0 | 130 | 0 |
| B | 0 | 130 | 0 |
| C | 0 | 130 | 0 |
| D | 0 | 130 | 0 |
| Mode M0 | |||
|---|---|---|---|
| Quadrant | BADHDUFLAG | Total packets | Discarded packets |
| A | 0 | 13523 | 3 |
| B | 0 | 18226 | 2 |
| C | 0 | 13238 | 2 |
| D | 0 | 20036 | 2 |
| Quadrant | Total seconds | Saturated seconds | Saturation percentage |
|---|---|---|---|
| A | 6422 | 24 | 0.373715% |
| B | 6422 | 699 | 10.884460% |
| C | 6422 | 33 | 0.513859% |
| D | 6422 | 493 | 7.676736% |
Noise dominated data is calculated using 1-second bins in cleaned event files. If a bin has >2000 counts, and if more than 50% of those come from <1% of pixels, then it is considered to be noise-dominated and hence unusable.
| Quadrant | # 1 sec bins | Bins with >0 counts | Bins with >2000 counts | High rate bins dominated by noise | Noise dominated (total time) | Noise dominated (detector-on time) | Marked lightcurve |
|---|---|---|---|---|---|---|---|
| A | 7673 | 6424 | 1 | 1 | 0.01% | 0.02% | 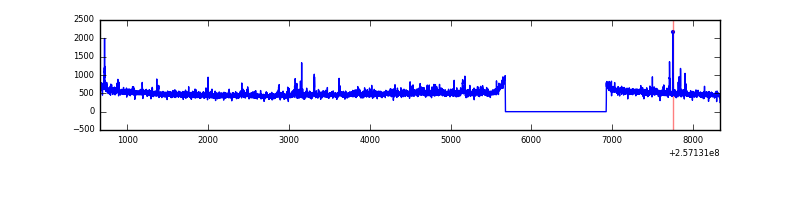 |
| B | 7673 | 6424 | 454 | 454 | 5.92% | 7.07% | 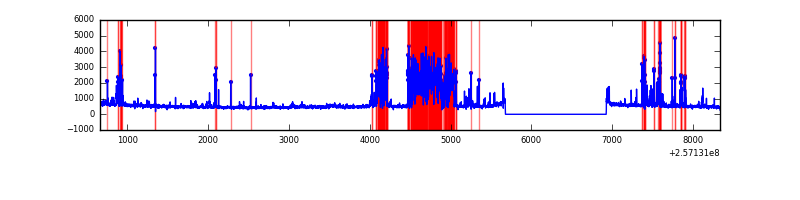 |
| C | 7673 | 6424 | 0 | 0 | 0.00% | 0.00% | 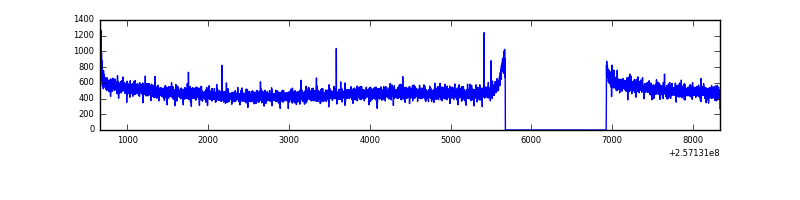 |
| D | 7673 | 6424 | 407 | 407 | 5.30% | 6.34% | 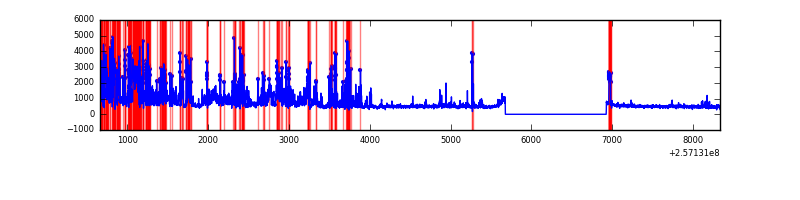 |
Top three noisy pixels from each quadrant. If the there are fewer than three noisy pixels in the level2.evt file, extra rows are filled as -1
| Pixel properties | Quadrant properties | ||||||
|---|---|---|---|---|---|---|---|
| Quadrant | DetID | PixID | Counts | Sigma | Mean | Median | Sigma |
| A | 12 | 189 | 80928 | 501.7 | 790 | 773 | 159.8 |
| A | 15 | 223 | 32842 | 200.72 | 790 | 773 | 159.8 |
| A | 1 | 162 | 32108 | 196.13 | 790 | 773 | 159.8 |
| B | 4 | 239 | 1494568 | 10634.22 | 753 | 732 | 140.5 |
| B | 3 | 64 | 192353 | 1364.1 | 753 | 732 | 140.5 |
| B | 0 | 214 | 50606 | 355.04 | 753 | 732 | 140.5 |
| C | 13 | 61 | 5799 | 27.66 | 791 | 798 | 180.8 |
| C | 14 | 234 | 4932 | 22.86 | 791 | 798 | 180.8 |
| C | 12 | 4 | 3405 | 14.42 | 791 | 798 | 180.8 |
| D | 1 | 52 | 2470687 | 13853.84 | 747 | 727 | 178.3 |
| D | 8 | 195 | 44159 | 243.61 | 747 | 727 | 178.3 |
| D | 2 | 234 | 19218 | 103.71 | 747 | 727 | 178.3 |
Histogram calculated using DETX and DETY for each event in the final _common_clean file
| Quadrant A |  |
 |
Quadrant B |
|---|---|---|---|
| Quadrant D |  |
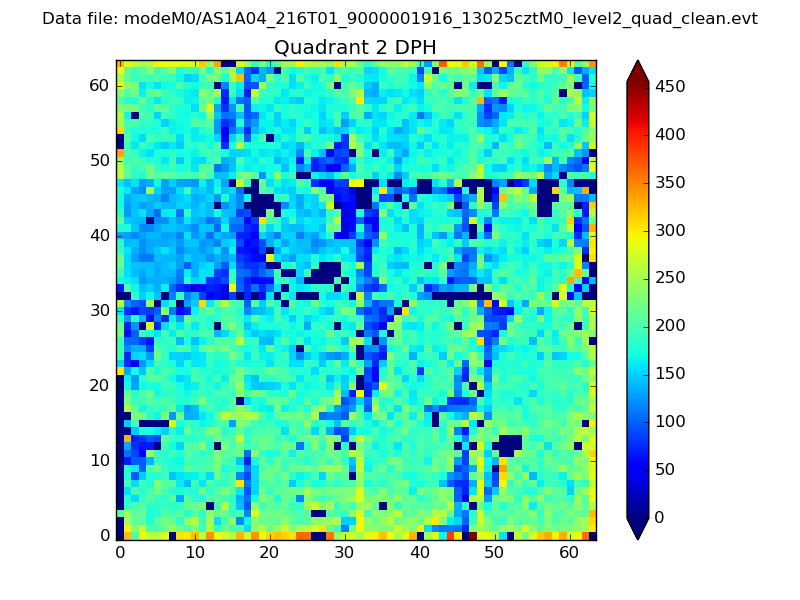 |
Quadrant C |
| Plot type | Count rate plots | Images |
|---|---|---|
| Comparison with Poisson distribution Blue bars denote a histogram of data divided into 1 sec bins. Red curve is a Poisson curve with rate = median count rate of data. |
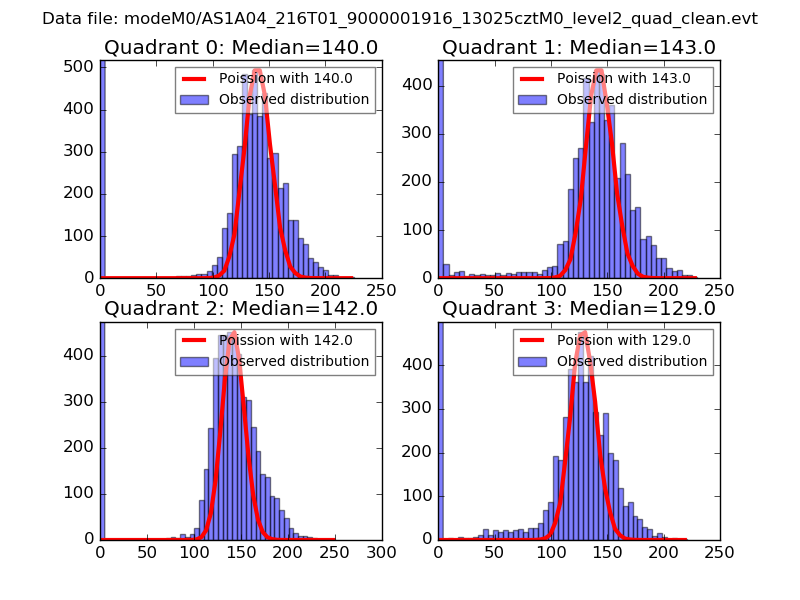 |
 |
| Quadrant-wise count rates Data is divided into 100 sec bins |
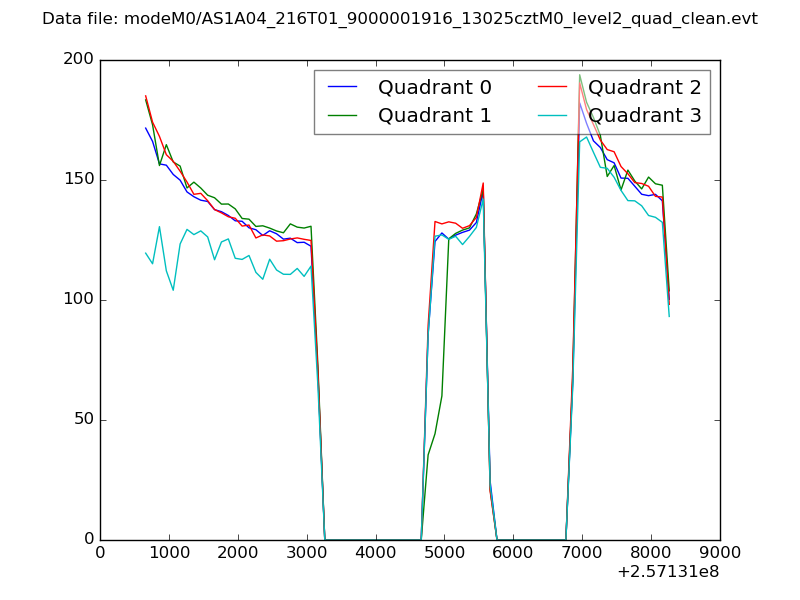 |
|
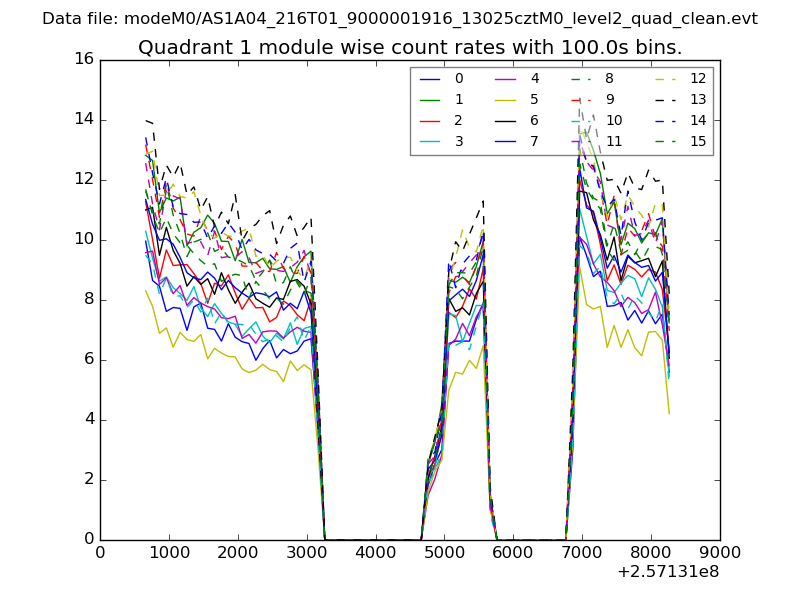
| Module-wise count rates for Quadrant A Data is divided into 100 sec bins |
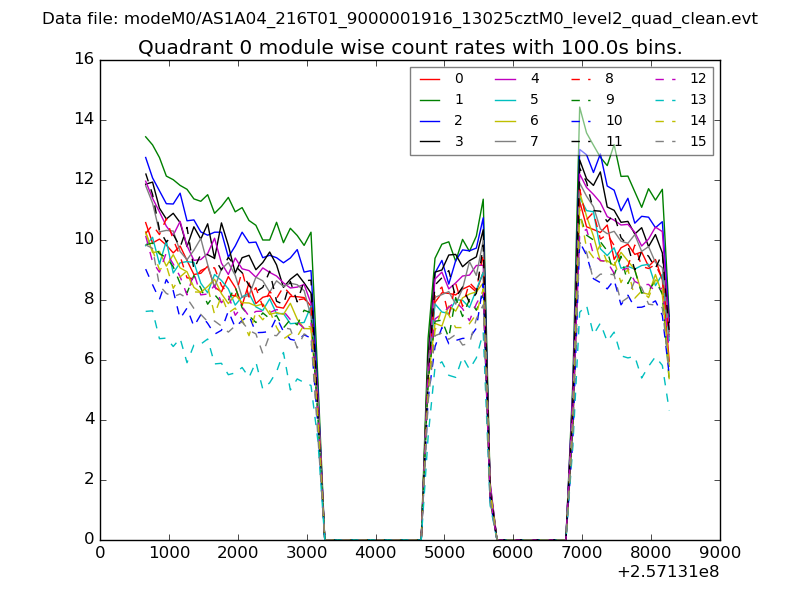 |
 |
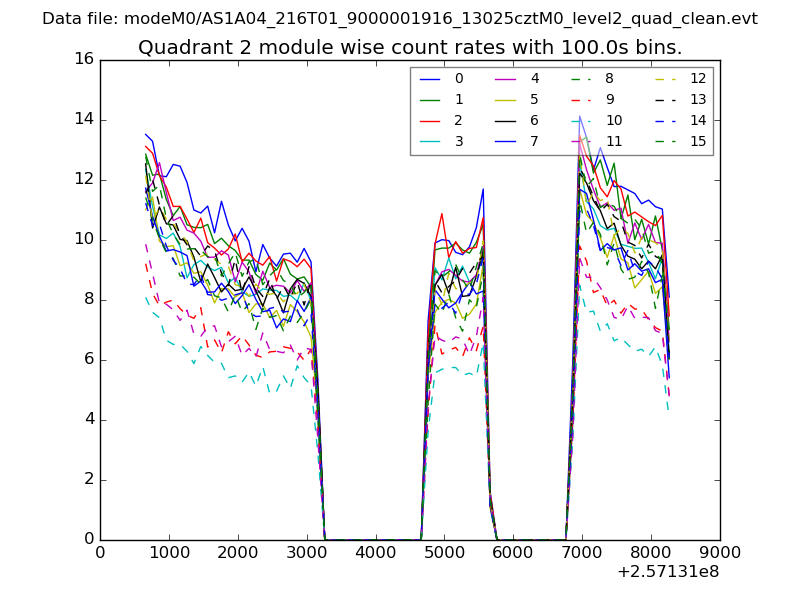
| Module-wise count rates for Quadrant B Data is divided into 100 sec bins |
 |
 |
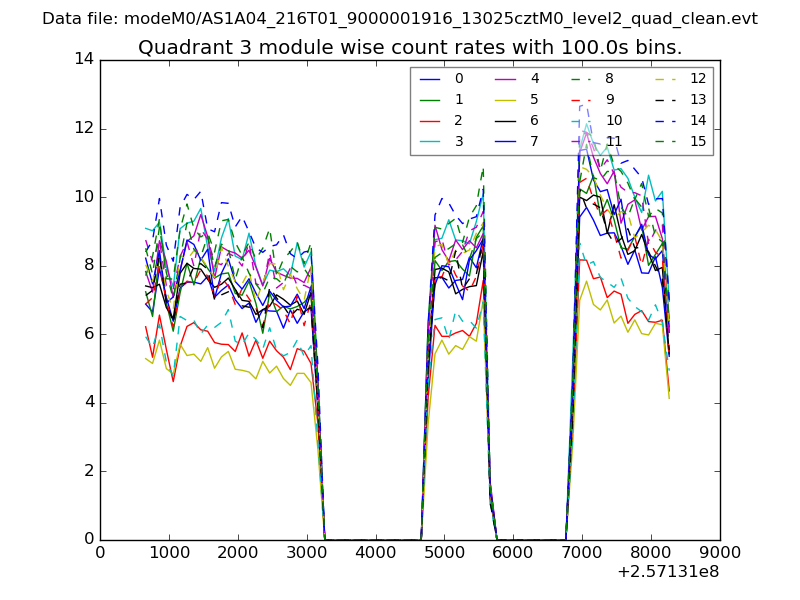
| Module-wise count rates for Quadrant C Data is divided into 100 sec bins |
 |
 |
| Module-wise count rates for Quadrant D Data is divided into 100 sec bins |
 |
 |
| Parameter | Plot |
|---|---|
| CZT HV Monitor | 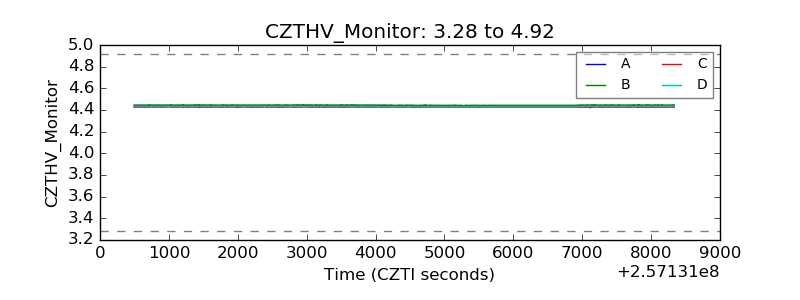 |
| D_VDD | 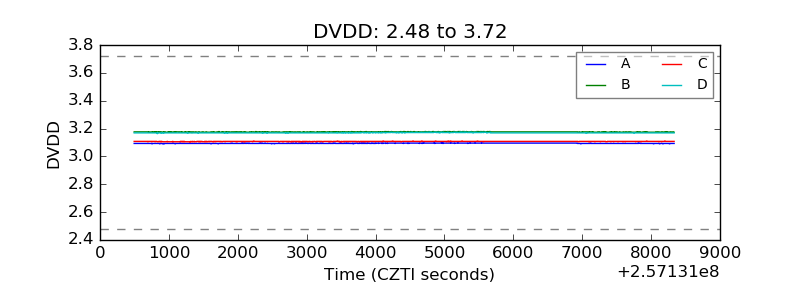 |
| Temperature 1 | 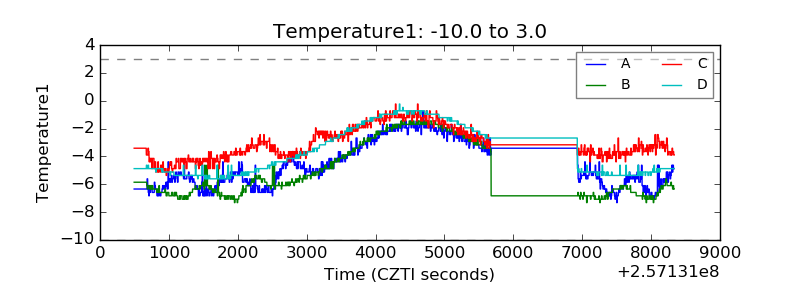 |
| Veto HV Monitor | 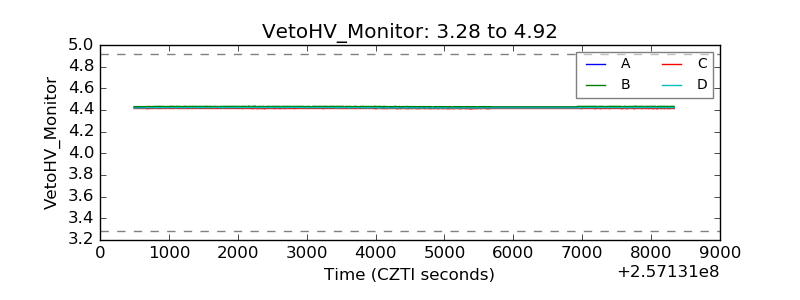 |
| Veto LLD |  |
| Alpha Counter | 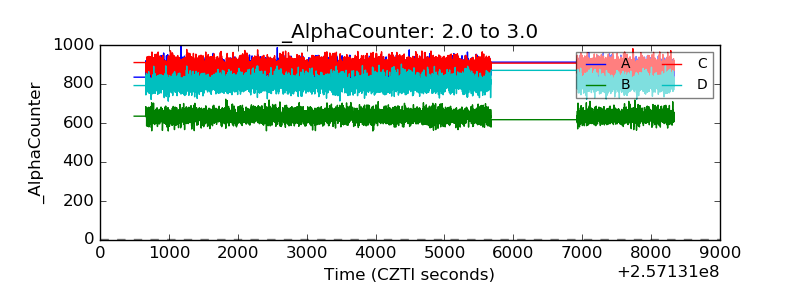 |
| _CPM_Rate | 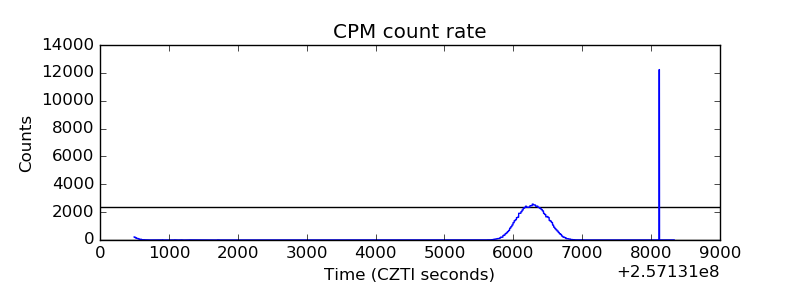 |
| CZT Counter | 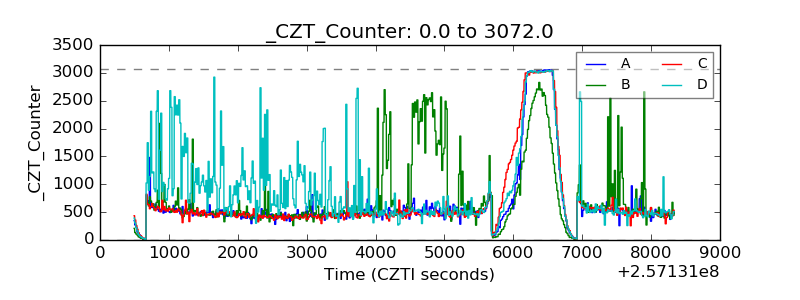 |
| +2.5 Volts monitor |  |
| +5 Volts monitor | 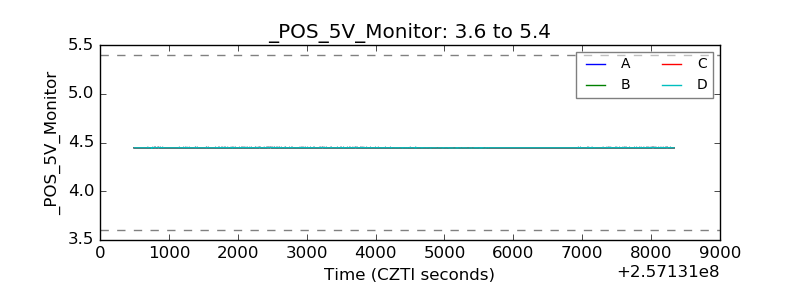 |
| _ROLL_ROT | 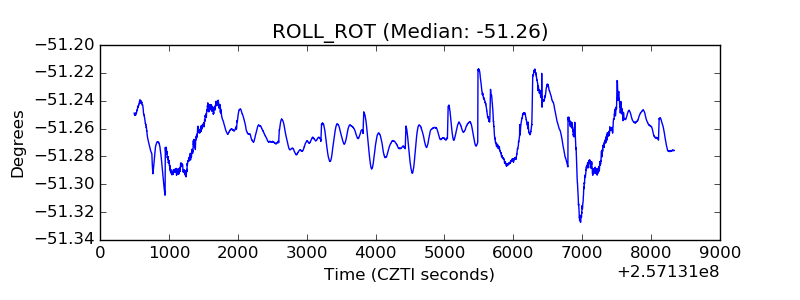 |
| _Roll_DEC | 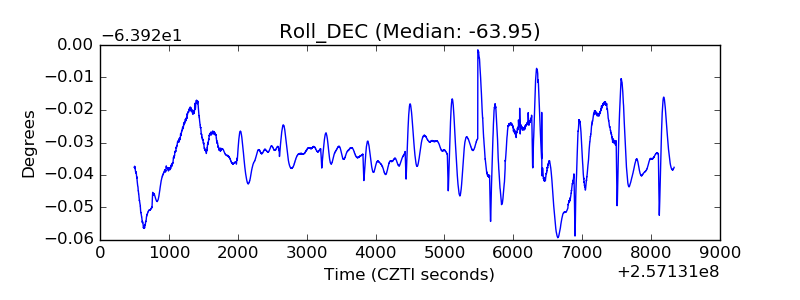 |
| _Roll_RA | 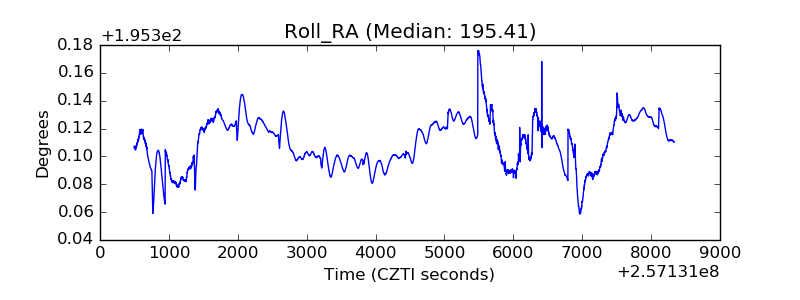 |
| Veto Counter | 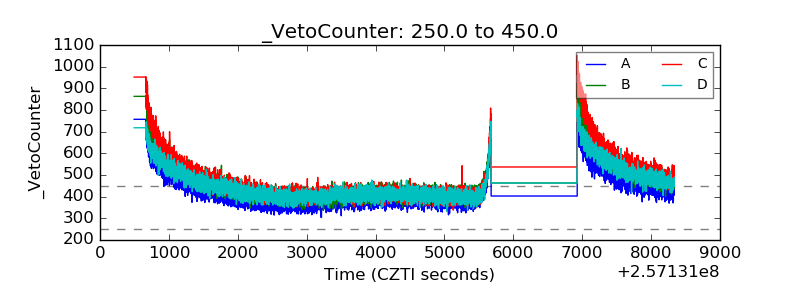 |