| Param | Original file | Final file |
|---|---|---|
| Filename | modeM0/AS1A04_216T01_9000001916_13027cztM0_level2.evt | modeM0/AS1A04_216T01_9000001916_13027cztM0_level2_quad_clean.evt |
| Size (bytes) | 482,788,800 | 90,924,480 |
| Size | 460.4 MB | 86.7 MB |
| Events in quadrant A | 3,137,731 | 606,917 |
| Events in quadrant B | 3,726,776 | 575,728 |
| Events in quadrant C | 2,835,602 | 619,447 |
| Events in quadrant D | 4,526,785 | 545,520 |
| Mode M9 | |||
|---|---|---|---|
| Quadrant | BADHDUFLAG | Total packets | Discarded packets |
| A | 0 | 13 | 0 |
| B | 0 | 13 | 0 |
| C | 0 | 13 | 0 |
| D | 0 | 13 | 0 |
| Mode SS | |||
|---|---|---|---|
| Quadrant | BADHDUFLAG | Total packets | Discarded packets |
| A | 0 | 118 | 0 |
| B | 0 | 118 | 0 |
| C | 0 | 118 | 0 |
| D | 0 | 118 | 0 |
| Mode M0 | |||
|---|---|---|---|
| Quadrant | BADHDUFLAG | Total packets | Discarded packets |
| A | 0 | 12770 | 2 |
| B | 0 | 14583 | 1 |
| C | 0 | 11951 | 1 |
| D | 0 | 17132 | 1 |
| Quadrant | Total seconds | Saturated seconds | Saturation percentage |
|---|---|---|---|
| A | 5804 | 66 | 1.137147% |
| B | 5804 | 526 | 9.062715% |
| C | 5804 | 36 | 0.620262% |
| D | 5804 | 533 | 9.183322% |
Noise dominated data is calculated using 1-second bins in cleaned event files. If a bin has >2000 counts, and if more than 50% of those come from <1% of pixels, then it is considered to be noise-dominated and hence unusable.
| Quadrant | # 1 sec bins | Bins with >0 counts | Bins with >2000 counts | High rate bins dominated by noise | Noise dominated (total time) | Noise dominated (detector-on time) | Marked lightcurve |
|---|---|---|---|---|---|---|---|
| A | 7110 | 5806 | 15 | 15 | 0.21% | 0.26% | 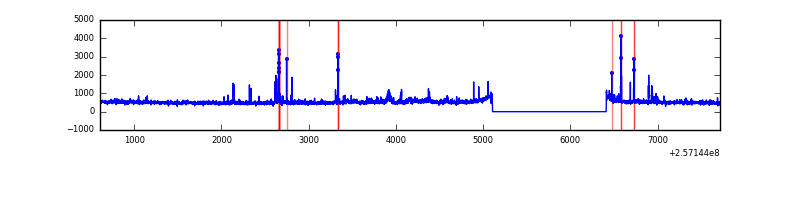 |
| B | 7110 | 5806 | 242 | 242 | 3.40% | 4.17% | 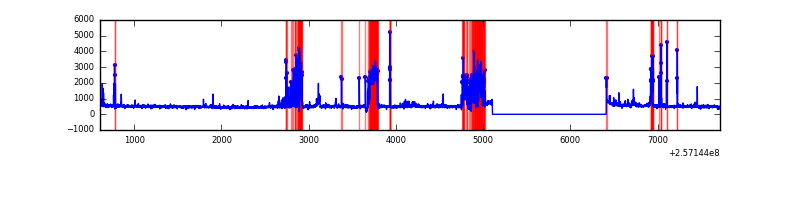 |
| C | 7110 | 5806 | 0 | 0 | 0.00% | 0.00% | 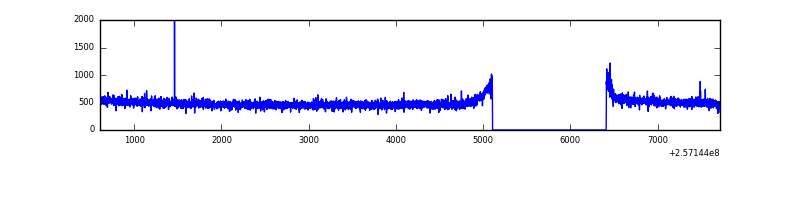 |
| D | 7110 | 5806 | 398 | 398 | 5.60% | 6.85% | 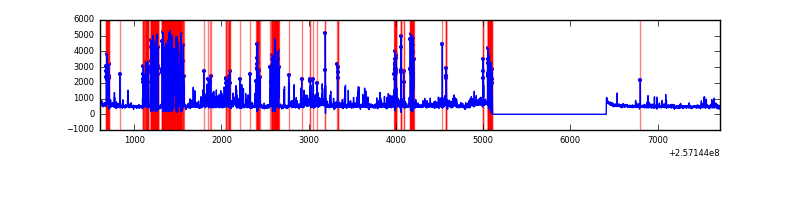 |
Top three noisy pixels from each quadrant. If the there are fewer than three noisy pixels in the level2.evt file, extra rows are filled as -1
| Pixel properties | Quadrant properties | ||||||
|---|---|---|---|---|---|---|---|
| Quadrant | DetID | PixID | Counts | Sigma | Mean | Median | Sigma |
| A | 12 | 189 | 102482 | 707.39 | 724 | 711 | 143.9 |
| A | 15 | 223 | 96724 | 667.37 | 724 | 711 | 143.9 |
| A | 15 | 239 | 43811 | 299.58 | 724 | 711 | 143.9 |
| B | 4 | 239 | 942366 | 7496.34 | 680 | 665 | 125.6 |
| B | 3 | 64 | 46161 | 362.17 | 680 | 665 | 125.6 |
| B | 3 | 209 | 24289 | 188.06 | 680 | 665 | 125.6 |
| C | 12 | 4 | 6581 | 35.41 | 724 | 730 | 165.2 |
| C | 13 | 61 | 5331 | 27.84 | 724 | 730 | 165.2 |
| C | 14 | 234 | 5054 | 26.17 | 724 | 730 | 165.2 |
| D | 1 | 52 | 1527620 | 9466.62 | 678 | 661 | 161.3 |
| D | 8 | 195 | 391187 | 2421.13 | 678 | 661 | 161.3 |
| D | 14 | 34 | 22778 | 137.12 | 678 | 661 | 161.3 |
Histogram calculated using DETX and DETY for each event in the final _common_clean file
| Quadrant A | 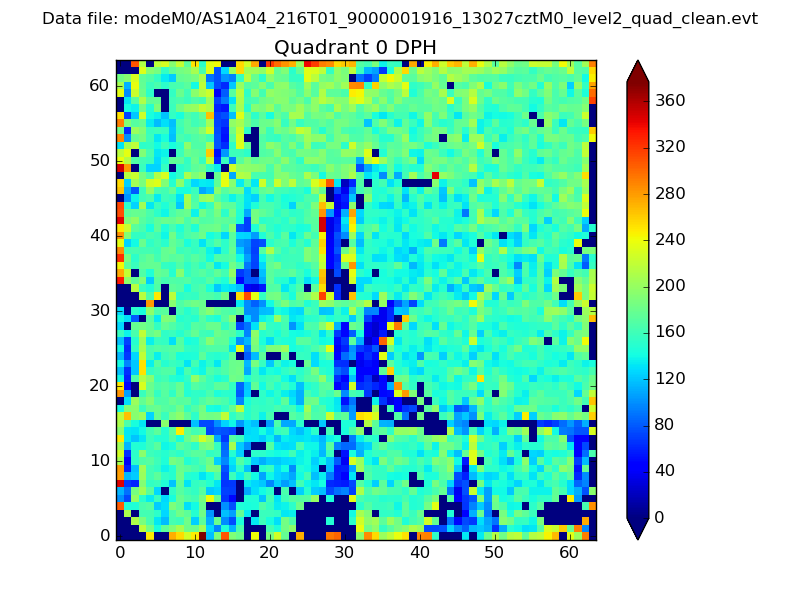 |
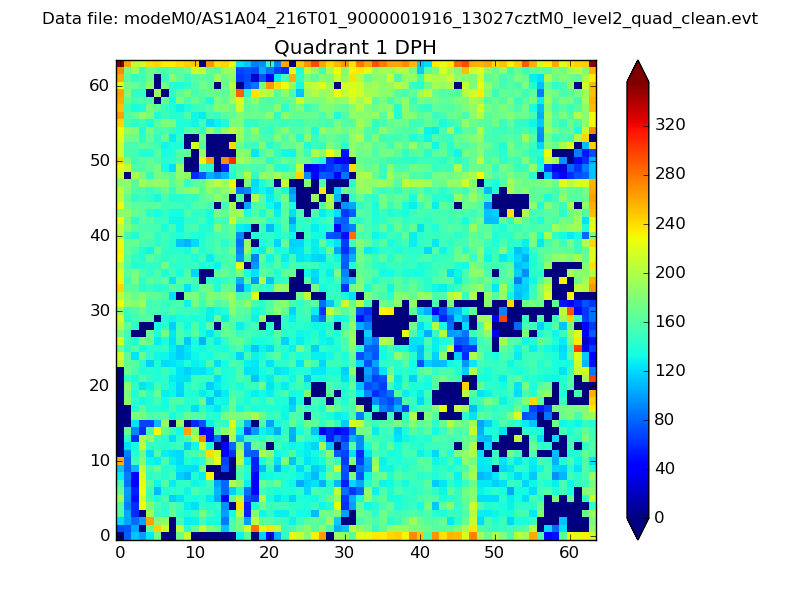 |
Quadrant B |
|---|---|---|---|
| Quadrant D | 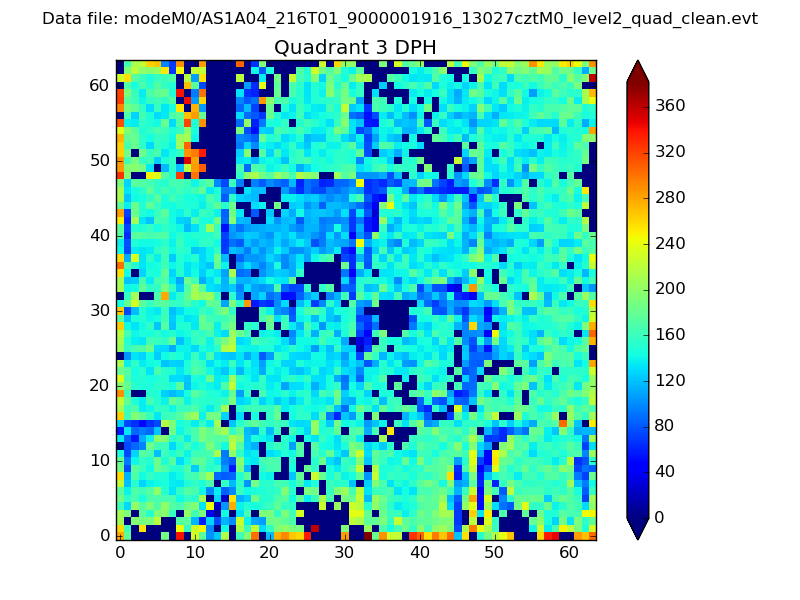 |
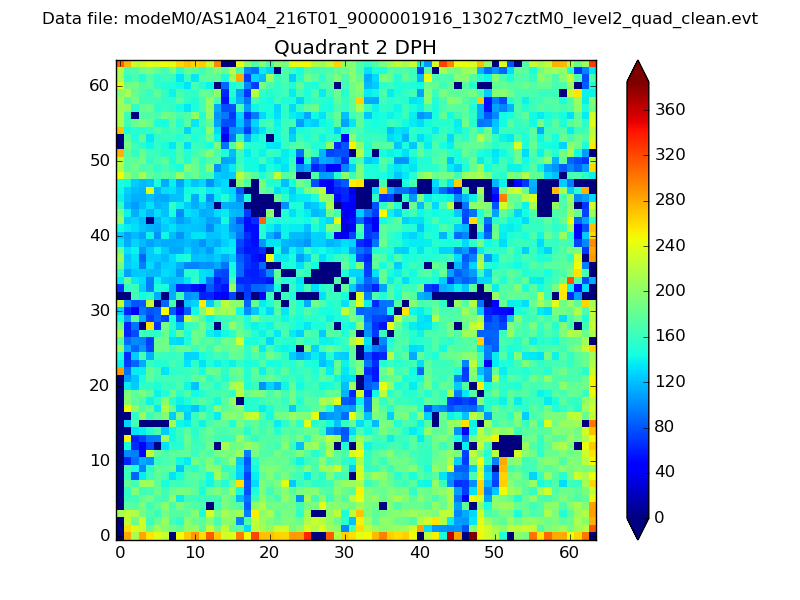 |
Quadrant C |
| Plot type | Count rate plots | Images |
|---|---|---|
| Comparison with Poisson distribution Blue bars denote a histogram of data divided into 1 sec bins. Red curve is a Poisson curve with rate = median count rate of data. |
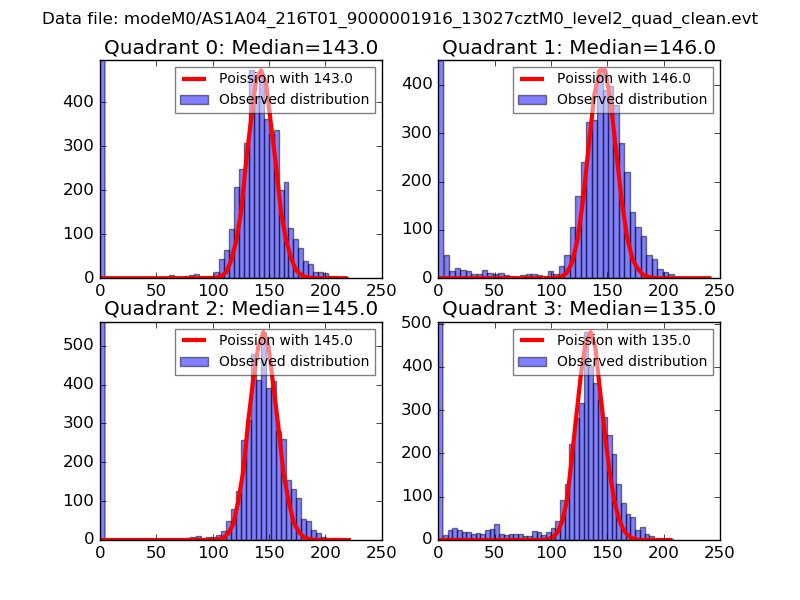 |
 |
| Quadrant-wise count rates Data is divided into 100 sec bins |
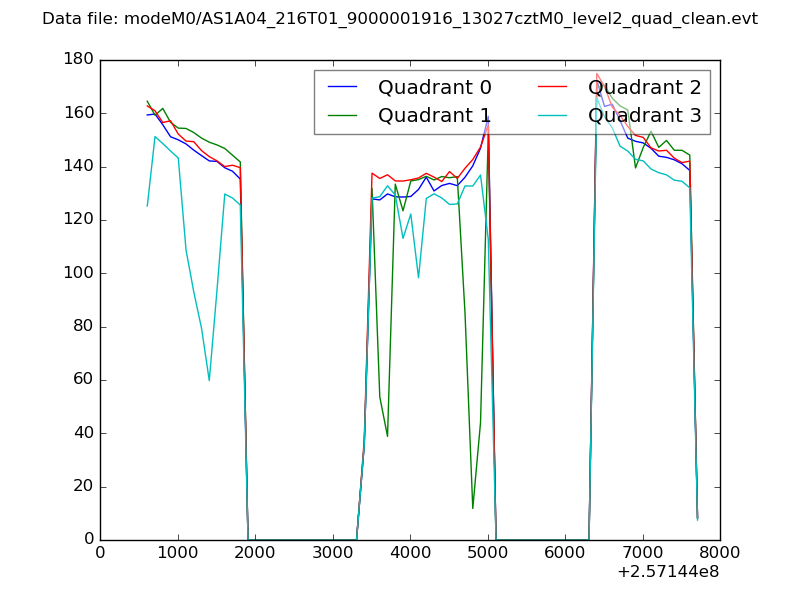 |
|
| Module-wise count rates for Quadrant A Data is divided into 100 sec bins |
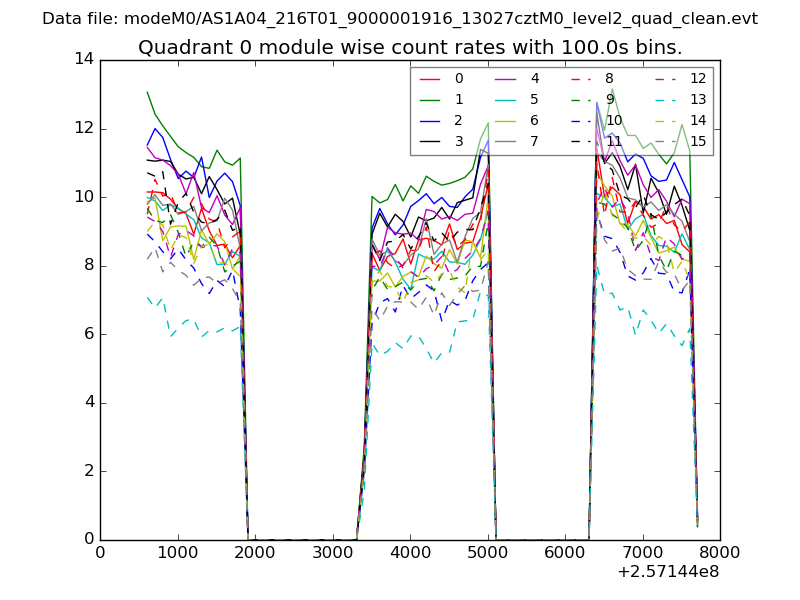 |
 |
| Module-wise count rates for Quadrant B Data is divided into 100 sec bins |
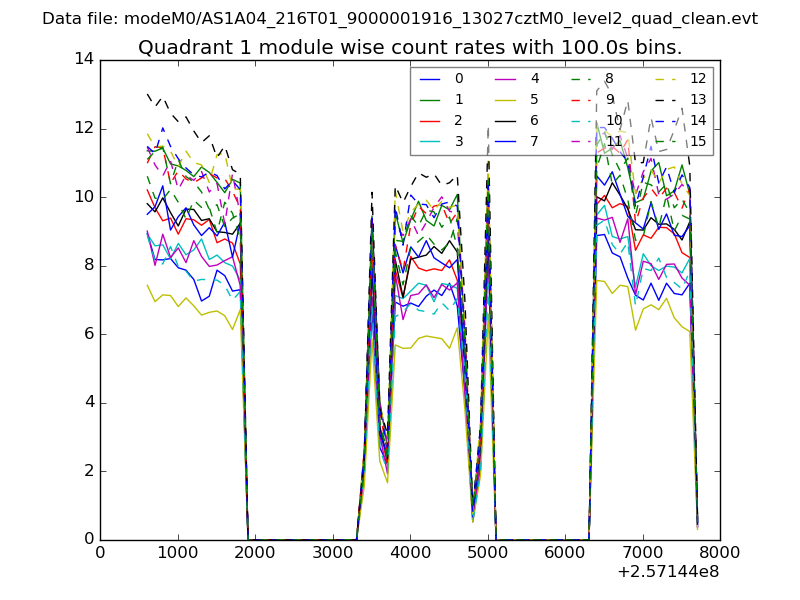 |
 |
| Module-wise count rates for Quadrant C Data is divided into 100 sec bins |
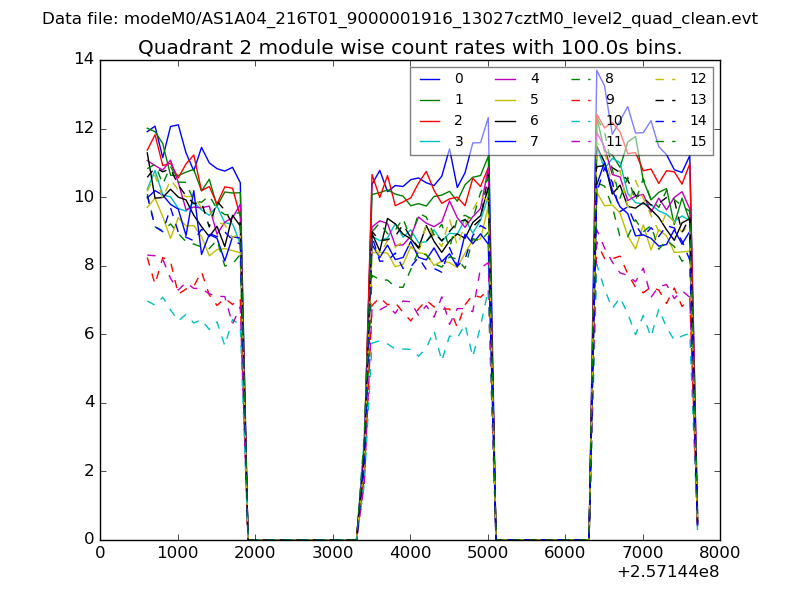 |
 |
| Module-wise count rates for Quadrant D Data is divided into 100 sec bins |
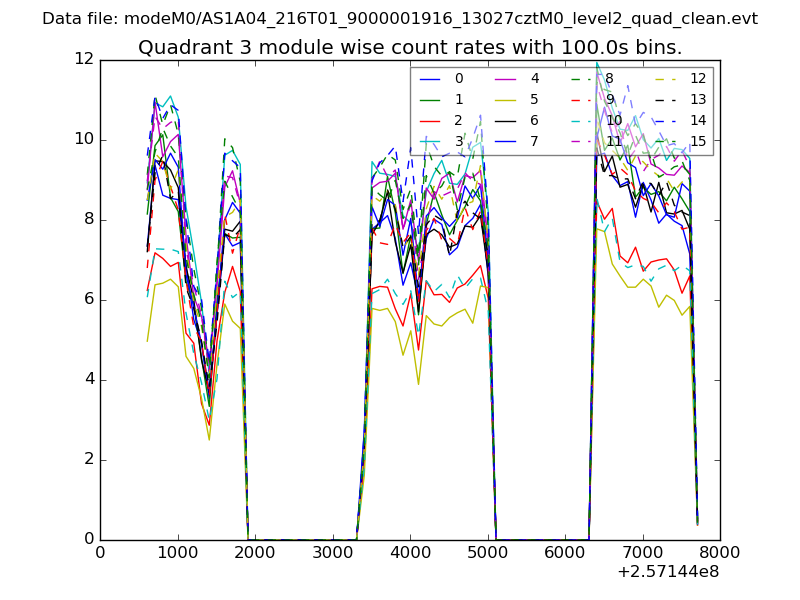 |
 |
| Parameter | Plot |
|---|---|
| CZT HV Monitor | 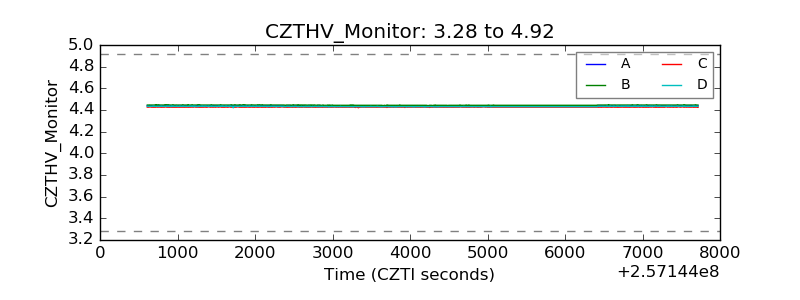 |
| D_VDD | 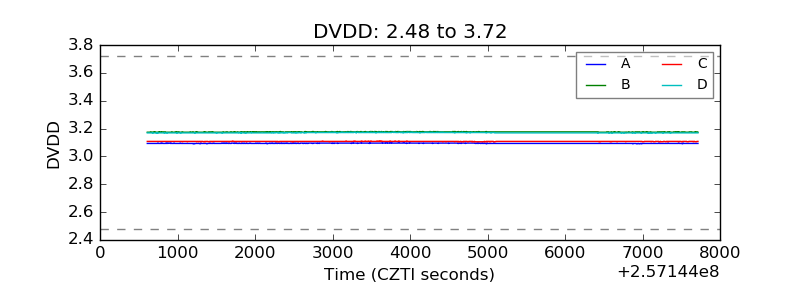 |
| Temperature 1 | 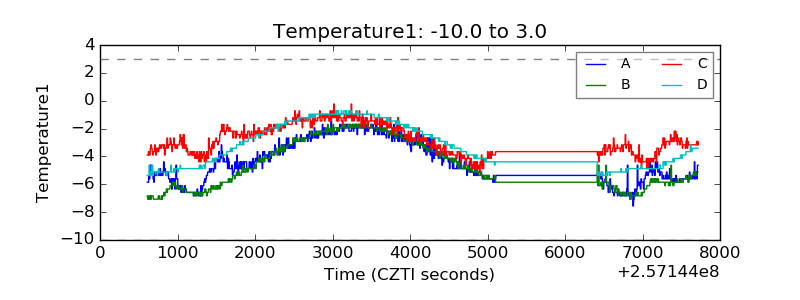 |
| Veto HV Monitor | 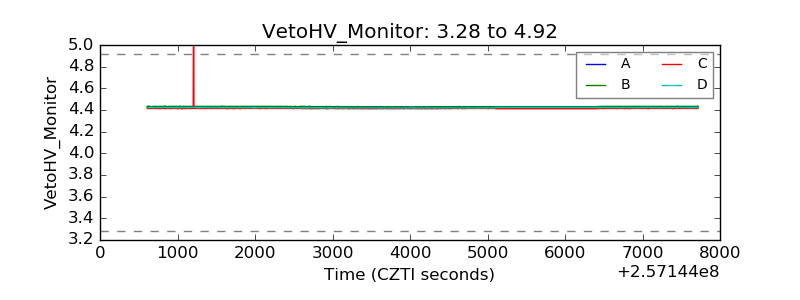 |
| Veto LLD | 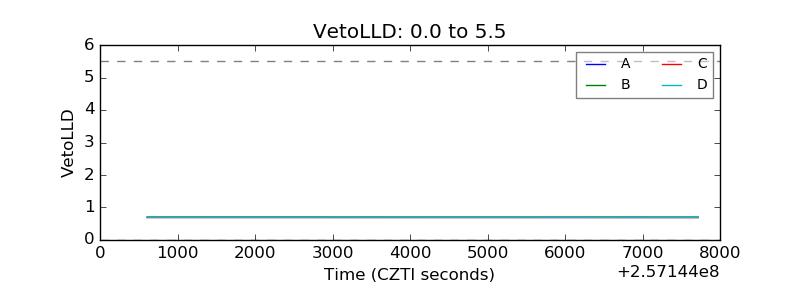 |
| Alpha Counter | 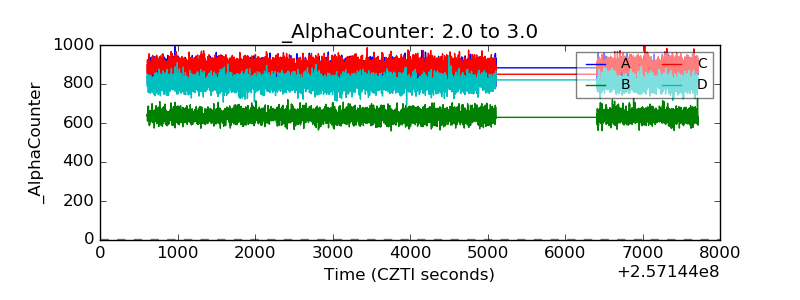 |
| _CPM_Rate | 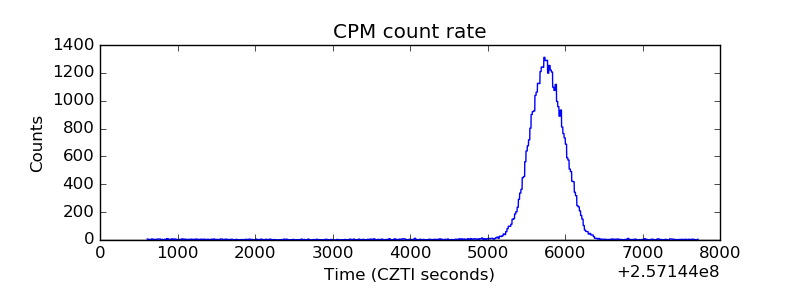 |
| CZT Counter | 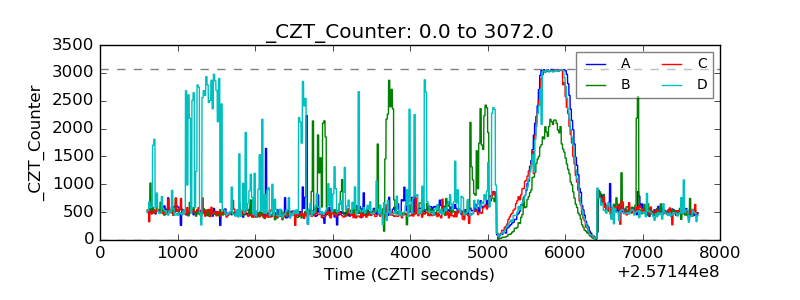 |
| +2.5 Volts monitor |  |
| +5 Volts monitor |  |
| _ROLL_ROT | 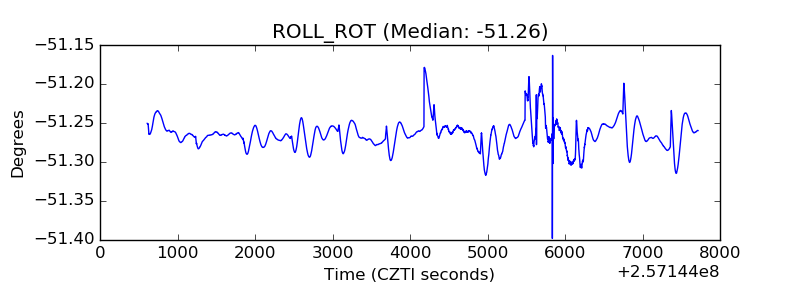 |
| _Roll_DEC | 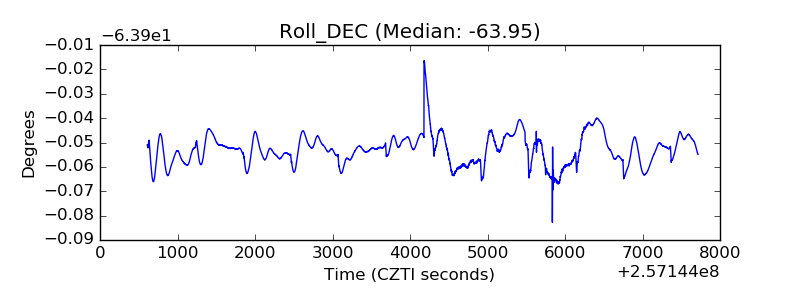 |
| _Roll_RA | 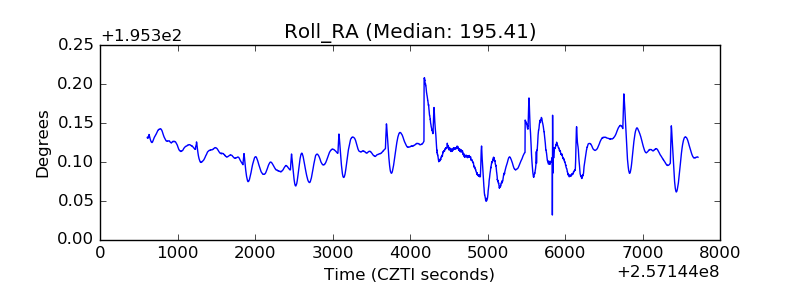 |
| Veto Counter | 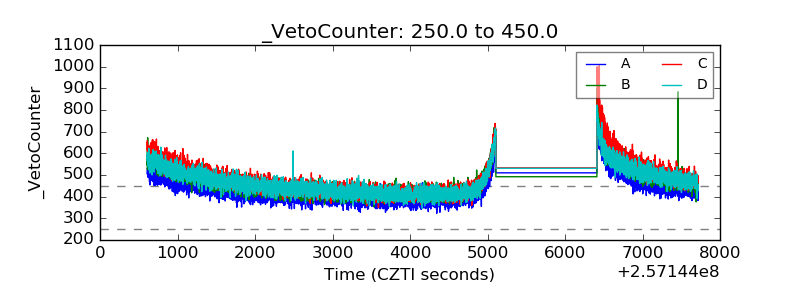 |