| Param | Original file | Final file |
|---|---|---|
| Filename | modeM0/AS1A04_216T01_9000001916_13028cztM0_level2.evt | modeM0/AS1A04_216T01_9000001916_13028cztM0_level2_quad_clean.evt |
| Size (bytes) | 544,101,120 | 92,203,200 |
| Size | 518.9 MB | 87.9 MB |
| Events in quadrant A | 3,456,439 | 617,644 |
| Events in quadrant B | 6,383,615 | 517,144 |
| Events in quadrant C | 3,035,823 | 623,673 |
| Events in quadrant D | 3,172,889 | 592,107 |
| Mode M9 | |||
|---|---|---|---|
| Quadrant | BADHDUFLAG | Total packets | Discarded packets |
| A | 0 | 11 | 0 |
| B | 0 | 11 | 0 |
| C | 0 | 11 | 0 |
| D | 0 | 11 | 0 |
| Mode SS | |||
|---|---|---|---|
| Quadrant | BADHDUFLAG | Total packets | Discarded packets |
| A | 0 | 130 | 0 |
| B | 0 | 130 | 0 |
| C | 0 | 130 | 0 |
| D | 0 | 130 | 0 |
| Mode M0 | |||
|---|---|---|---|
| Quadrant | BADHDUFLAG | Total packets | Discarded packets |
| A | 0 | 14112 | 3 |
| B | 0 | 22995 | 2 |
| C | 0 | 13050 | 2 |
| D | 0 | 13447 | 2 |
| Quadrant | Total seconds | Saturated seconds | Saturation percentage |
|---|---|---|---|
| A | 6314 | 143 | 2.264808% |
| B | 6314 | 1583 | 25.071270% |
| C | 6314 | 71 | 1.124485% |
| D | 6314 | 67 | 1.061134% |
Noise dominated data is calculated using 1-second bins in cleaned event files. If a bin has >2000 counts, and if more than 50% of those come from <1% of pixels, then it is considered to be noise-dominated and hence unusable.
| Quadrant | # 1 sec bins | Bins with >0 counts | Bins with >2000 counts | High rate bins dominated by noise | Noise dominated (total time) | Noise dominated (detector-on time) | Marked lightcurve |
|---|---|---|---|---|---|---|---|
| A | 7480 | 6316 | 41 | 41 | 0.55% | 0.65% | 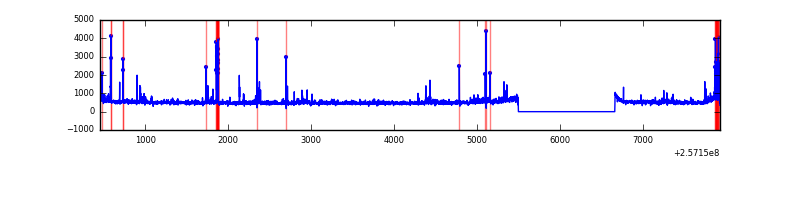 |
| B | 7480 | 6316 | 1031 | 1031 | 13.78% | 16.32% | 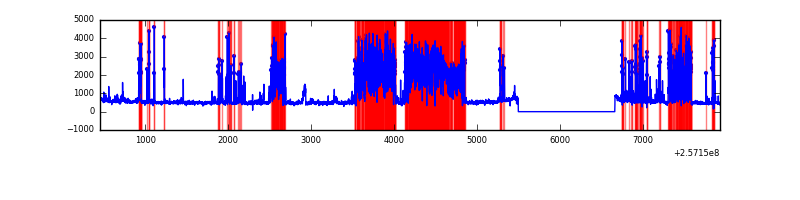 |
| C | 7480 | 6316 | 2 | 2 | 0.03% | 0.03% | 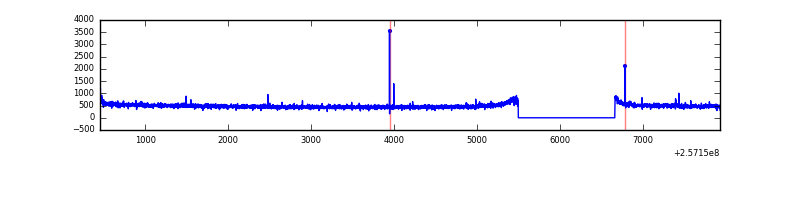 |
| D | 7480 | 6316 | 2 | 2 | 0.03% | 0.03% | 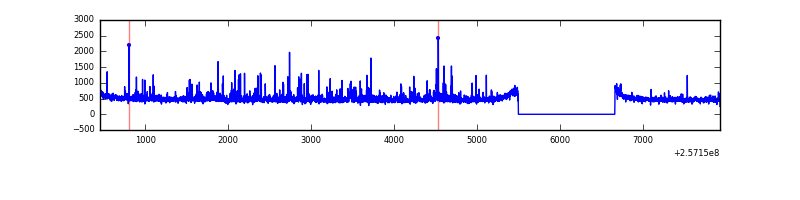 |
Top three noisy pixels from each quadrant. If the there are fewer than three noisy pixels in the level2.evt file, extra rows are filled as -1
| Pixel properties | Quadrant properties | ||||||
|---|---|---|---|---|---|---|---|
| Quadrant | DetID | PixID | Counts | Sigma | Mean | Median | Sigma |
| A | 15 | 223 | 177427 | 1132.72 | 778 | 761 | 156.0 |
| A | 12 | 189 | 125714 | 801.15 | 778 | 761 | 156.0 |
| A | 15 | 239 | 82161 | 521.91 | 778 | 761 | 156.0 |
| B | 4 | 239 | 3521669 | 28190.15 | 676 | 660 | 124.9 |
| B | 3 | 64 | 113800 | 905.83 | 676 | 660 | 124.9 |
| B | 0 | 230 | 26736 | 208.77 | 676 | 660 | 124.9 |
| C | 14 | 234 | 13480 | 71.77 | 772 | 776 | 177.0 |
| C | 12 | 4 | 5994 | 29.48 | 772 | 776 | 177.0 |
| C | 13 | 61 | 5609 | 27.3 | 772 | 776 | 177.0 |
| D | 8 | 195 | 163198 | 892.25 | 765 | 744 | 182.1 |
| D | 1 | 52 | 87013 | 473.82 | 765 | 744 | 182.1 |
| D | 2 | 234 | 23821 | 126.75 | 765 | 744 | 182.1 |
Histogram calculated using DETX and DETY for each event in the final _common_clean file
| Quadrant A | 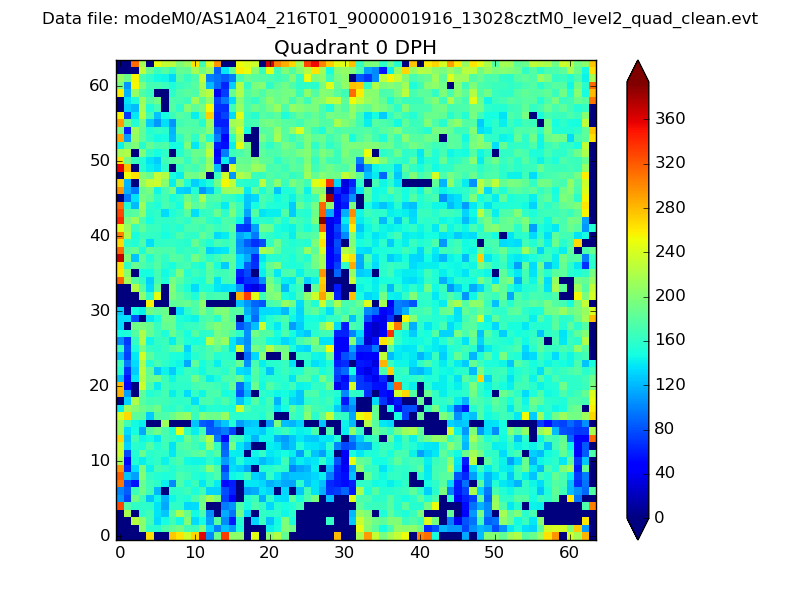 |
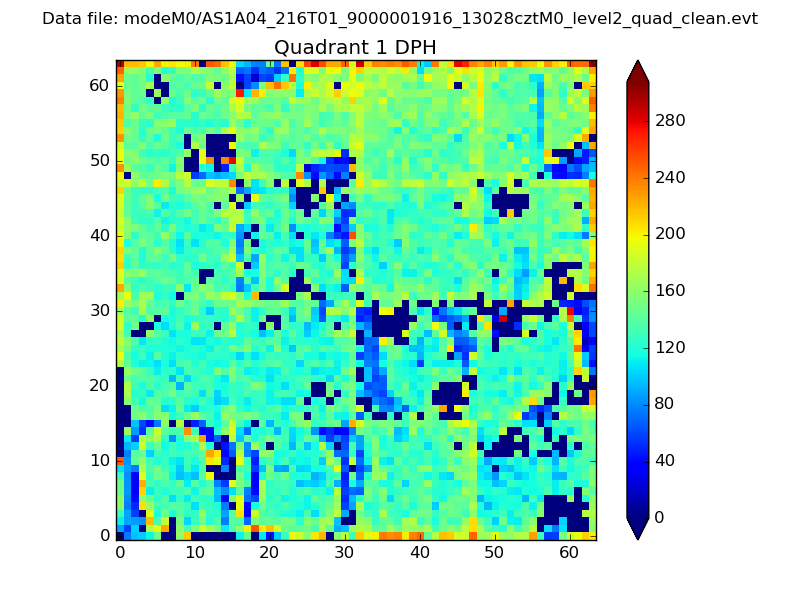 |
Quadrant B |
|---|---|---|---|
| Quadrant D | 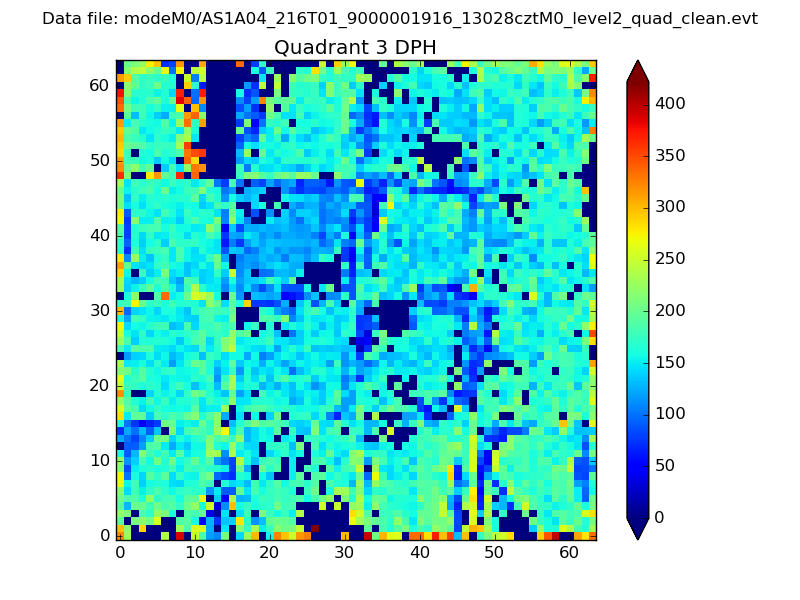 |
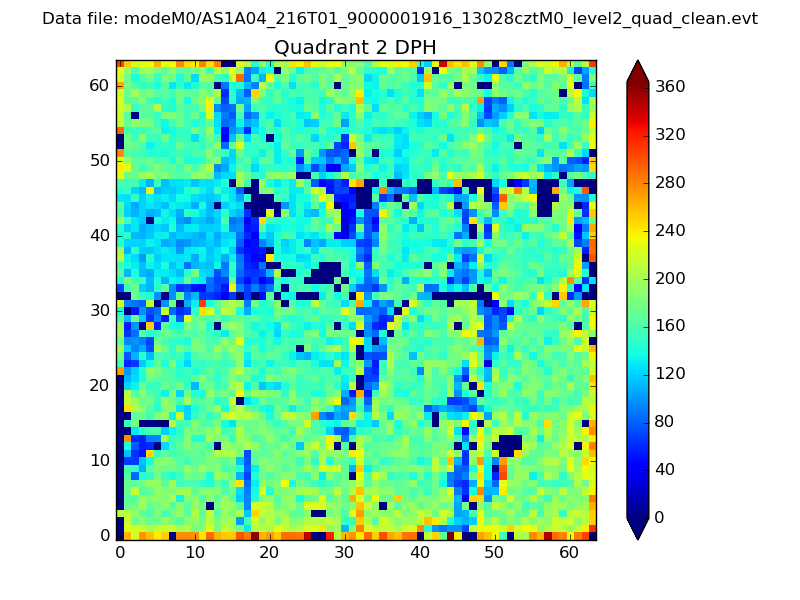 |
Quadrant C |
| Plot type | Count rate plots | Images |
|---|---|---|
| Comparison with Poisson distribution Blue bars denote a histogram of data divided into 1 sec bins. Red curve is a Poisson curve with rate = median count rate of data. |
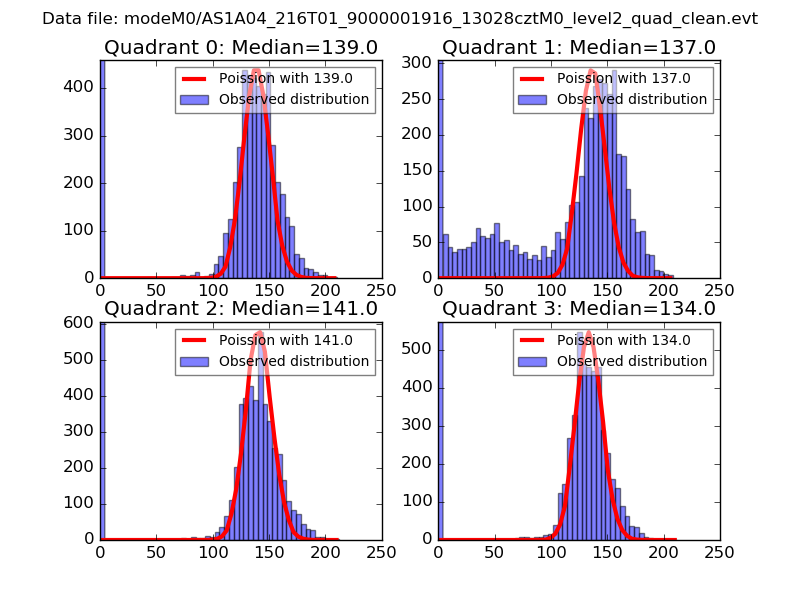 |
 |
| Quadrant-wise count rates Data is divided into 100 sec bins |
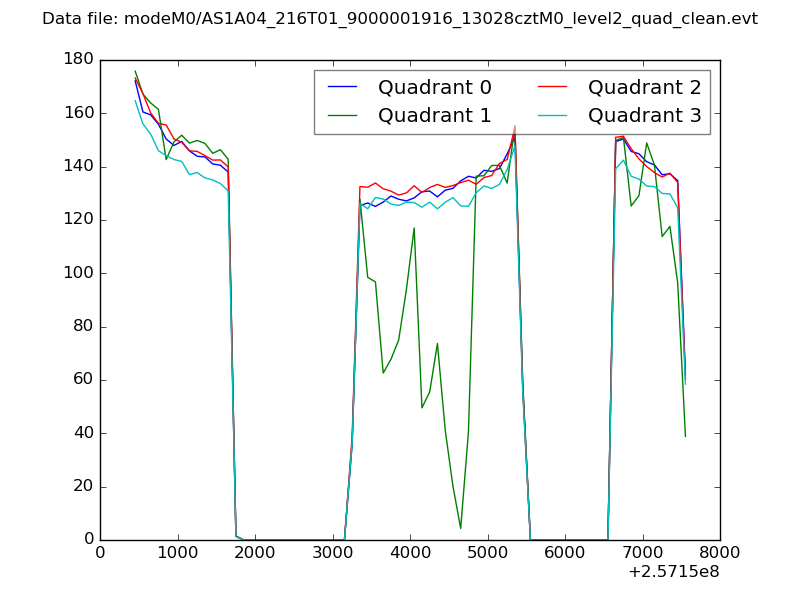 |
|
| Module-wise count rates for Quadrant A Data is divided into 100 sec bins |
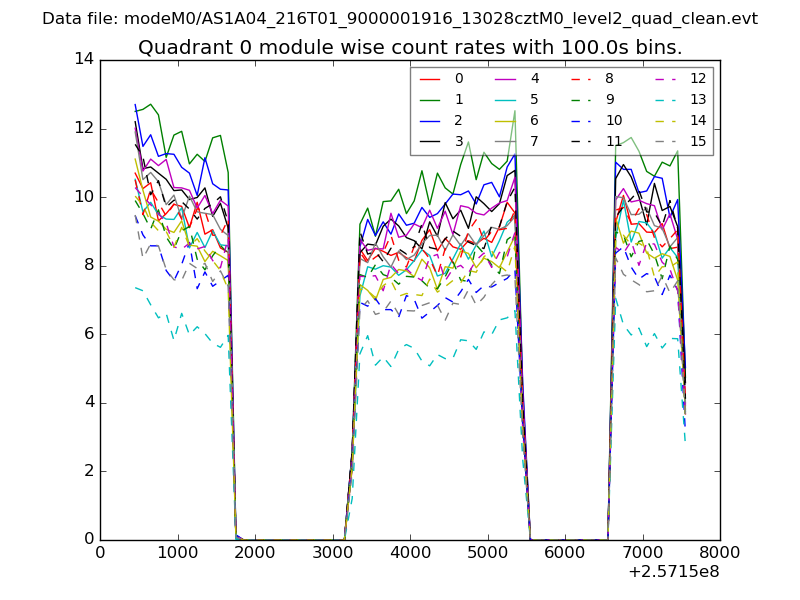 |
 |
| Module-wise count rates for Quadrant B Data is divided into 100 sec bins |
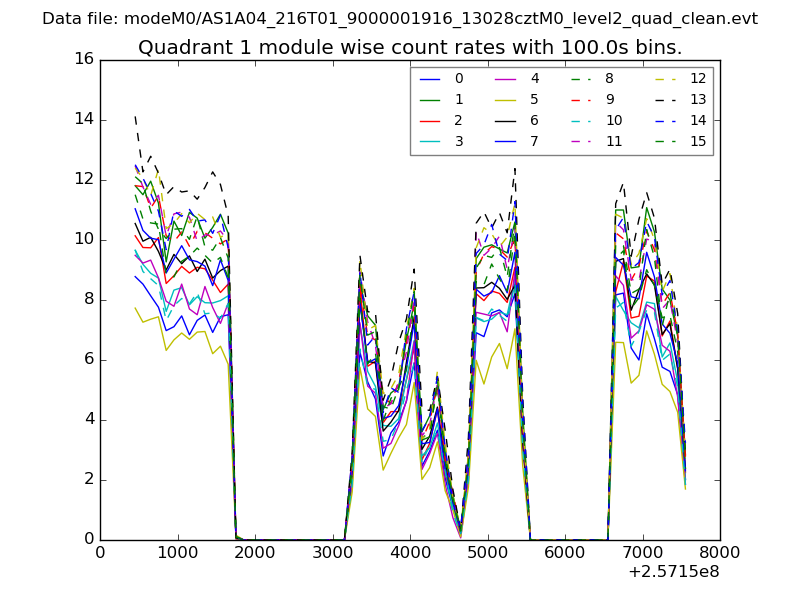 |
 |
| Module-wise count rates for Quadrant C Data is divided into 100 sec bins |
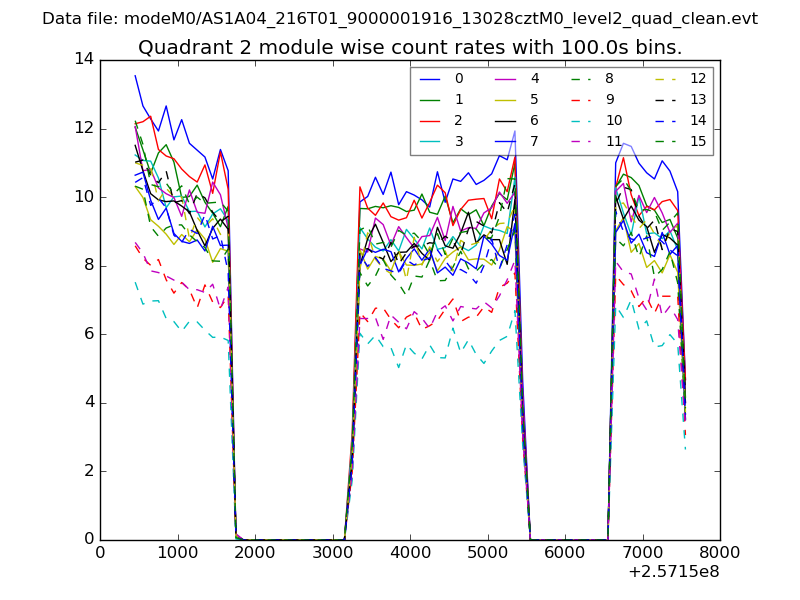 |
 |
| Module-wise count rates for Quadrant D Data is divided into 100 sec bins |
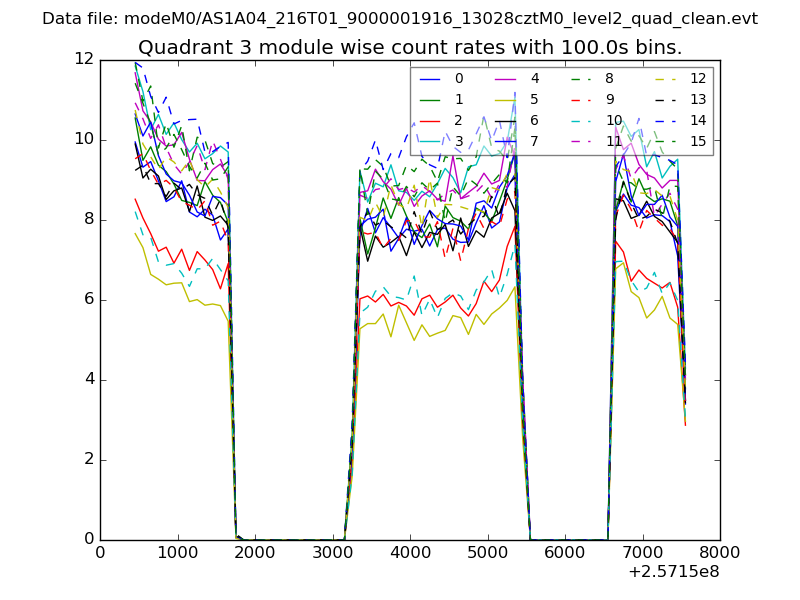 |
 |
| Parameter | Plot |
|---|---|
| CZT HV Monitor | 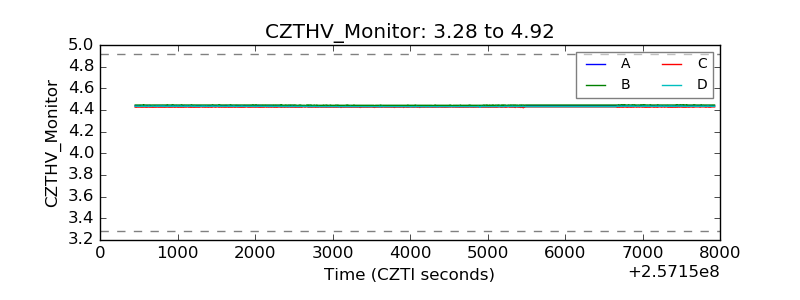 |
| D_VDD | 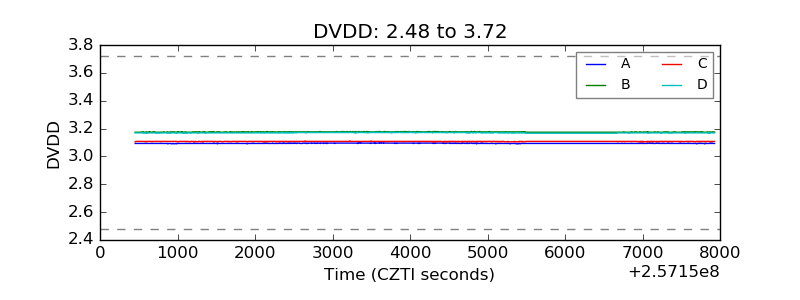 |
| Temperature 1 | 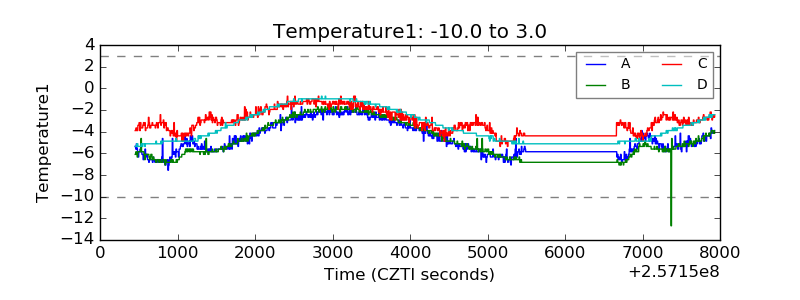 |
| Veto HV Monitor | 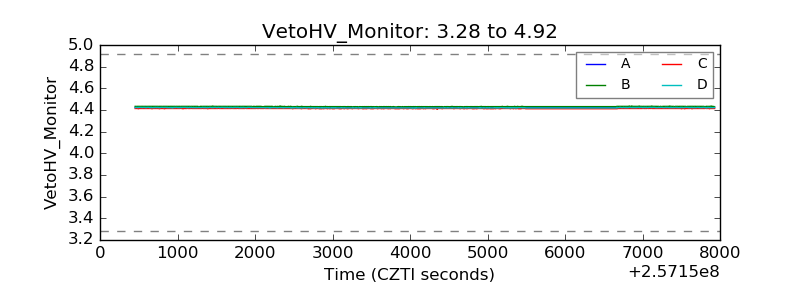 |
| Veto LLD | 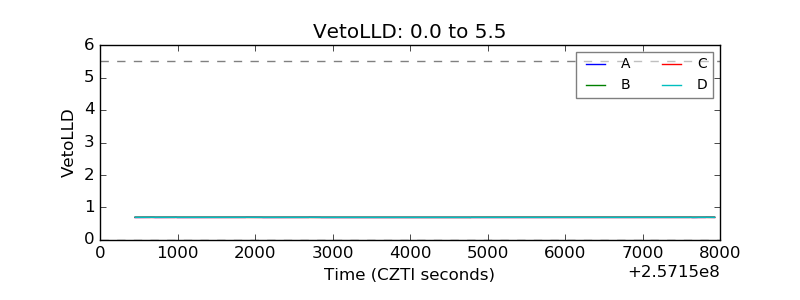 |
| Alpha Counter | 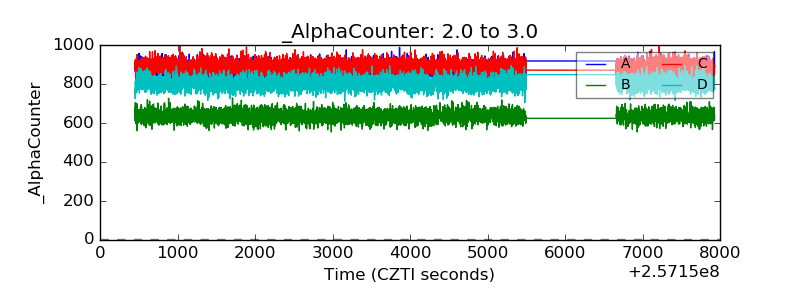 |
| _CPM_Rate | 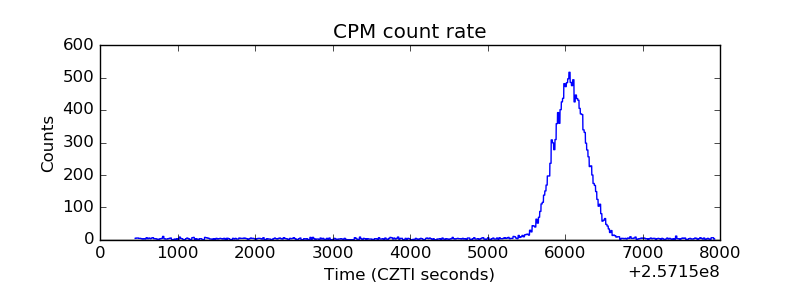 |
| CZT Counter | 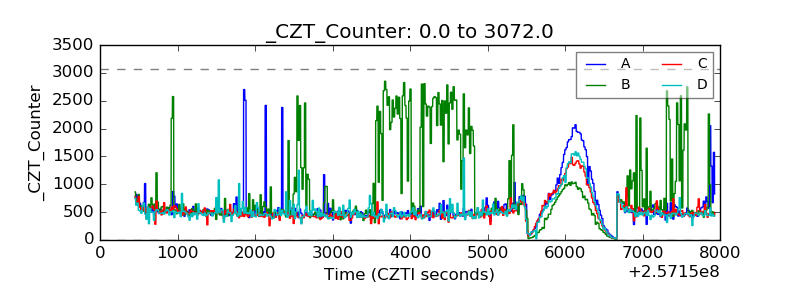 |
| +2.5 Volts monitor |  |
| +5 Volts monitor |  |
| _ROLL_ROT | 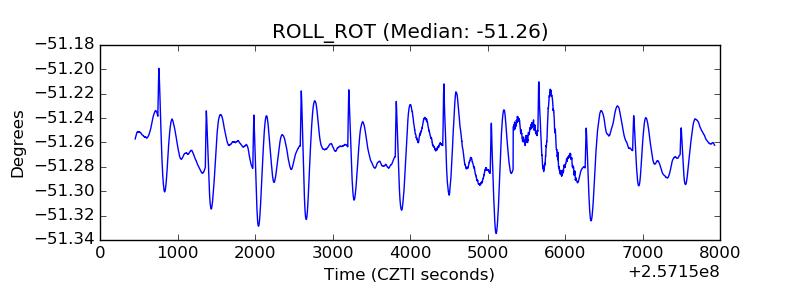 |
| _Roll_DEC | 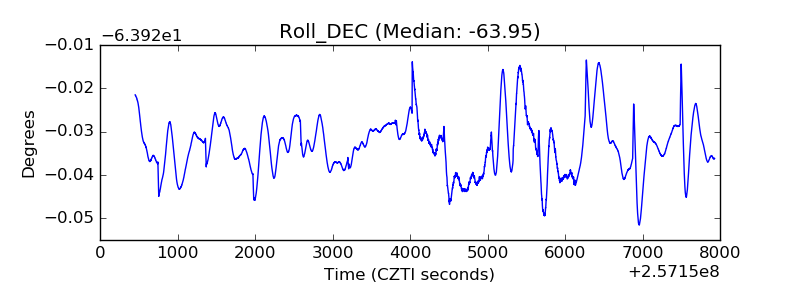 |
| _Roll_RA | 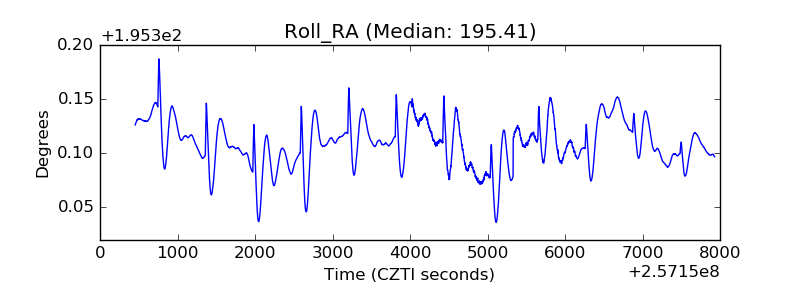 |
| Veto Counter | 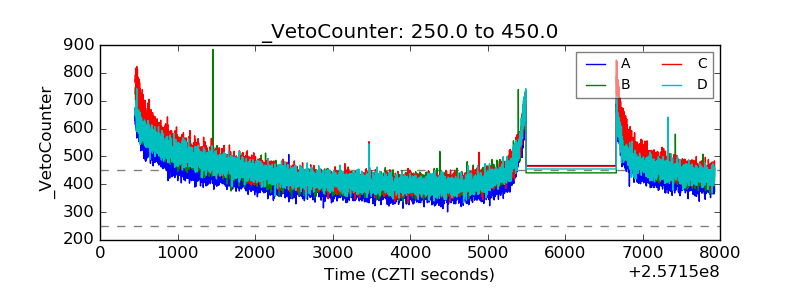 |