| Param | Original file | Final file |
|---|---|---|
| Filename | modeM0/AS1A04_216T01_9000001916_13030cztM0_level2.evt | modeM0/AS1A04_216T01_9000001916_13030cztM0_level2_quad_clean.evt |
| Size (bytes) | 617,423,040 | 84,389,760 |
| Size | 588.8 MB | 80.5 MB |
| Events in quadrant A | 3,737,362 | 552,589 |
| Events in quadrant B | 7,351,202 | 421,876 |
| Events in quadrant C | 3,295,079 | 558,663 |
| Events in quadrant D | 3,834,083 | 527,998 |
| Mode M9 | |||
|---|---|---|---|
| Quadrant | BADHDUFLAG | Total packets | Discarded packets |
| A | 0 | 8 | 0 |
| B | 0 | 8 | 0 |
| C | 0 | 8 | 0 |
| D | 0 | 9 | 0 |
| Mode SS | |||
|---|---|---|---|
| Quadrant | BADHDUFLAG | Total packets | Discarded packets |
| A | 0 | 144 | 0 |
| B | 0 | 144 | 0 |
| C | 0 | 144 | 0 |
| D | 0 | 144 | 0 |
| Mode M0 | |||
|---|---|---|---|
| Quadrant | BADHDUFLAG | Total packets | Discarded packets |
| A | 0 | 15631 | 3 |
| B | 0 | 26413 | 2 |
| C | 0 | 14757 | 2 |
| D | 0 | 16152 | 2 |
| Quadrant | Total seconds | Saturated seconds | Saturation percentage |
|---|---|---|---|
| A | 7084 | 262 | 3.698475% |
| B | 7084 | 2027 | 28.613778% |
| C | 7084 | 155 | 2.188029% |
| D | 7084 | 244 | 3.444382% |
Noise dominated data is calculated using 1-second bins in cleaned event files. If a bin has >2000 counts, and if more than 50% of those come from <1% of pixels, then it is considered to be noise-dominated and hence unusable.
| Quadrant | # 1 sec bins | Bins with >0 counts | Bins with >2000 counts | High rate bins dominated by noise | Noise dominated (total time) | Noise dominated (detector-on time) | Marked lightcurve |
|---|---|---|---|---|---|---|---|
| A | 7510 | 7086 | 50 | 50 | 0.67% | 0.71% | 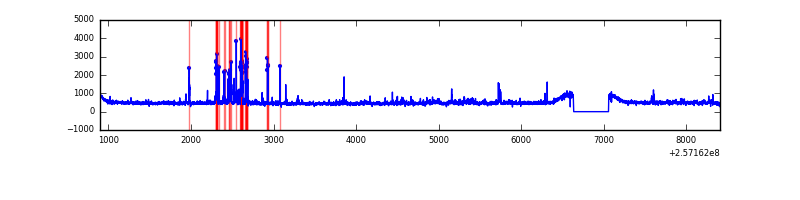 |
| B | 7510 | 7086 | 1282 | 1282 | 17.07% | 18.09% | 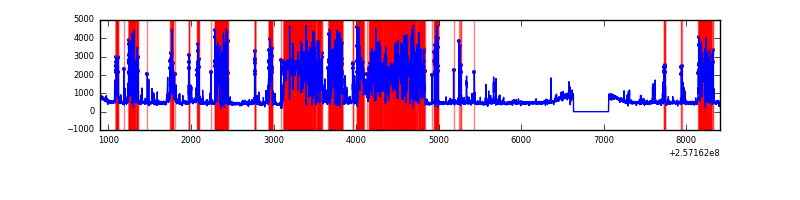 |
| C | 7510 | 7086 | 0 | 0 | 0.00% | 0.00% | 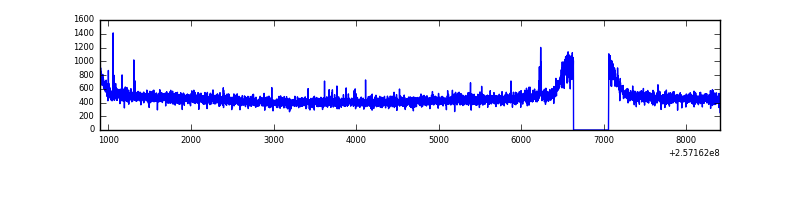 |
| D | 7510 | 7086 | 67 | 67 | 0.89% | 0.95% | 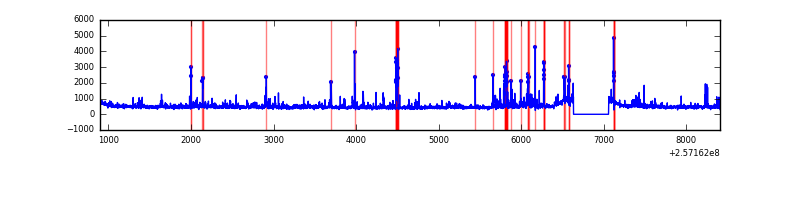 |
Top three noisy pixels from each quadrant. If the there are fewer than three noisy pixels in the level2.evt file, extra rows are filled as -1
| Pixel properties | Quadrant properties | ||||||
|---|---|---|---|---|---|---|---|
| Quadrant | DetID | PixID | Counts | Sigma | Mean | Median | Sigma |
| A | 15 | 223 | 172116 | 992.34 | 848 | 830 | 172.6 |
| A | 12 | 189 | 171095 | 986.42 | 848 | 830 | 172.6 |
| A | 15 | 239 | 59226 | 338.31 | 848 | 830 | 172.6 |
| B | 4 | 239 | 3557351 | 26132.82 | 713 | 692 | 136.1 |
| B | 3 | 64 | 818686 | 6010.27 | 713 | 692 | 136.1 |
| B | 4 | 173 | 89652 | 653.64 | 713 | 692 | 136.1 |
| C | 7 | 238 | 15507 | 75.46 | 838 | 839 | 194.4 |
| C | 13 | 61 | 6043 | 26.77 | 838 | 839 | 194.4 |
| C | 8 | 222 | 5187 | 22.37 | 838 | 839 | 194.4 |
| D | 1 | 52 | 539732 | 2702.65 | 829 | 803 | 199.4 |
| D | 8 | 195 | 107114 | 533.13 | 829 | 803 | 199.4 |
| D | 14 | 34 | 40641 | 199.78 | 829 | 803 | 199.4 |
Histogram calculated using DETX and DETY for each event in the final _common_clean file
| Quadrant A | 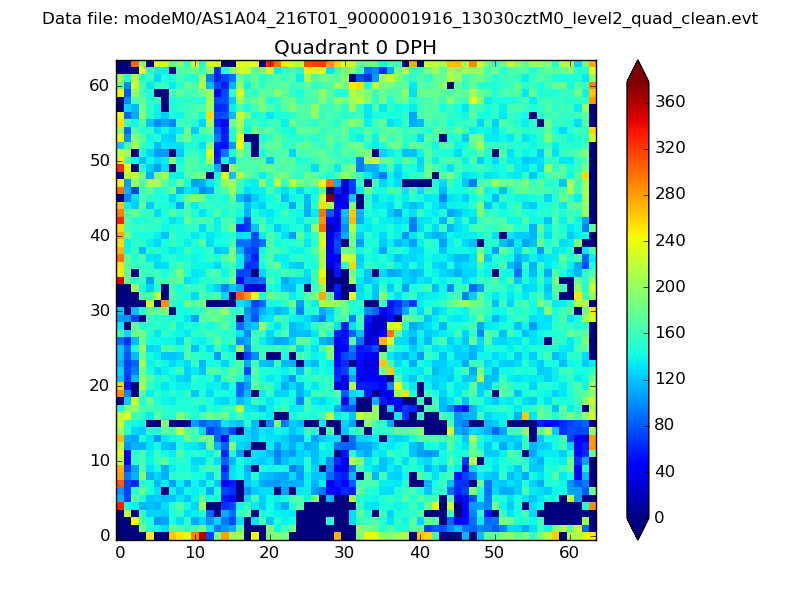 |
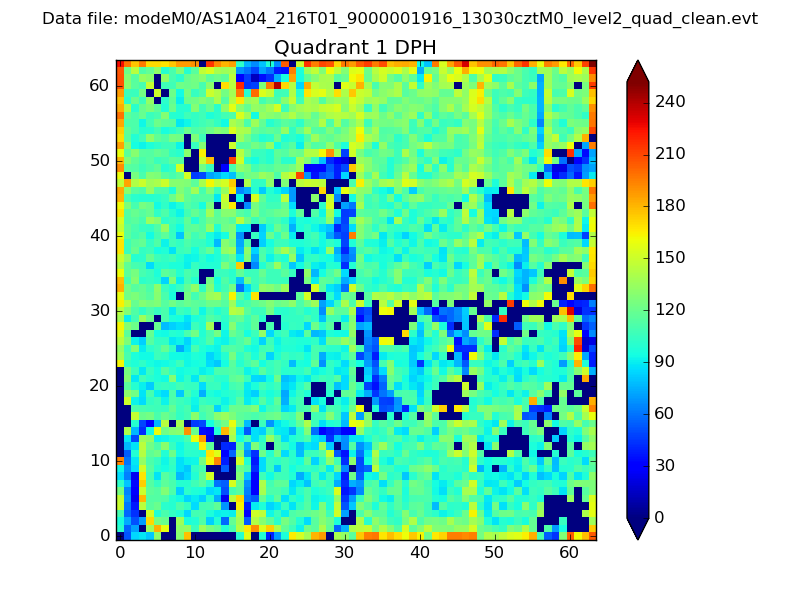 |
Quadrant B |
|---|---|---|---|
| Quadrant D | 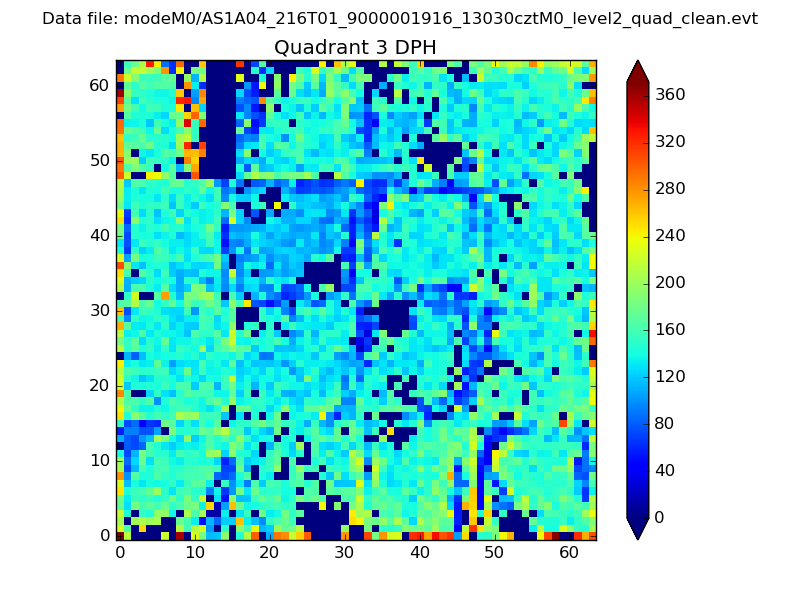 |
 |
Quadrant C |
| Plot type | Count rate plots | Images |
|---|---|---|
| Comparison with Poisson distribution Blue bars denote a histogram of data divided into 1 sec bins. Red curve is a Poisson curve with rate = median count rate of data. |
 |
 |
| Quadrant-wise count rates Data is divided into 100 sec bins |
 |
|
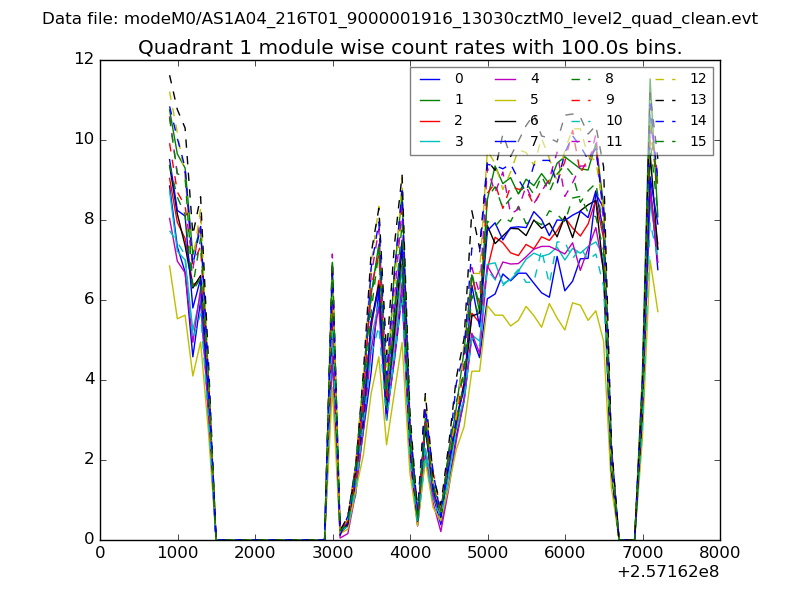
| Module-wise count rates for Quadrant A Data is divided into 100 sec bins |
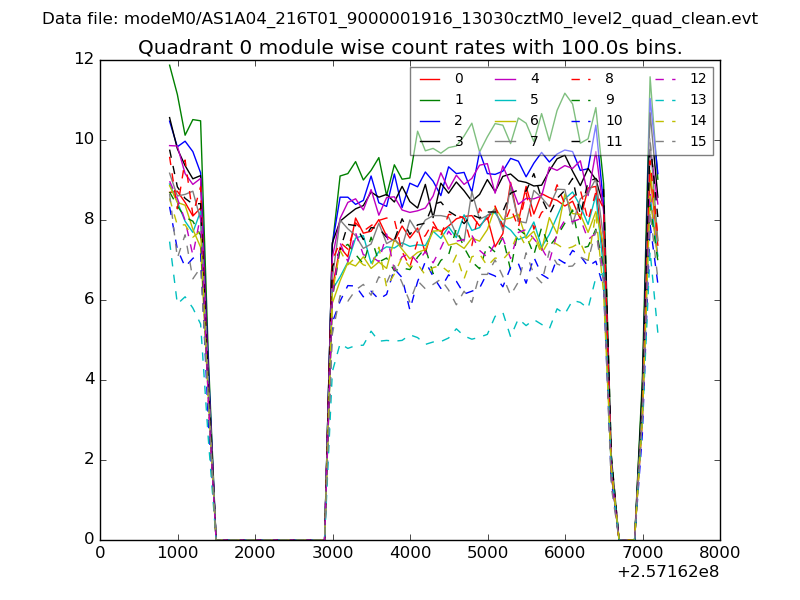 |
 |
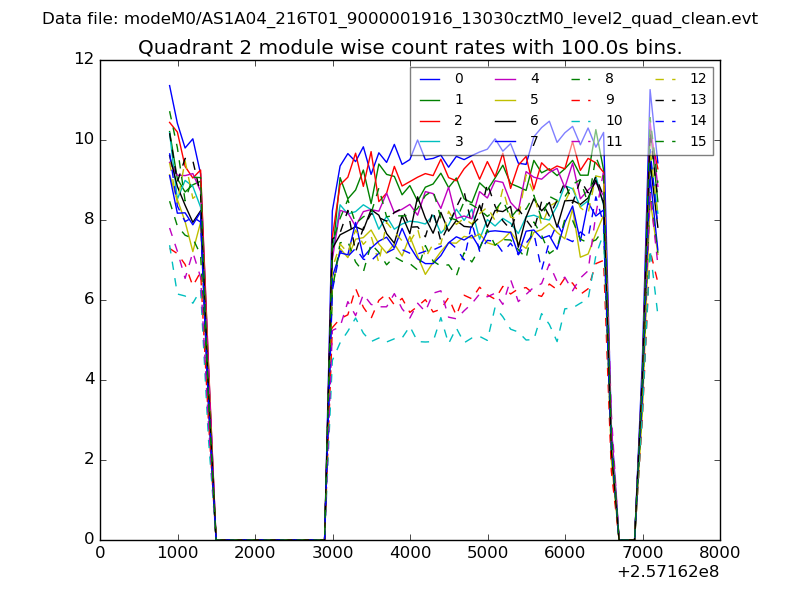
| Module-wise count rates for Quadrant B Data is divided into 100 sec bins |
 |
 |
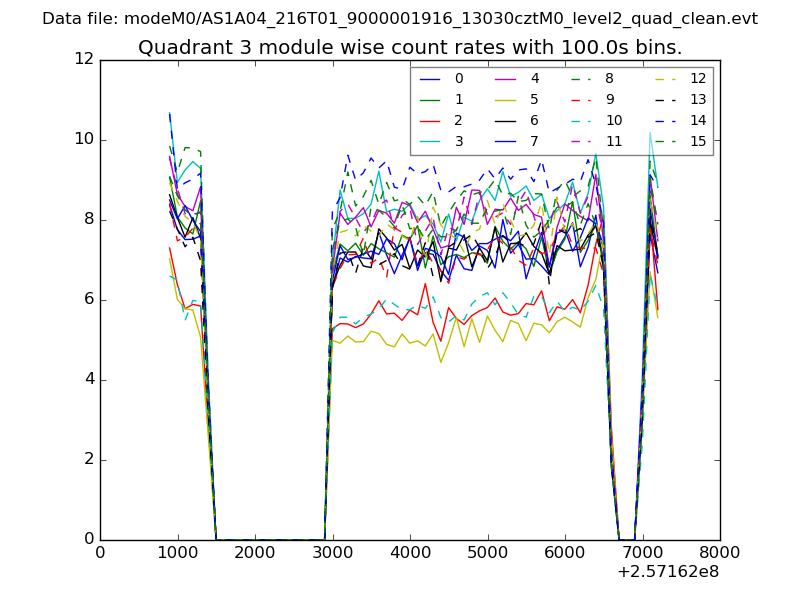
| Module-wise count rates for Quadrant C Data is divided into 100 sec bins |
 |
 |
| Module-wise count rates for Quadrant D Data is divided into 100 sec bins |
 |
 |
| Parameter | Plot |
|---|---|
| CZT HV Monitor | 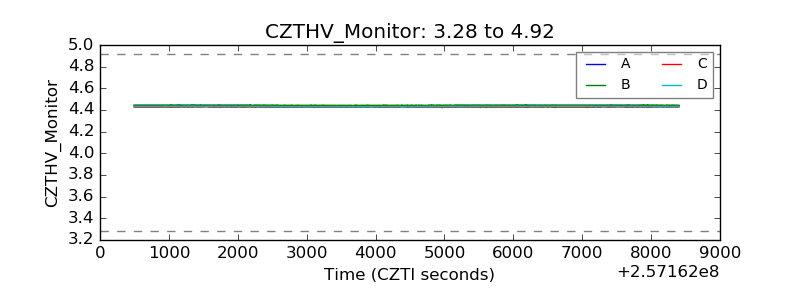 |
| D_VDD | 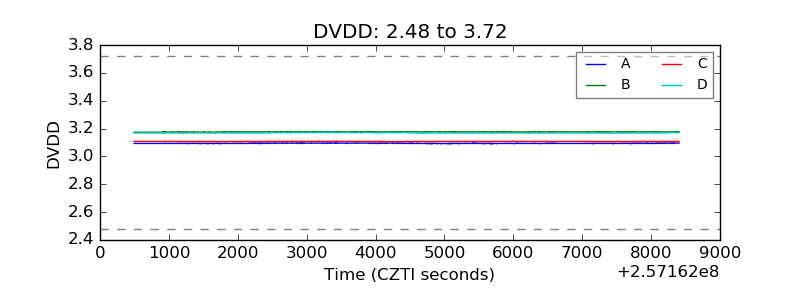 |
| Temperature 1 | 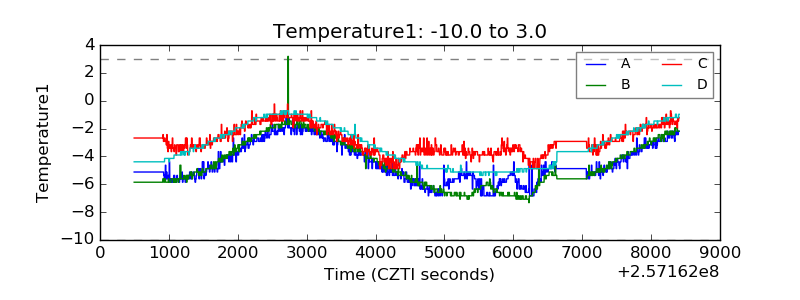 |
| Veto HV Monitor | 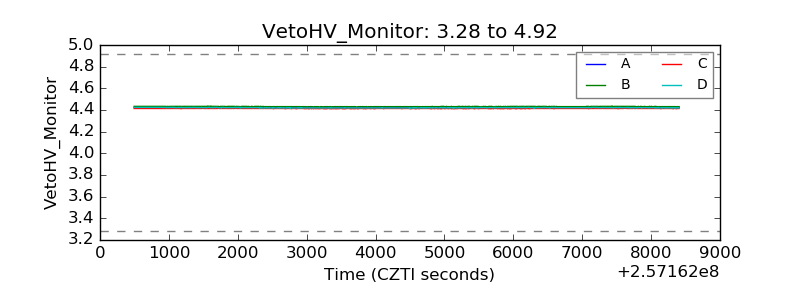 |
| Veto LLD | 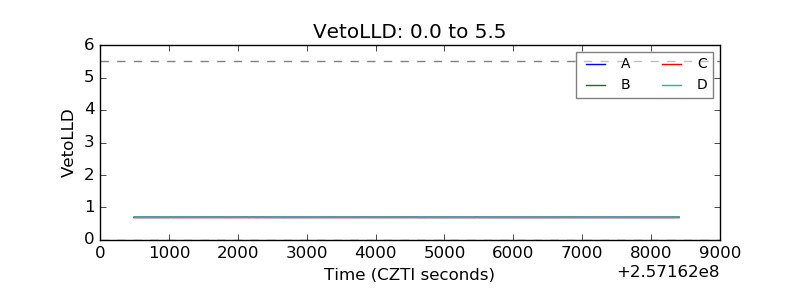 |
| Alpha Counter |  |
| _CPM_Rate | 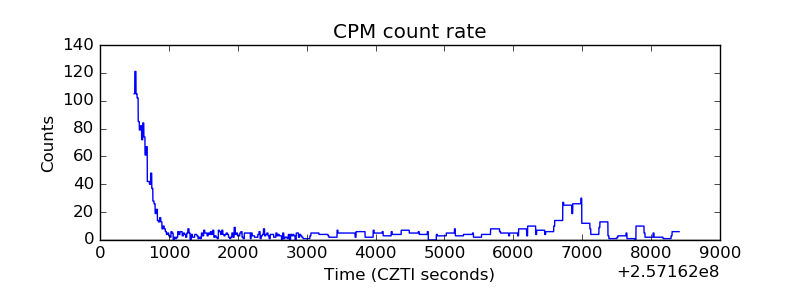 |
| CZT Counter | 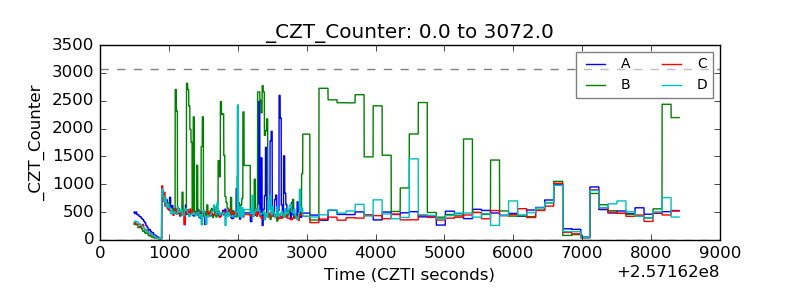 |
| +2.5 Volts monitor |  |
| +5 Volts monitor |  |
| _ROLL_ROT | 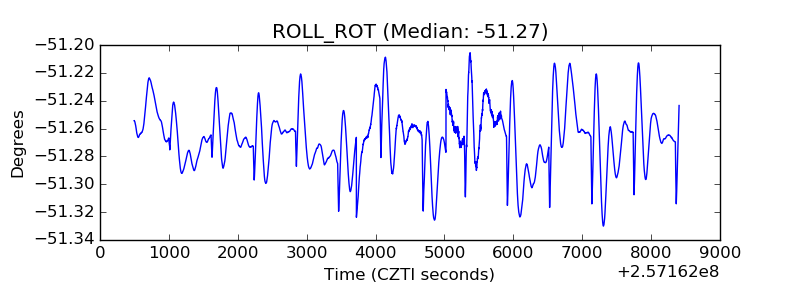 |
| _Roll_DEC | 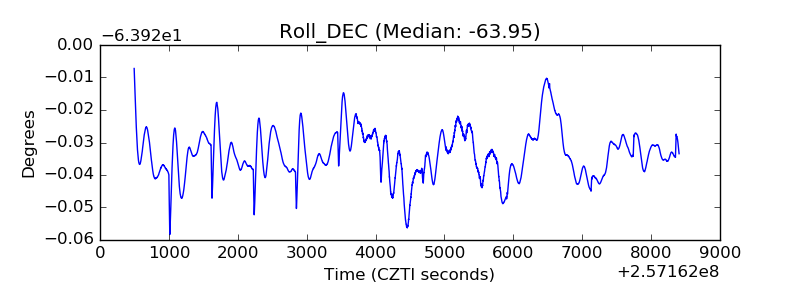 |
| _Roll_RA |  |
| Veto Counter | 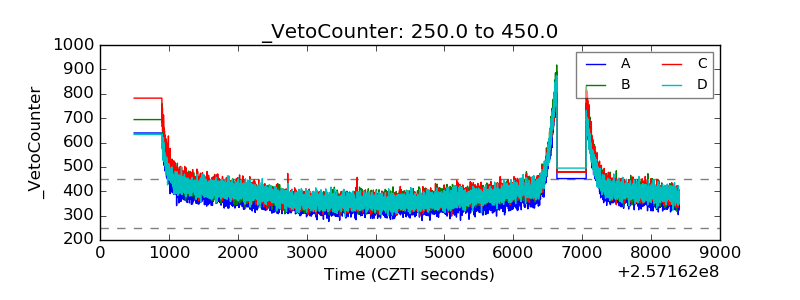 |