| Param | Original file | Final file |
|---|---|---|
| Filename | modeM0/AS1A04_216T01_9000001916_13031cztM0_level2.evt | modeM0/AS1A04_216T01_9000001916_13031cztM0_level2_quad_clean.evt |
| Size (bytes) | 828,394,560 | 97,752,960 |
| Size | 790.0 MB | 93.2 MB |
| Events in quadrant A | 4,205,960 | 641,825 |
| Events in quadrant B | 8,354,860 | 515,389 |
| Events in quadrant C | 3,859,284 | 652,896 |
| Events in quadrant D | 8,110,544 | 576,870 |
| Mode M9 | |||
|---|---|---|---|
| Quadrant | BADHDUFLAG | Total packets | Discarded packets |
| A | 0 | 6 | 0 |
| B | 0 | 6 | 0 |
| C | 0 | 6 | 0 |
| D | 0 | 6 | 0 |
| Mode SS | |||
|---|---|---|---|
| Quadrant | BADHDUFLAG | Total packets | Discarded packets |
| A | 0 | 170 | 0 |
| B | 0 | 170 | 0 |
| C | 0 | 170 | 0 |
| D | 0 | 170 | 0 |
| Mode M0 | |||
|---|---|---|---|
| Quadrant | BADHDUFLAG | Total packets | Discarded packets |
| A | 0 | 17872 | 3 |
| B | 0 | 30174 | 2 |
| C | 0 | 17328 | 2 |
| D | 0 | 29592 | 2 |
| Quadrant | Total seconds | Saturated seconds | Saturation percentage |
|---|---|---|---|
| A | 8233 | 392 | 4.761326% |
| B | 8233 | 2428 | 29.491073% |
| C | 8233 | 258 | 3.133730% |
| D | 8233 | 1714 | 20.818657% |
Noise dominated data is calculated using 1-second bins in cleaned event files. If a bin has >2000 counts, and if more than 50% of those come from <1% of pixels, then it is considered to be noise-dominated and hence unusable.
| Quadrant | # 1 sec bins | Bins with >0 counts | Bins with >2000 counts | High rate bins dominated by noise | Noise dominated (total time) | Noise dominated (detector-on time) | Marked lightcurve |
|---|---|---|---|---|---|---|---|
| A | 8849 | 8237 | 8 | 8 | 0.09% | 0.10% | 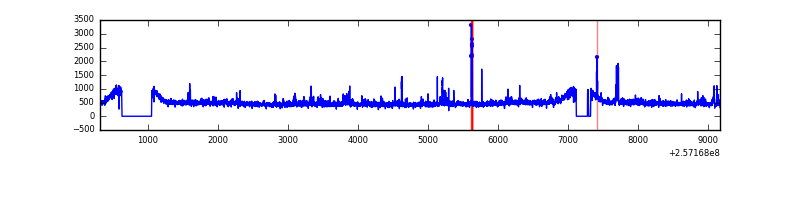 |
| B | 8849 | 8237 | 1363 | 1363 | 15.40% | 16.55% | 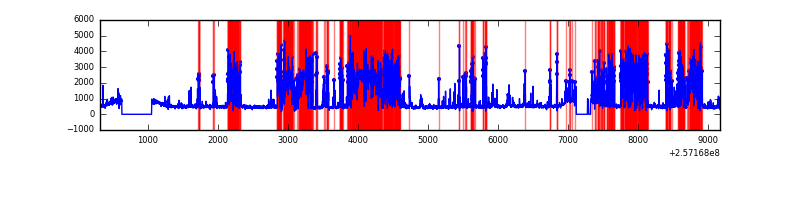 |
| C | 8849 | 8237 | 0 | 0 | 0.00% | 0.00% | 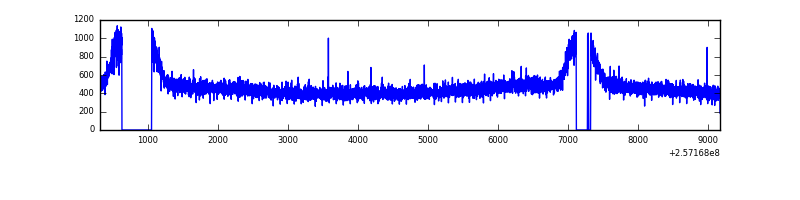 |
| D | 8849 | 8235 | 1125 | 1125 | 12.71% | 13.66% | 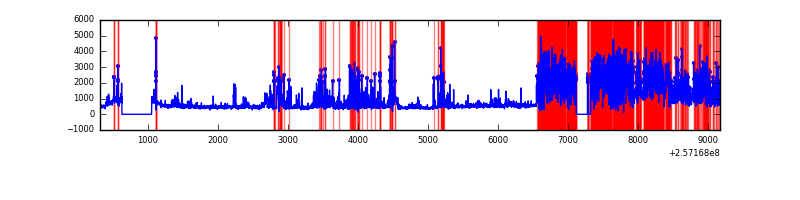 |
Top three noisy pixels from each quadrant. If the there are fewer than three noisy pixels in the level2.evt file, extra rows are filled as -1
| Pixel properties | Quadrant properties | ||||||
|---|---|---|---|---|---|---|---|
| Quadrant | DetID | PixID | Counts | Sigma | Mean | Median | Sigma |
| A | 12 | 189 | 218385 | 1066.21 | 1003 | 977 | 203.9 |
| A | 15 | 174 | 46047 | 221.03 | 1003 | 977 | 203.9 |
| A | 8 | 15 | 26974 | 127.49 | 1003 | 977 | 203.9 |
| B | 4 | 239 | 4507281 | 27915.97 | 839 | 814 | 161.4 |
| B | 3 | 64 | 312334 | 1929.76 | 839 | 814 | 161.4 |
| B | 4 | 173 | 106508 | 654.74 | 839 | 814 | 161.4 |
| C | 13 | 61 | 7128 | 26.99 | 988 | 990 | 227.4 |
| C | 8 | 222 | 5051 | 17.85 | 988 | 990 | 227.4 |
| C | 14 | 234 | 3292 | 10.12 | 988 | 990 | 227.4 |
| D | 1 | 52 | 4201799 | 20051.43 | 873 | 845 | 209.5 |
| D | 14 | 34 | 387060 | 1843.43 | 873 | 845 | 209.5 |
| D | 8 | 195 | 213807 | 1016.48 | 873 | 845 | 209.5 |
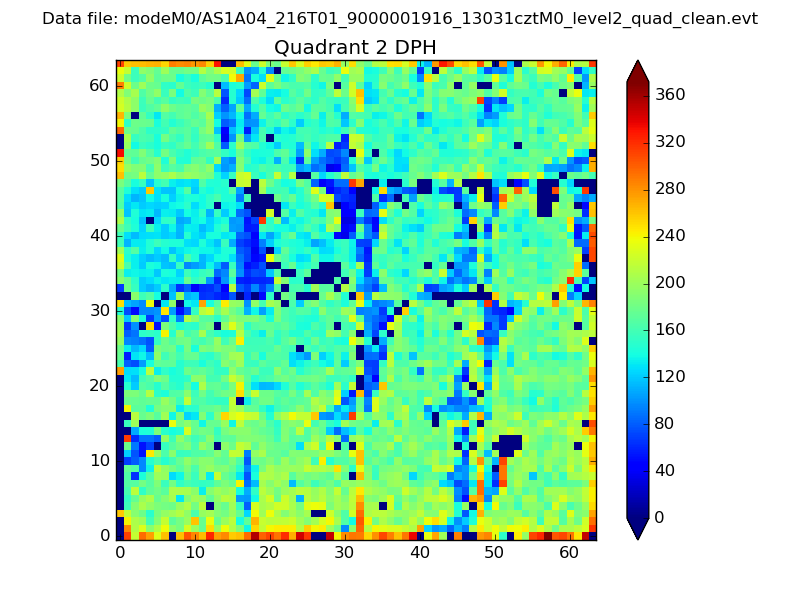
Histogram calculated using DETX and DETY for each event in the final _common_clean file
| Quadrant A | 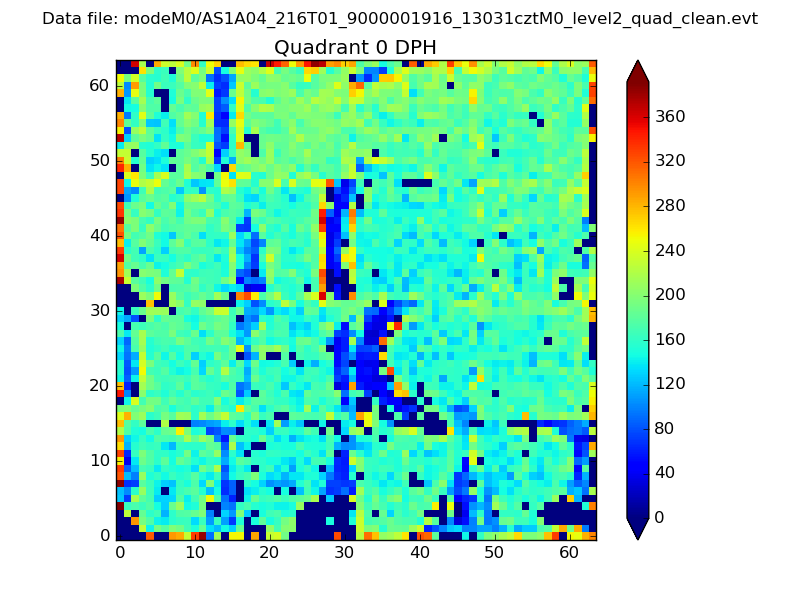 |
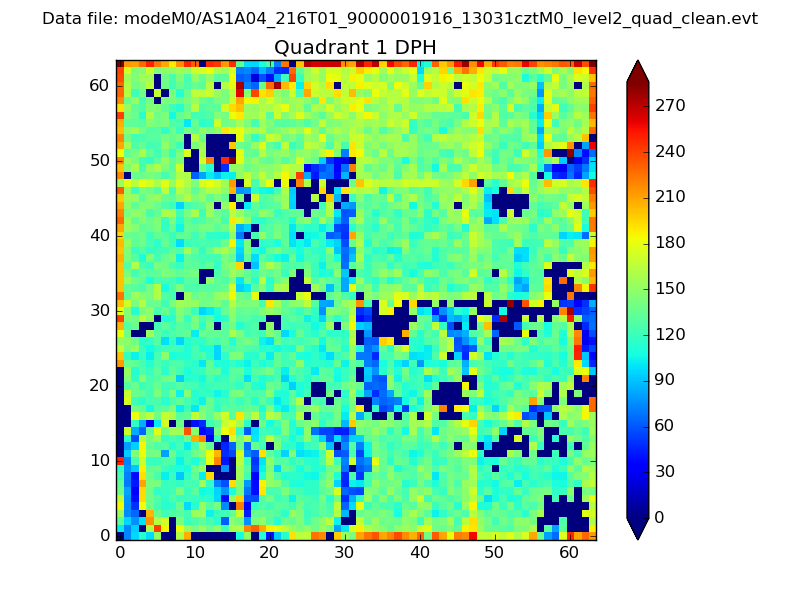 |
Quadrant B |
|---|---|---|---|
| Quadrant D | 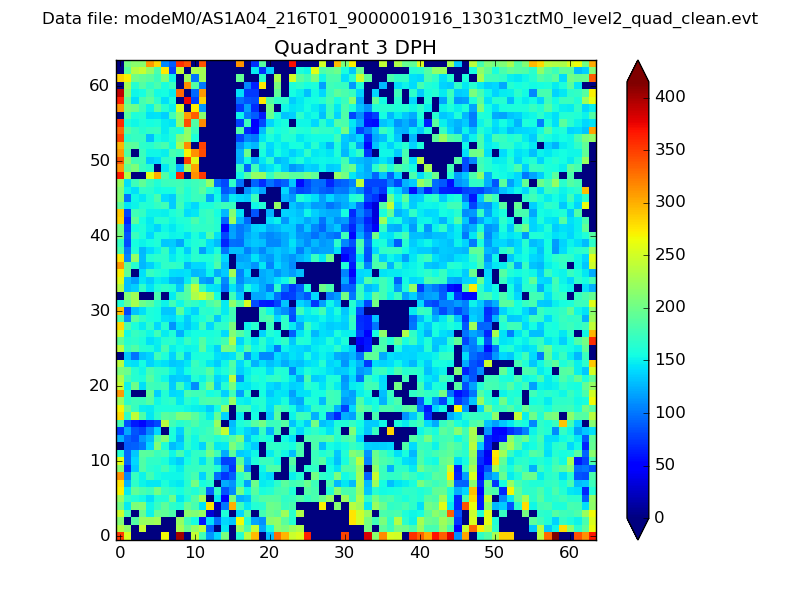 |
 |
Quadrant C |
| Plot type | Count rate plots | Images |
|---|---|---|
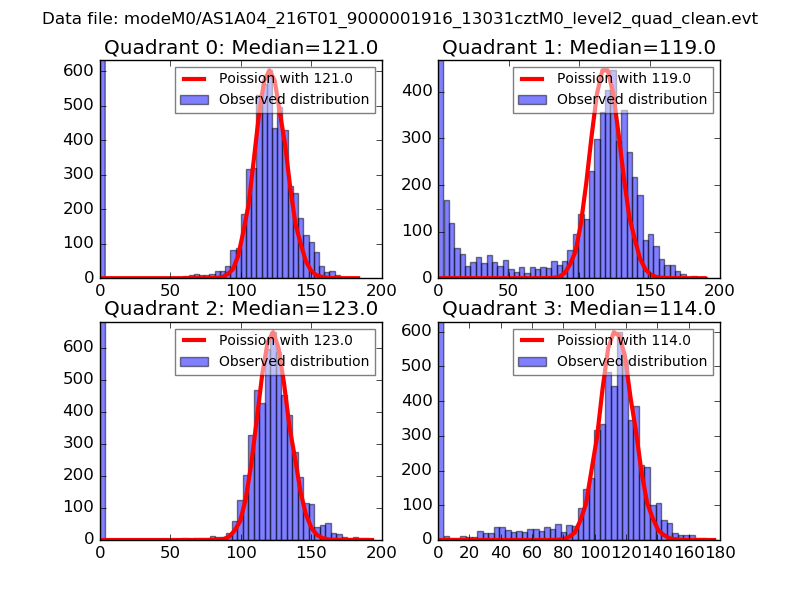
| Comparison with Poisson distribution Blue bars denote a histogram of data divided into 1 sec bins. Red curve is a Poisson curve with rate = median count rate of data. |
 |
 |
| Quadrant-wise count rates Data is divided into 100 sec bins |
 |
|
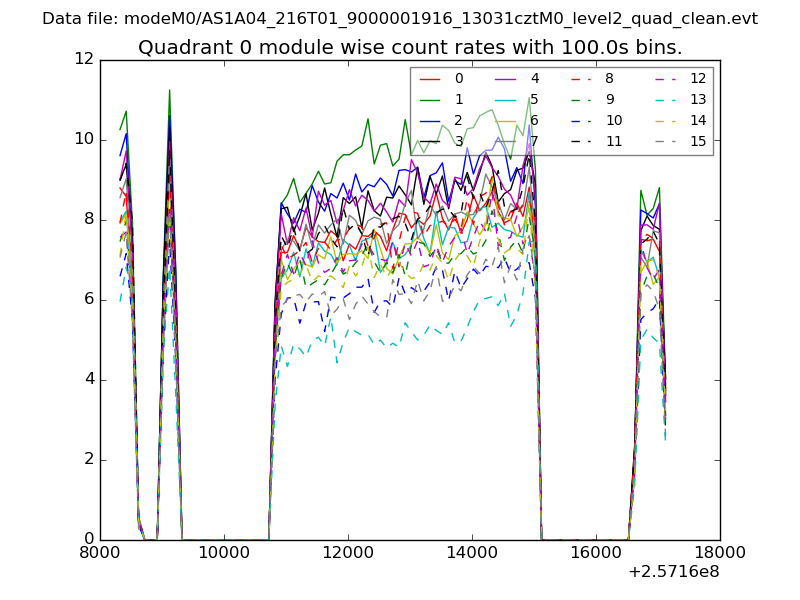
| Module-wise count rates for Quadrant A Data is divided into 100 sec bins |
 |
 |
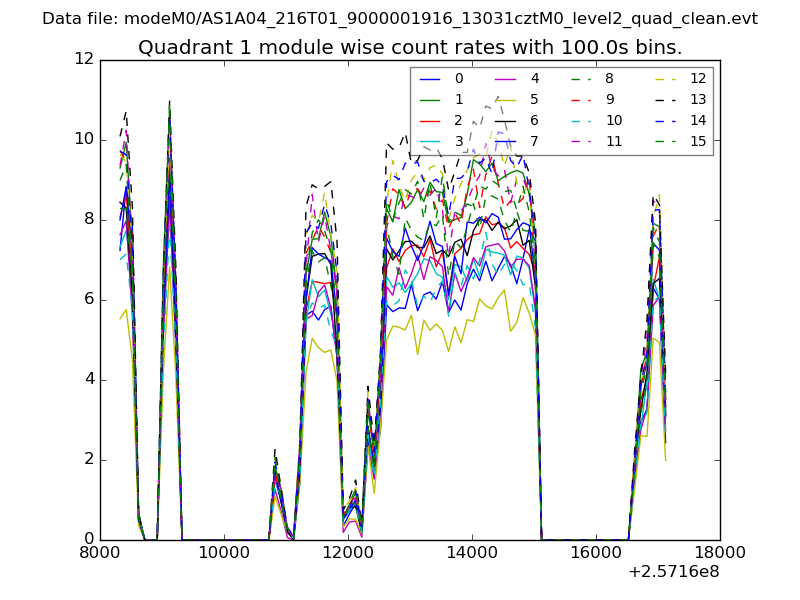
| Module-wise count rates for Quadrant B Data is divided into 100 sec bins |
 |
 |
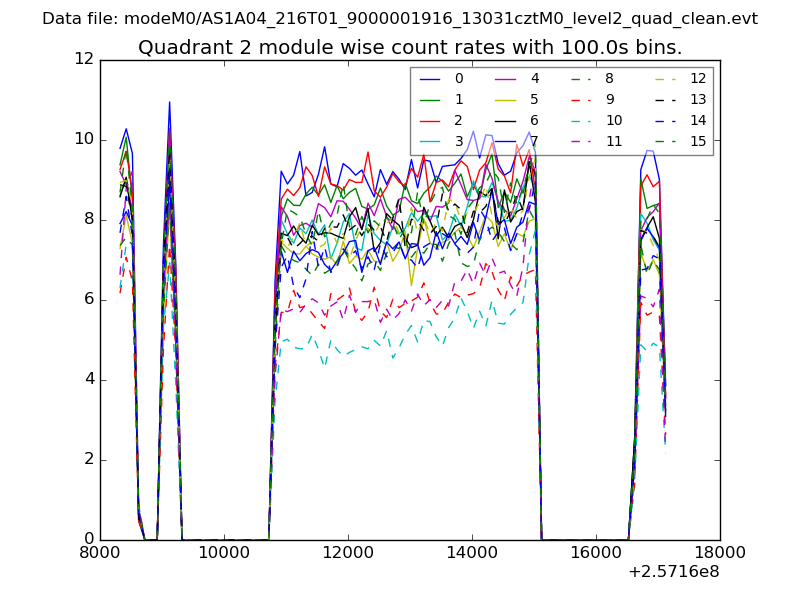
| Module-wise count rates for Quadrant C Data is divided into 100 sec bins |
 |
 |
| Module-wise count rates for Quadrant D Data is divided into 100 sec bins |
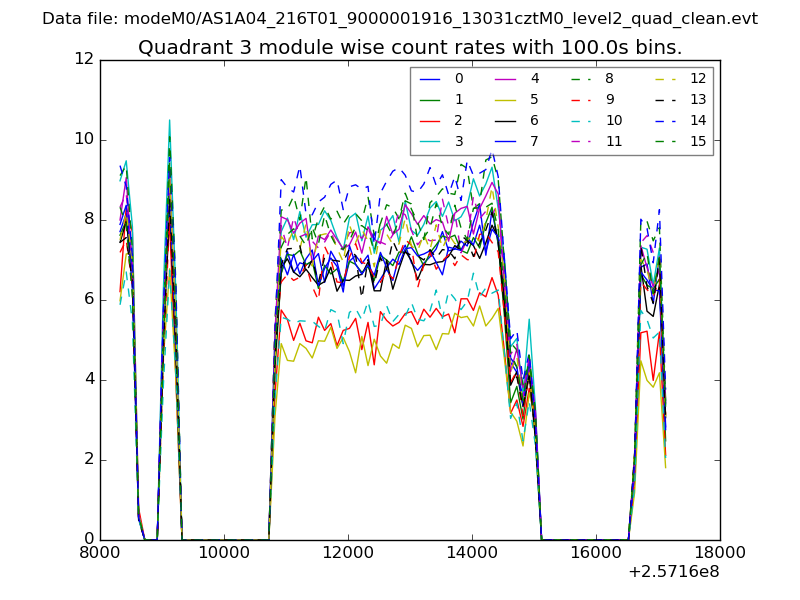 |
 |
| Parameter | Plot |
|---|---|
| CZT HV Monitor | 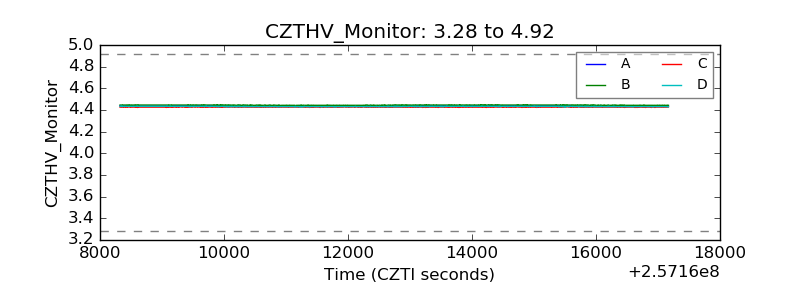 |
| D_VDD | 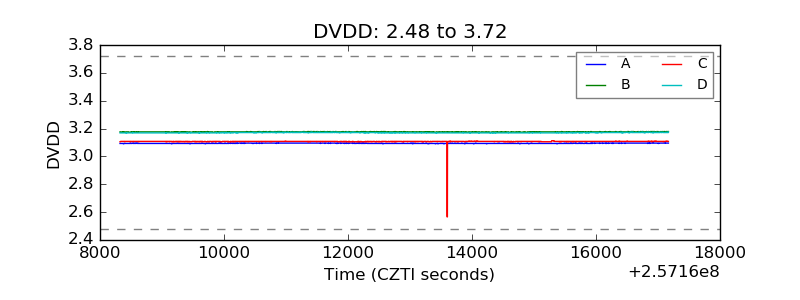 |
| Temperature 1 | 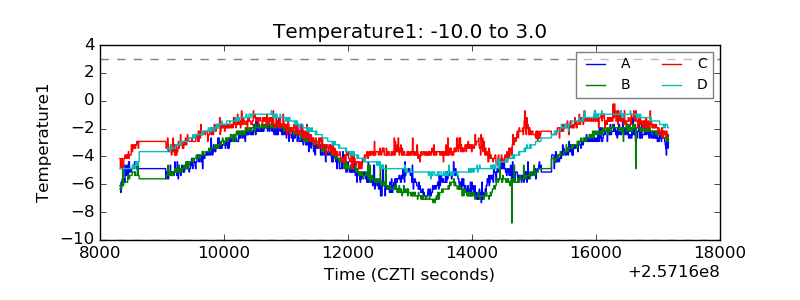 |
| Veto HV Monitor | 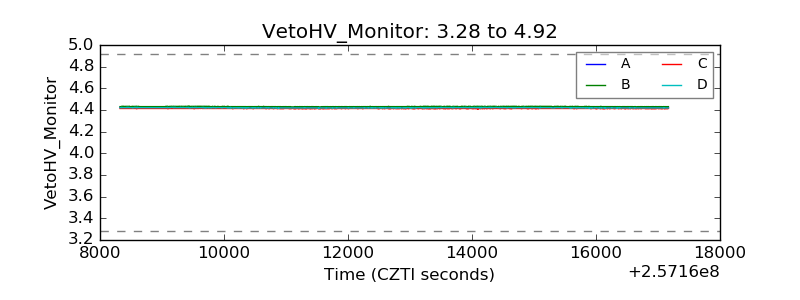 |
| Veto LLD | 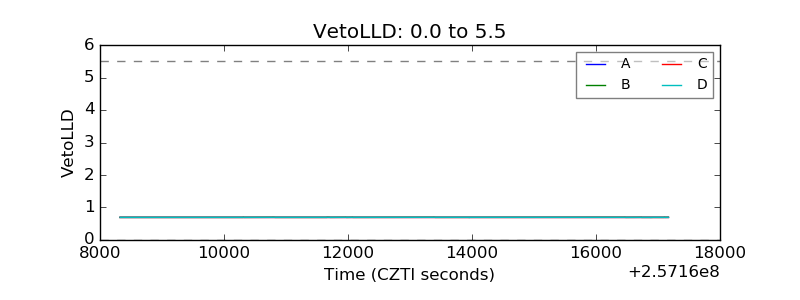 |
| Alpha Counter |  |
| _CPM_Rate | 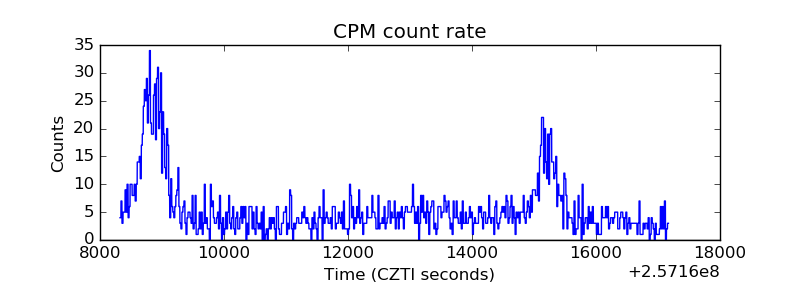 |
| CZT Counter |  |
| +2.5 Volts monitor |  |
| +5 Volts monitor |  |
| _ROLL_ROT | 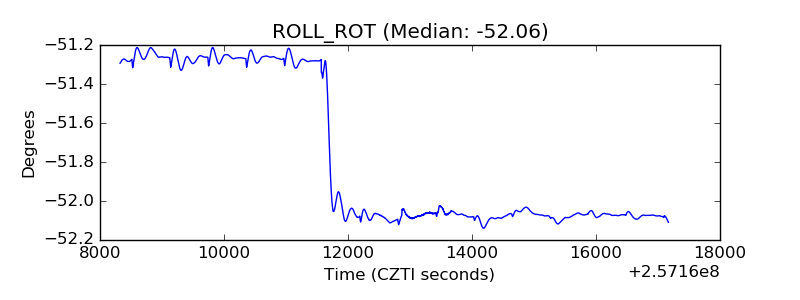 |
| _Roll_DEC | 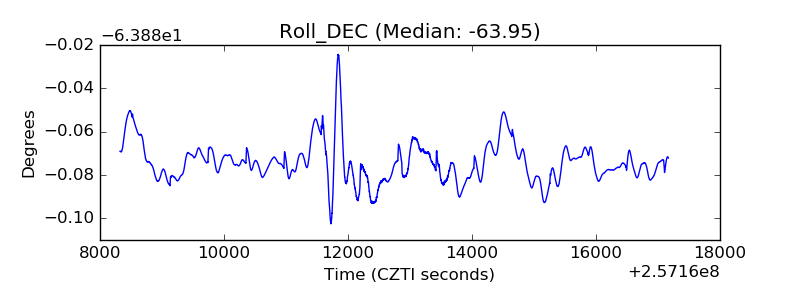 |
| _Roll_RA | 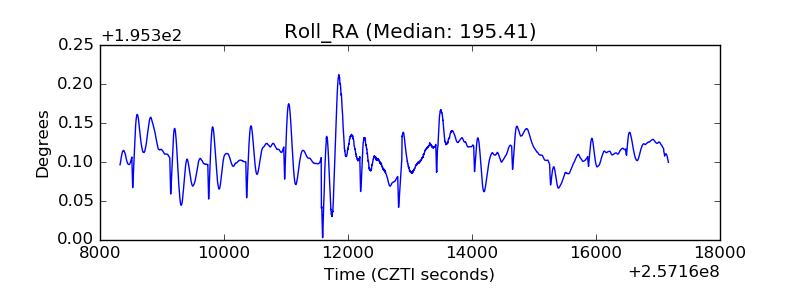 |
| Veto Counter | 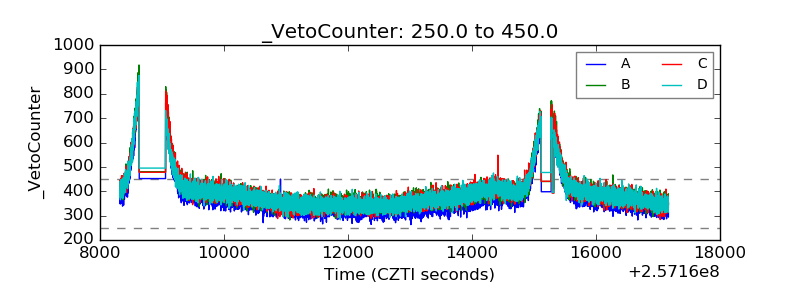 |