| Param | Original file | Final file |
|---|---|---|
| Filename | modeM0/AS1A04_216T01_9000001916_13035cztM0_level2.evt | modeM0/AS1A04_216T01_9000001916_13035cztM0_level2_quad_clean.evt |
| Size (bytes) | 1,890,688,320 | 306,403,200 |
| Size | 1.8 GB | 292.2 MB |
| Events in quadrant A | 12,467,313 | 2,025,345 |
| Events in quadrant B | 19,270,435 | 1,782,868 |
| Events in quadrant C | 9,796,824 | 2,022,298 |
| Events in quadrant D | 14,218,301 | 1,911,725 |
| Mode M9 | |||
|---|---|---|---|
| Quadrant | BADHDUFLAG | Total packets | Discarded packets |
| A | 0 | 15 | 0 |
| B | 0 | 14 | 0 |
| C | 0 | 14 | 0 |
| D | 0 | 14 | 0 |
| Mode SS | |||
|---|---|---|---|
| Quadrant | BADHDUFLAG | Total packets | Discarded packets |
| A | 0 | 452 | 0 |
| B | 0 | 452 | 0 |
| C | 0 | 452 | 0 |
| D | 0 | 452 | 0 |
| Mode M0 | |||
|---|---|---|---|
| Quadrant | BADHDUFLAG | Total packets | Discarded packets |
| A | 0 | 51968 | 3 |
| B | 0 | 72137 | 3 |
| C | 0 | 45254 | 3 |
| D | 0 | 57801 | 3 |
| Quadrant | Total seconds | Saturated seconds | Saturation percentage |
|---|---|---|---|
| A | 22329 | 358 | 1.603296% |
| B | 22329 | 4365 | 19.548569% |
| C | 22329 | 104 | 0.465762% |
| D | 22329 | 754 | 3.376775% |
Noise dominated data is calculated using 1-second bins in cleaned event files. If a bin has >2000 counts, and if more than 50% of those come from <1% of pixels, then it is considered to be noise-dominated and hence unusable.
| Quadrant | # 1 sec bins | Bins with >0 counts | Bins with >2000 counts | High rate bins dominated by noise | Noise dominated (total time) | Noise dominated (detector-on time) | Marked lightcurve |
|---|---|---|---|---|---|---|---|
| A | 23765 | 22333 | 114 | 114 | 0.48% | 0.51% | 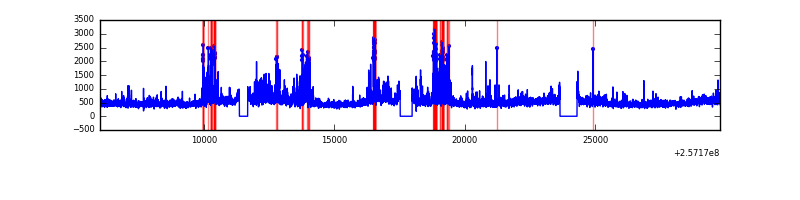 |
| B | 23765 | 22333 | 2813 | 2813 | 11.84% | 12.60% | 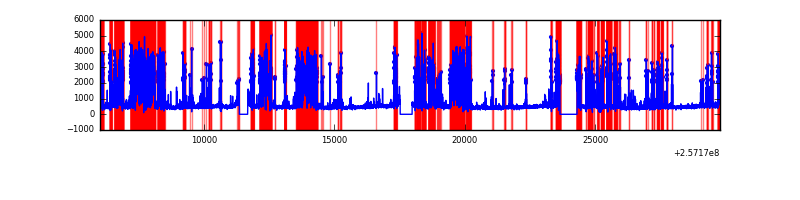 |
| C | 23765 | 22333 | 6 | 6 | 0.03% | 0.03% | 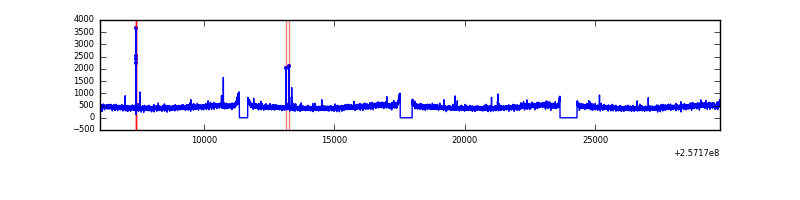 |
| D | 23765 | 22333 | 511 | 511 | 2.15% | 2.29% | 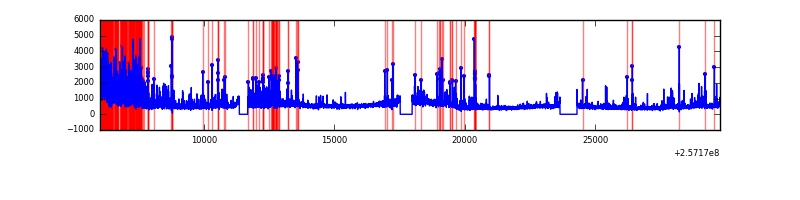 |
Top three noisy pixels from each quadrant. If the there are fewer than three noisy pixels in the level2.evt file, extra rows are filled as -1
| Pixel properties | Quadrant properties | ||||||
|---|---|---|---|---|---|---|---|
| Quadrant | DetID | PixID | Counts | Sigma | Mean | Median | Sigma |
| A | 8 | 15 | 1854322 | 3578.91 | 2555 | 2497 | 517.4 |
| A | 12 | 189 | 450159 | 865.17 | 2555 | 2497 | 517.4 |
| A | 1 | 162 | 127469 | 241.53 | 2555 | 2497 | 517.4 |
| B | 4 | 239 | 9586933 | 22678.64 | 2255 | 2200 | 422.6 |
| B | 3 | 64 | 401266 | 944.24 | 2255 | 2200 | 422.6 |
| B | 4 | 173 | 164831 | 384.8 | 2255 | 2200 | 422.6 |
| C | 14 | 234 | 24774 | 38.69 | 2501 | 2514 | 575.4 |
| C | 13 | 61 | 18521 | 27.82 | 2501 | 2514 | 575.4 |
| C | 12 | 4 | 12450 | 17.27 | 2501 | 2514 | 575.4 |
| D | 1 | 52 | 3633758 | 6180.51 | 2454 | 2378 | 587.6 |
| D | 14 | 34 | 747994 | 1269.02 | 2454 | 2378 | 587.6 |
| D | 8 | 195 | 449230 | 760.53 | 2454 | 2378 | 587.6 |
Histogram calculated using DETX and DETY for each event in the final _common_clean file
| Quadrant A | 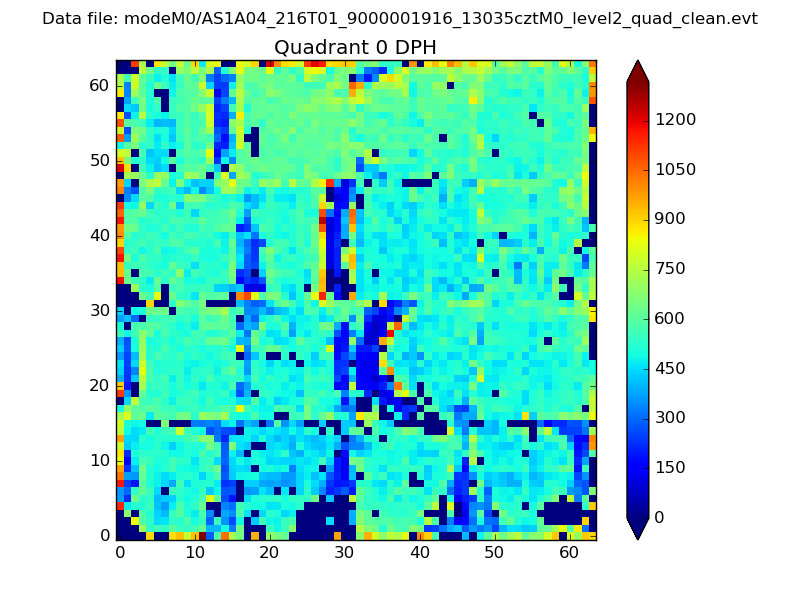 |
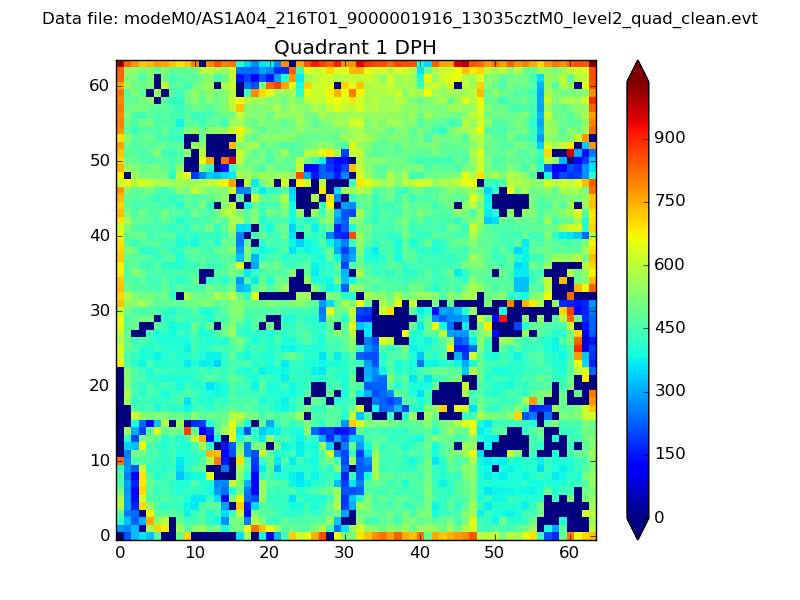 |
Quadrant B |
|---|---|---|---|
| Quadrant D | 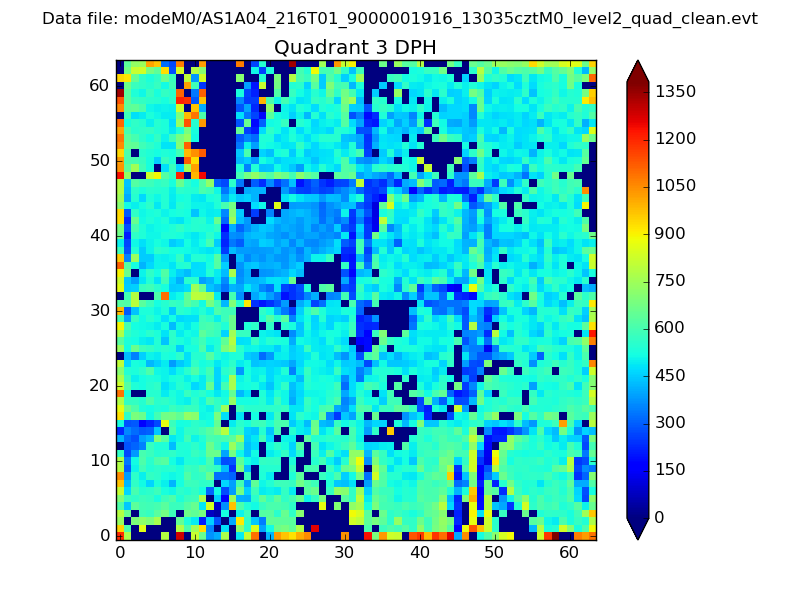 |
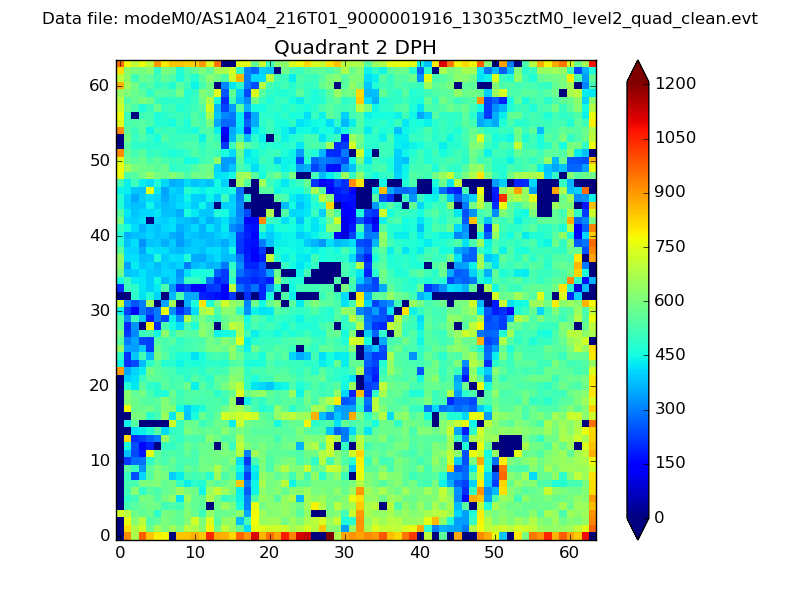 |
Quadrant C |
| Plot type | Count rate plots | Images |
|---|---|---|
| Comparison with Poisson distribution Blue bars denote a histogram of data divided into 1 sec bins. Red curve is a Poisson curve with rate = median count rate of data. |
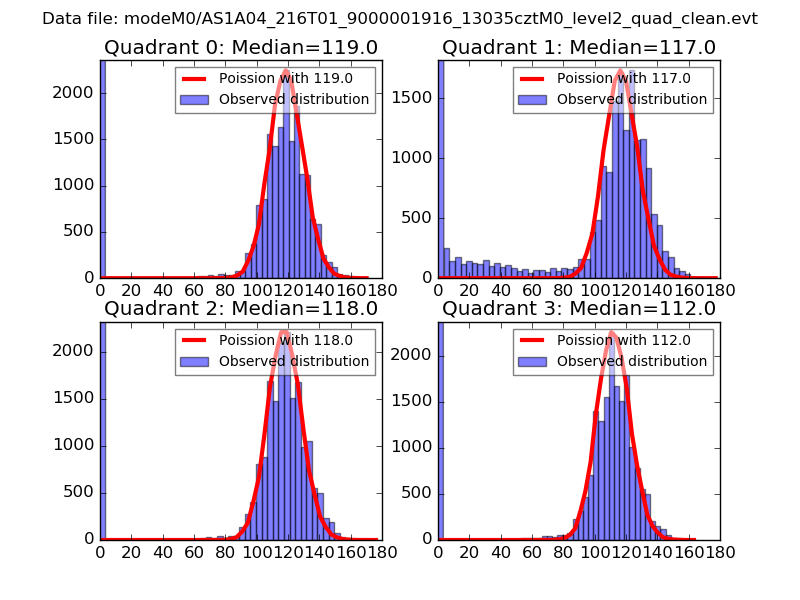 |
 |
| Quadrant-wise count rates Data is divided into 100 sec bins |
 |
|
| Module-wise count rates for Quadrant A Data is divided into 100 sec bins |
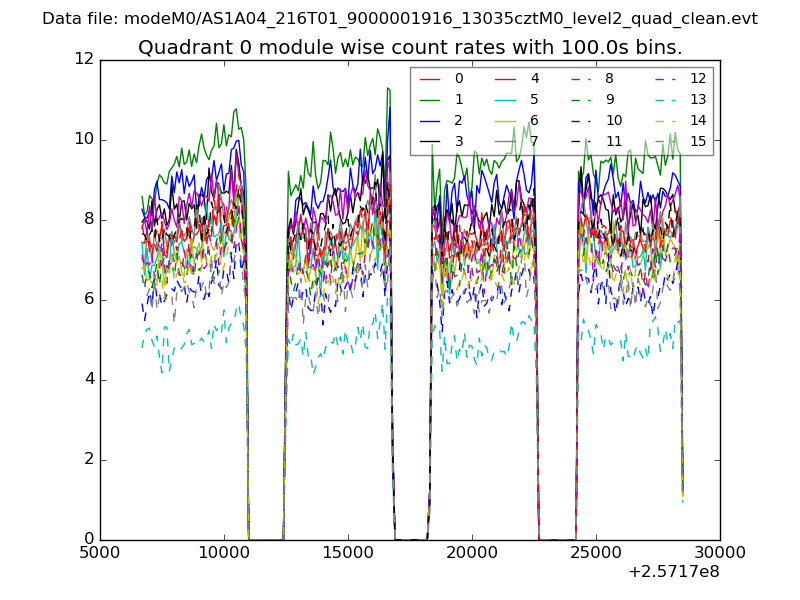 |
 |
| Module-wise count rates for Quadrant B Data is divided into 100 sec bins |
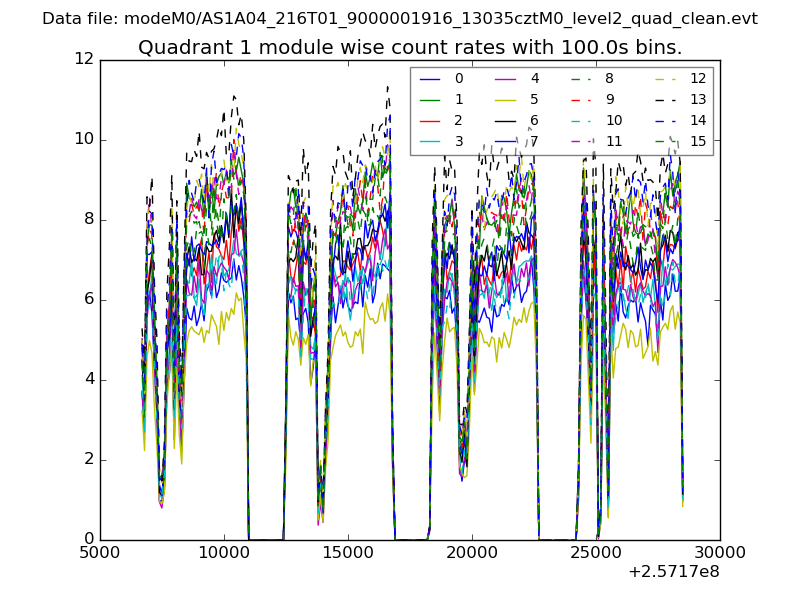 |
 |
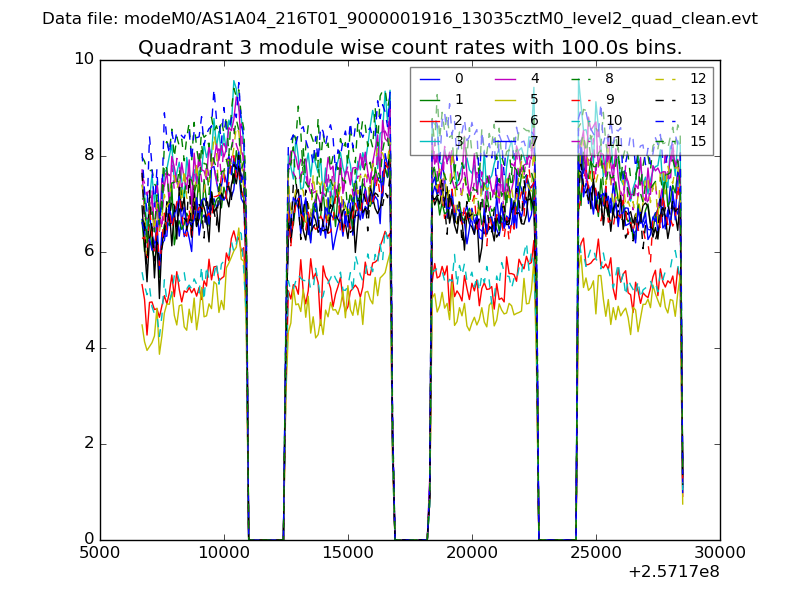
| Module-wise count rates for Quadrant C Data is divided into 100 sec bins |
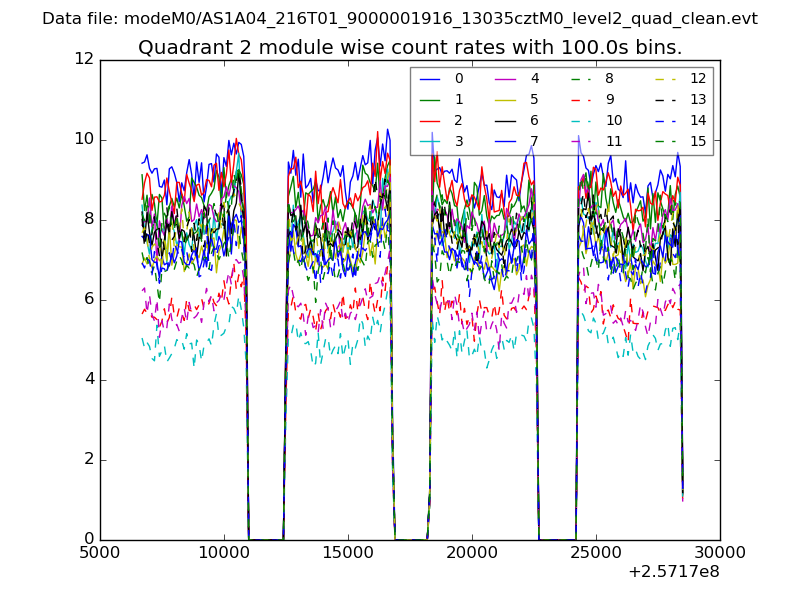 |
 |
| Module-wise count rates for Quadrant D Data is divided into 100 sec bins |
 |
 |
| Parameter | Plot |
|---|---|
| CZT HV Monitor | 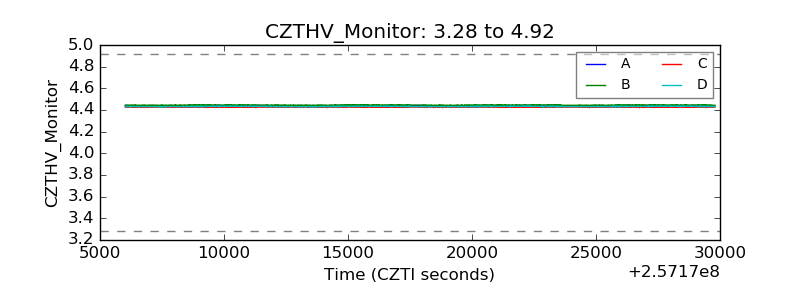 |
| D_VDD | 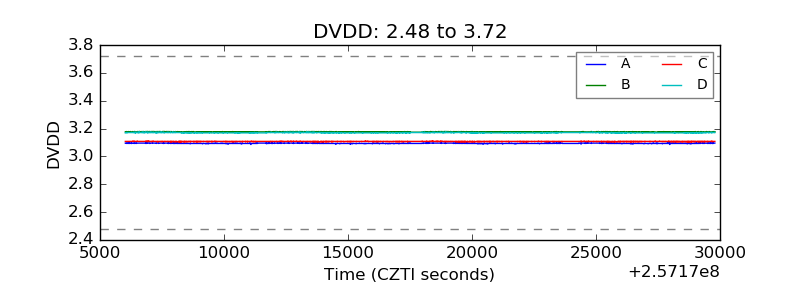 |
| Temperature 1 |  |
| Veto HV Monitor | 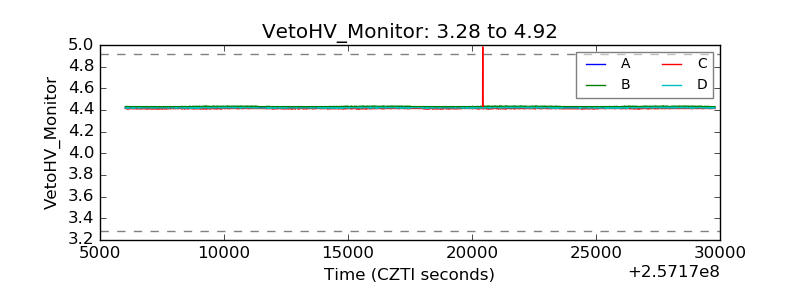 |
| Veto LLD | 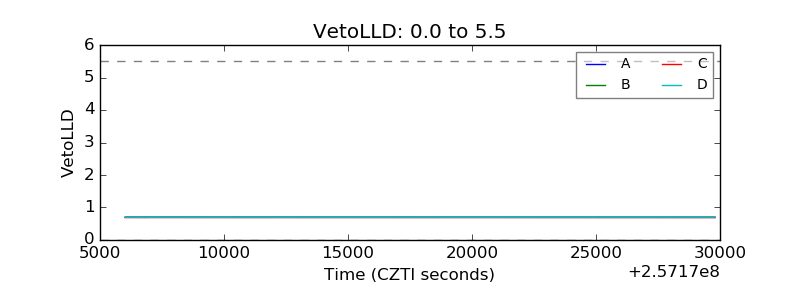 |
| Alpha Counter | 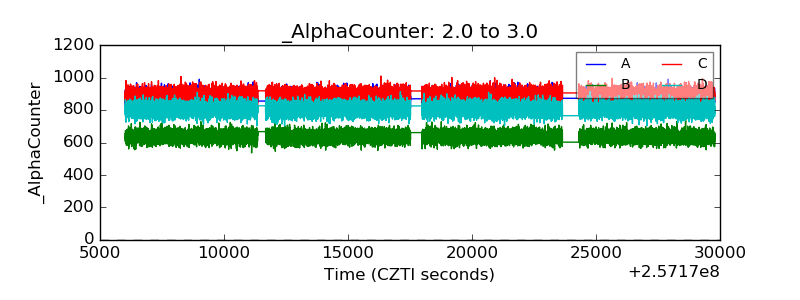 |
| _CPM_Rate | 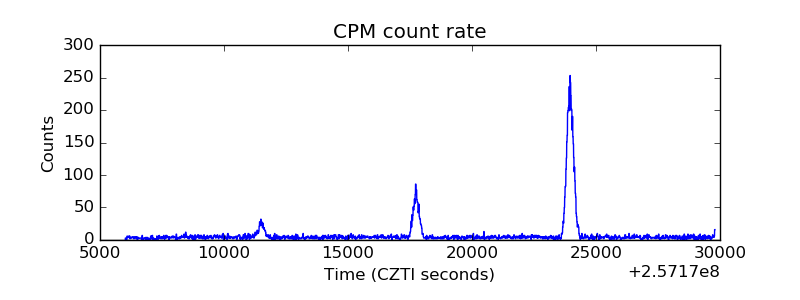 |
| CZT Counter |  |
| +2.5 Volts monitor |  |
| +5 Volts monitor |  |
| _ROLL_ROT | 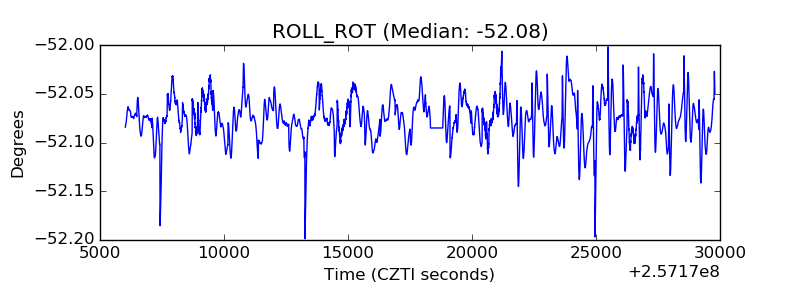 |
| _Roll_DEC | 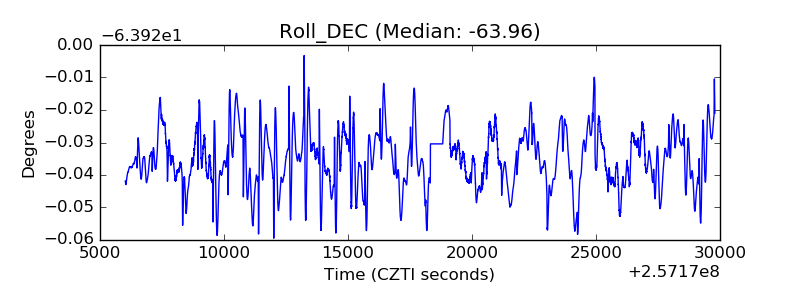 |
| _Roll_RA |  |
| Veto Counter | 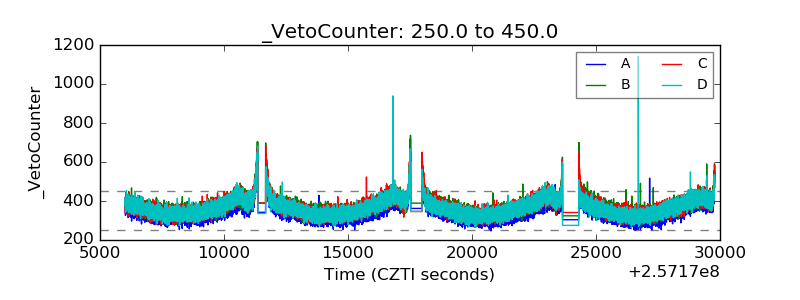 |