| Param | Original file | Final file |
|---|---|---|
| Filename | modeM0/AS1A04_216T01_9000001916_13038cztM0_level2.evt | modeM0/AS1A04_216T01_9000001916_13038cztM0_level2_quad_clean.evt |
| Size (bytes) | 592,657,920 | 97,200,000 |
| Size | 565.2 MB | 92.7 MB |
| Events in quadrant A | 3,342,319 | 655,123 |
| Events in quadrant B | 7,177,369 | 541,215 |
| Events in quadrant C | 3,021,167 | 660,578 |
| Events in quadrant D | 3,952,510 | 618,598 |
| Mode M9 | |||
|---|---|---|---|
| Quadrant | BADHDUFLAG | Total packets | Discarded packets |
| A | 0 | 21 | 0 |
| B | 0 | 21 | 0 |
| C | 0 | 21 | 0 |
| D | 0 | 21 | 0 |
| Mode SS | |||
|---|---|---|---|
| Quadrant | BADHDUFLAG | Total packets | Discarded packets |
| A | 0 | 138 | 0 |
| B | 0 | 138 | 0 |
| C | 0 | 138 | 0 |
| D | 0 | 138 | 0 |
| Mode M0 | |||
|---|---|---|---|
| Quadrant | BADHDUFLAG | Total packets | Discarded packets |
| A | 0 | 14225 | 3 |
| B | 0 | 25827 | 2 |
| C | 0 | 13593 | 2 |
| D | 0 | 16391 | 2 |
| Quadrant | Total seconds | Saturated seconds | Saturation percentage |
|---|---|---|---|
| A | 6706 | 34 | 0.507009% |
| B | 6706 | 2158 | 32.180137% |
| C | 6706 | 17 | 0.253504% |
| D | 6706 | 78 | 1.163137% |
Noise dominated data is calculated using 1-second bins in cleaned event files. If a bin has >2000 counts, and if more than 50% of those come from <1% of pixels, then it is considered to be noise-dominated and hence unusable.
| Quadrant | # 1 sec bins | Bins with >0 counts | Bins with >2000 counts | High rate bins dominated by noise | Noise dominated (total time) | Noise dominated (detector-on time) | Marked lightcurve |
|---|---|---|---|---|---|---|---|
| A | 8793 | 6709 | 7 | 7 | 0.08% | 0.10% | 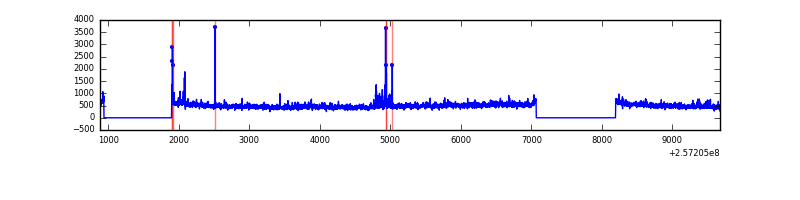 |
| B | 8793 | 6708 | 1314 | 1314 | 14.94% | 19.59% | 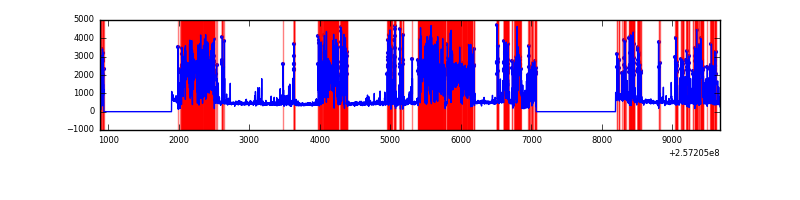 |
| C | 8793 | 6709 | 0 | 0 | 0.00% | 0.00% | 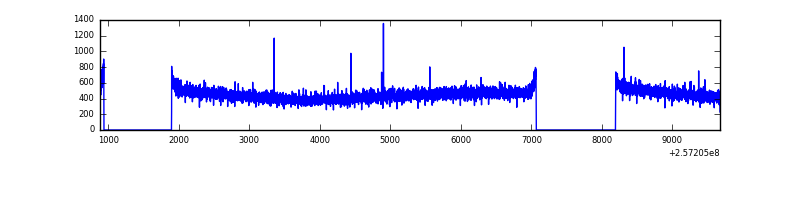 |
| D | 8793 | 6709 | 59 | 59 | 0.67% | 0.88% | 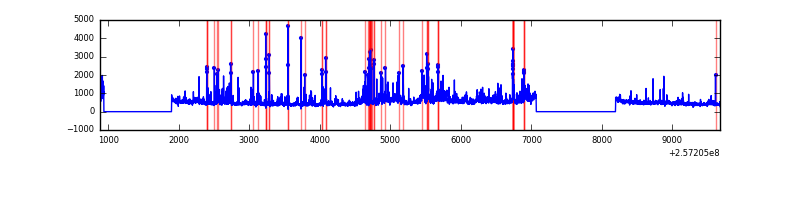 |
Top three noisy pixels from each quadrant. If the there are fewer than three noisy pixels in the level2.evt file, extra rows are filled as -1
| Pixel properties | Quadrant properties | ||||||
|---|---|---|---|---|---|---|---|
| Quadrant | DetID | PixID | Counts | Sigma | Mean | Median | Sigma |
| A | 12 | 189 | 92655 | 577.38 | 782 | 765 | 159.2 |
| A | 1 | 162 | 63982 | 397.22 | 782 | 765 | 159.2 |
| A | 15 | 223 | 49225 | 304.49 | 782 | 765 | 159.2 |
| B | 4 | 239 | 4514972 | 39558.69 | 605 | 589 | 114.1 |
| B | 0 | 85 | 194729 | 1701.21 | 605 | 589 | 114.1 |
| B | 0 | 214 | 33164 | 285.45 | 605 | 589 | 114.1 |
| C | 13 | 61 | 5561 | 26.91 | 773 | 777 | 177.8 |
| C | 12 | 4 | 2805 | 11.41 | 773 | 777 | 177.8 |
| C | 14 | 234 | 2654 | 10.56 | 773 | 777 | 177.8 |
| D | 1 | 52 | 917577 | 5057.29 | 756 | 734 | 181.3 |
| D | 8 | 195 | 92874 | 508.24 | 756 | 734 | 181.3 |
| D | 14 | 34 | 54503 | 296.59 | 756 | 734 | 181.3 |
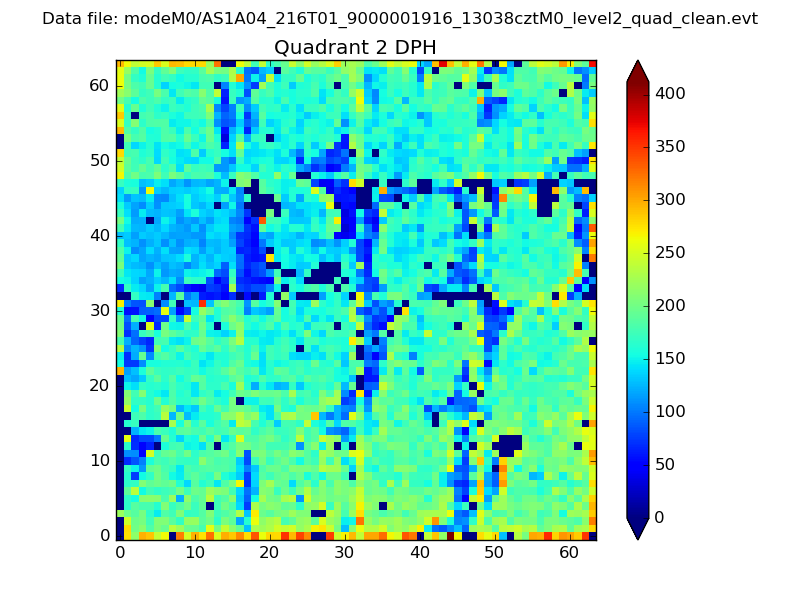
Histogram calculated using DETX and DETY for each event in the final _common_clean file
| Quadrant A |  |
 |
Quadrant B |
|---|---|---|---|
| Quadrant D | 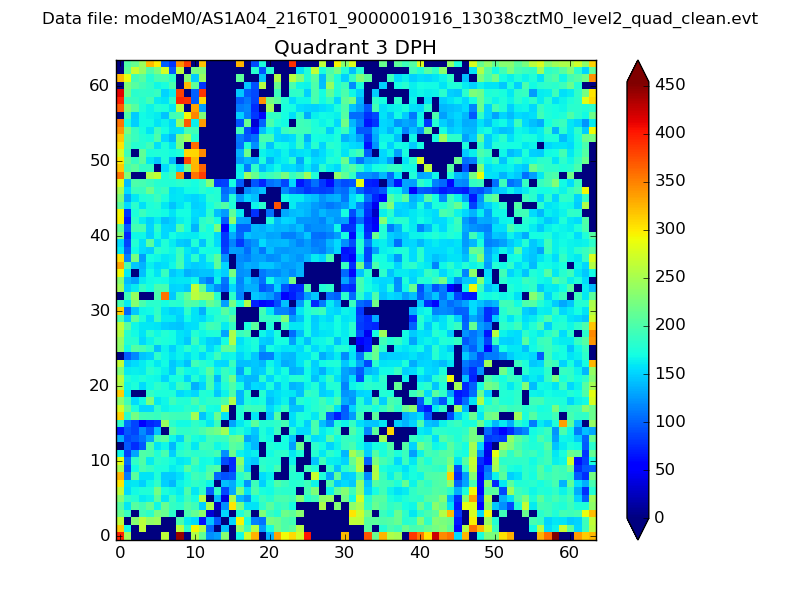 |
 |
Quadrant C |
| Plot type | Count rate plots | Images |
|---|---|---|
| Comparison with Poisson distribution Blue bars denote a histogram of data divided into 1 sec bins. Red curve is a Poisson curve with rate = median count rate of data. |
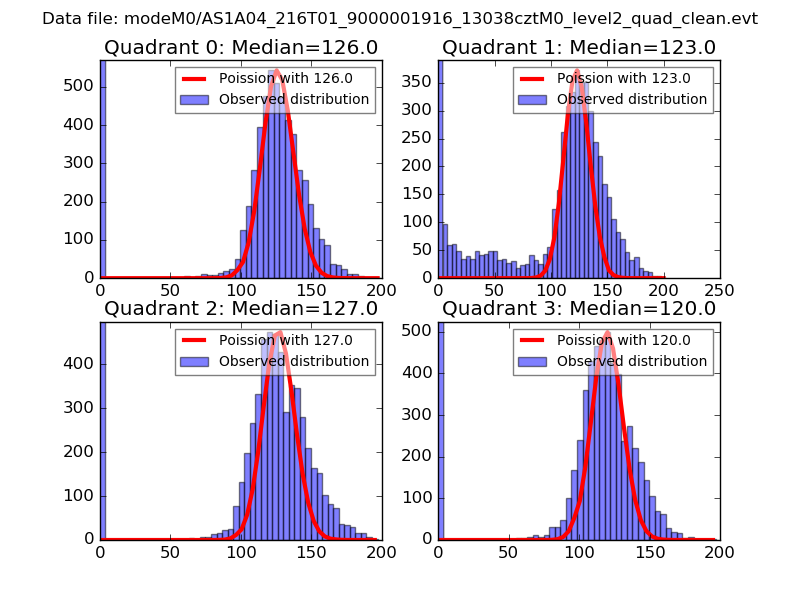 |
 |
| Quadrant-wise count rates Data is divided into 100 sec bins |
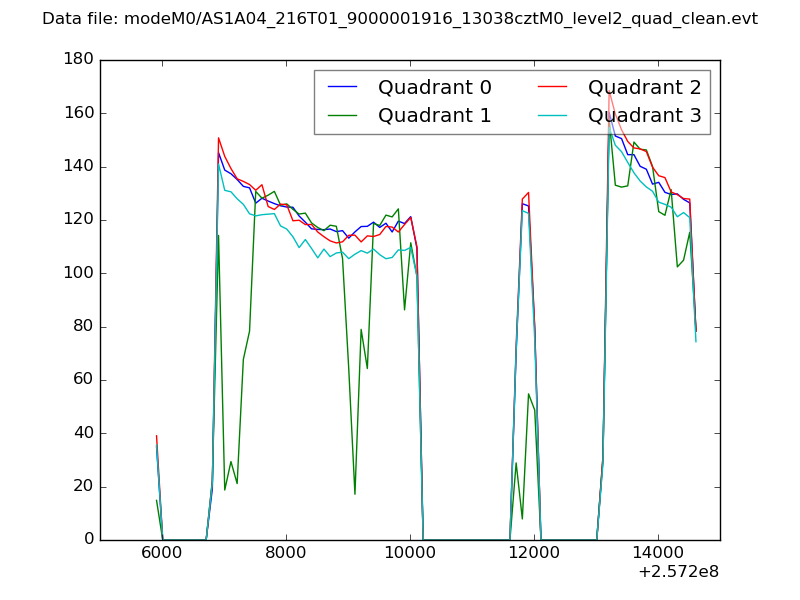 |
|
| Module-wise count rates for Quadrant A Data is divided into 100 sec bins |
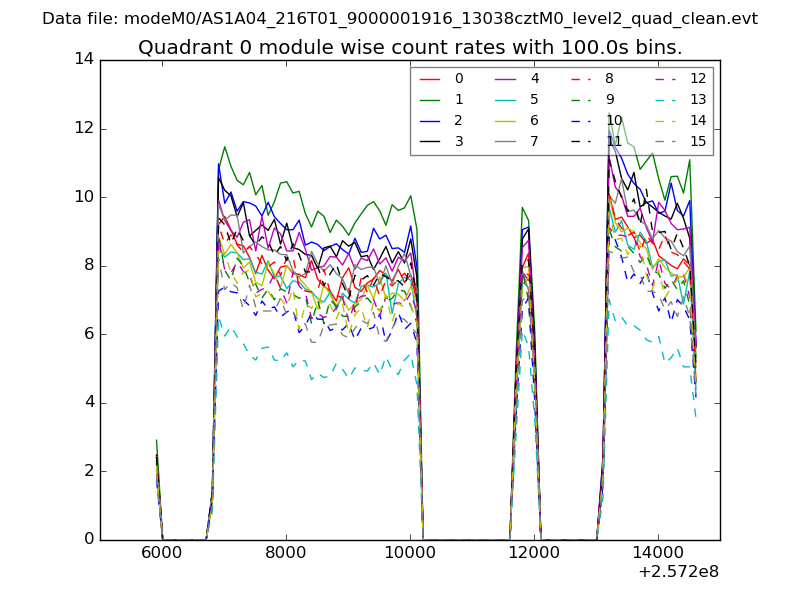 |
 |
| Module-wise count rates for Quadrant B Data is divided into 100 sec bins |
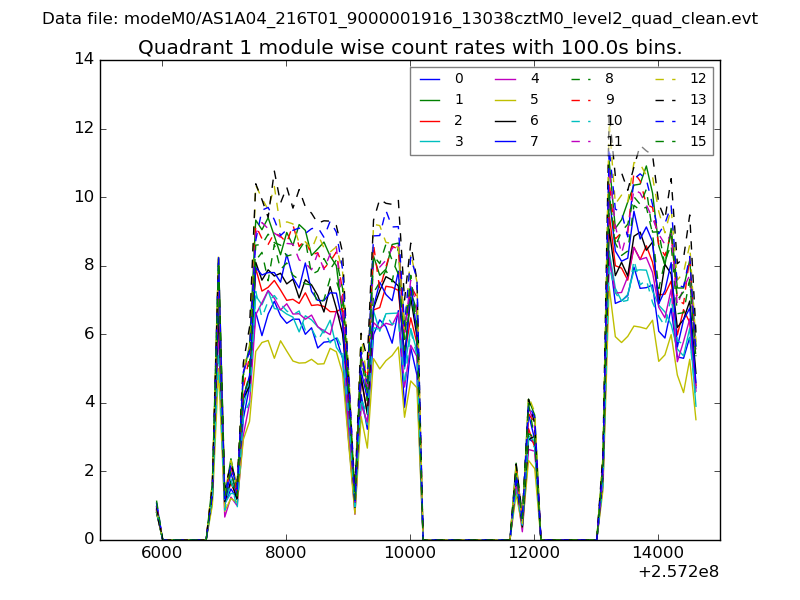 |
 |
| Module-wise count rates for Quadrant C Data is divided into 100 sec bins |
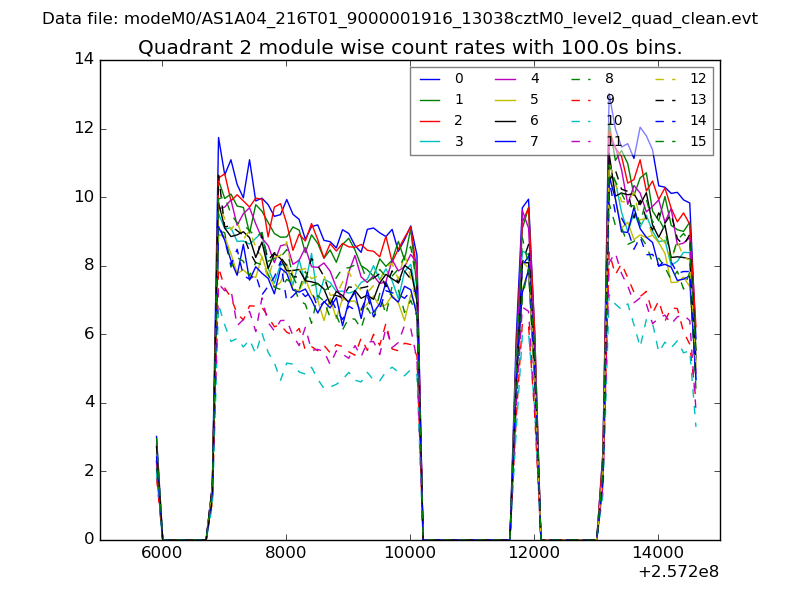 |
 |
| Module-wise count rates for Quadrant D Data is divided into 100 sec bins |
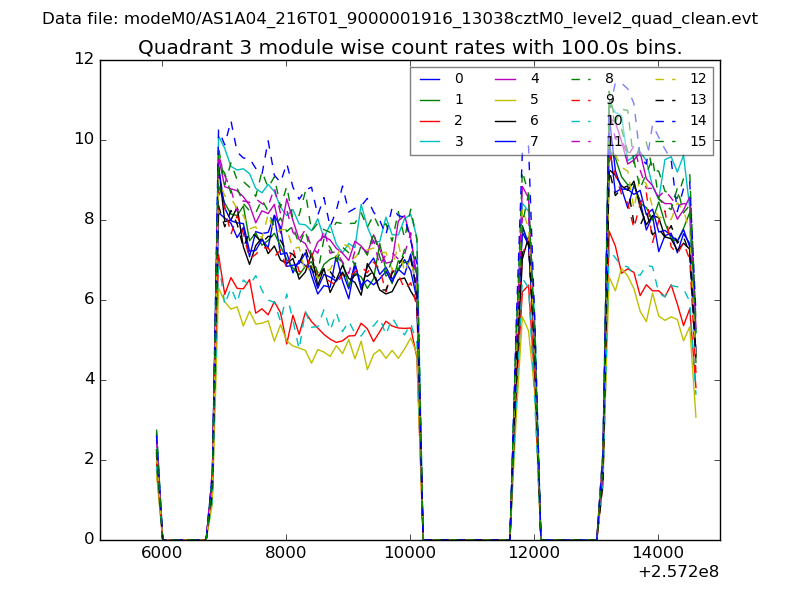 |
 |
| Parameter | Plot |
|---|---|
| CZT HV Monitor | 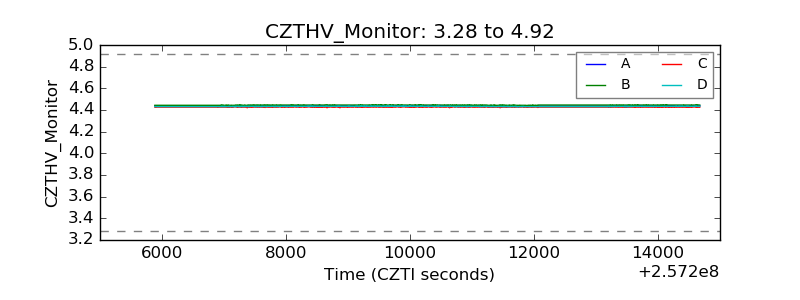 |
| D_VDD | 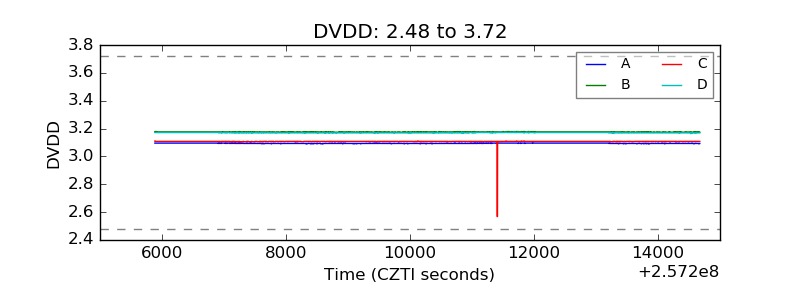 |
| Temperature 1 | 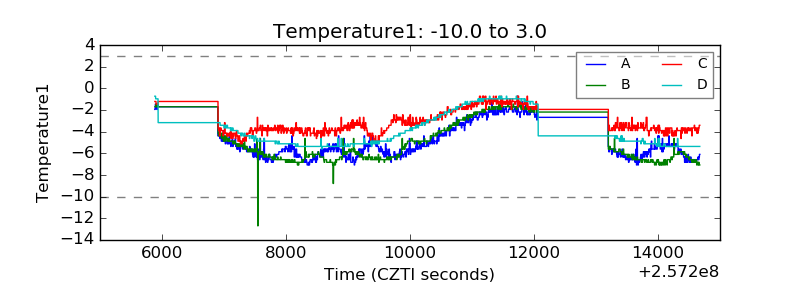 |
| Veto HV Monitor | 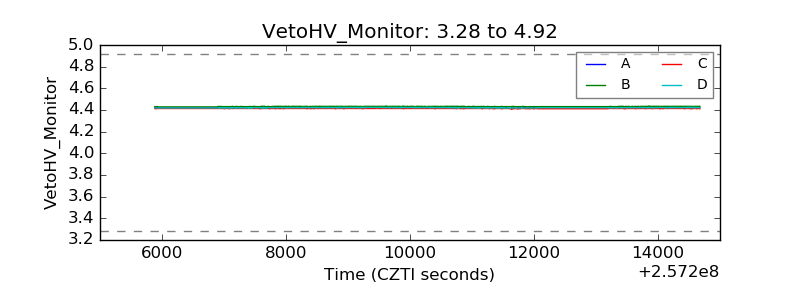 |
| Veto LLD | 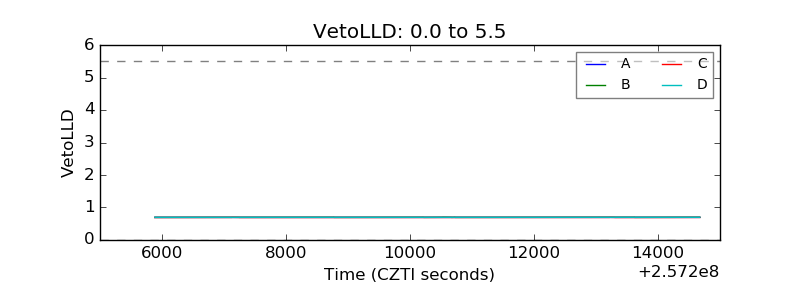 |
| Alpha Counter | 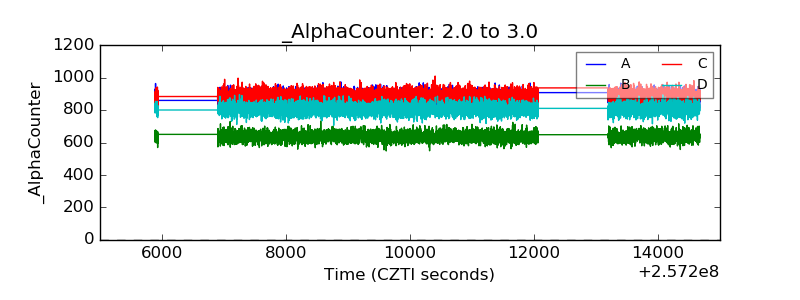 |
| _CPM_Rate | 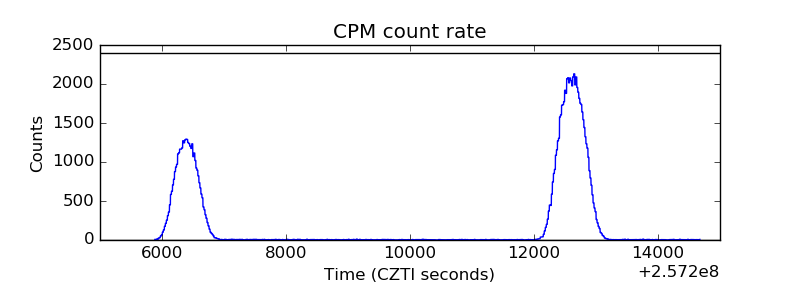 |
| CZT Counter | 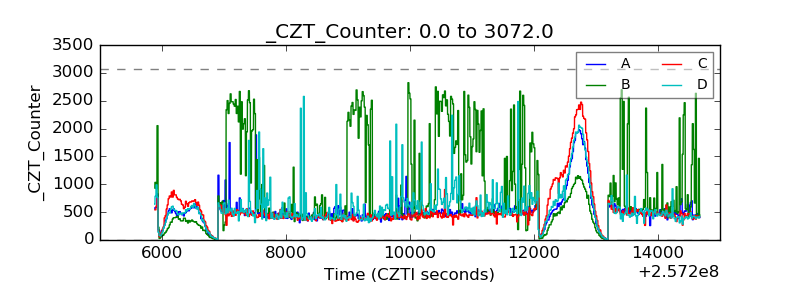 |
| +2.5 Volts monitor | 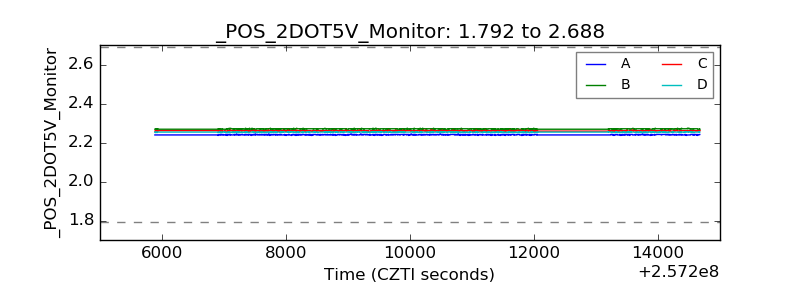 |
| +5 Volts monitor | 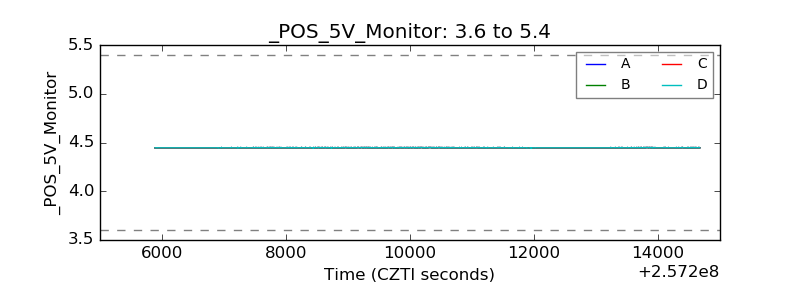 |
| _ROLL_ROT | 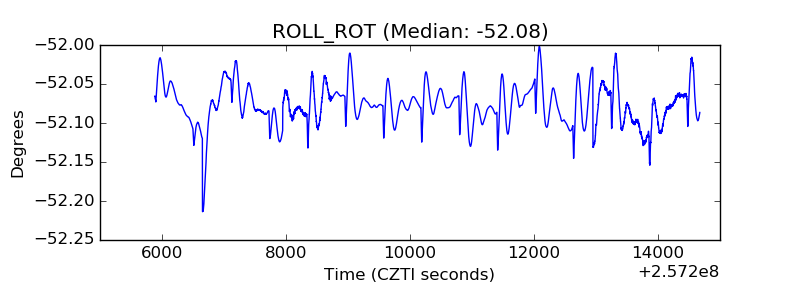 |
| _Roll_DEC | 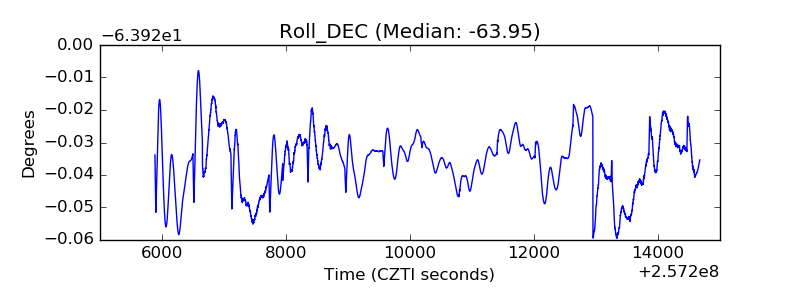 |
| _Roll_RA | 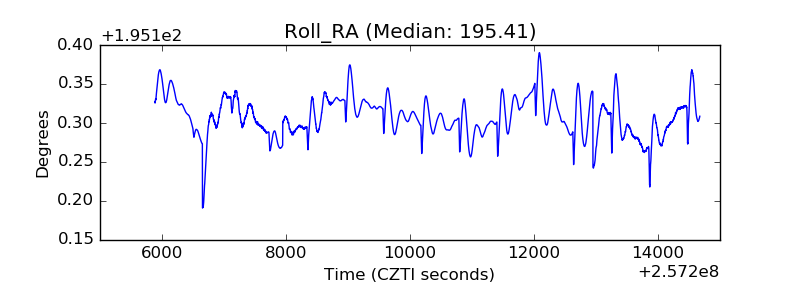 |
| Veto Counter | 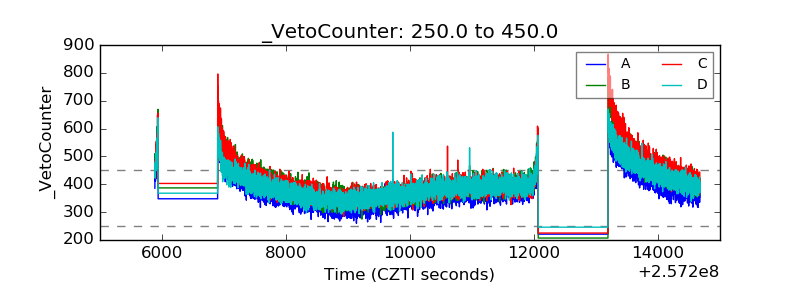 |