| Param | Original file | Final file |
|---|---|---|
| Filename | modeM0/AS1A04_216T01_9000001916_13039cztM0_level2.evt | modeM0/AS1A04_216T01_9000001916_13039cztM0_level2_quad_clean.evt |
| Size (bytes) | 498,461,760 | 103,147,200 |
| Size | 475.4 MB | 98.4 MB |
| Events in quadrant A | 3,239,043 | 676,045 |
| Events in quadrant B | 4,487,622 | 668,721 |
| Events in quadrant C | 3,047,469 | 687,445 |
| Events in quadrant D | 3,878,890 | 636,550 |
| Mode M9 | |||
|---|---|---|---|
| Quadrant | BADHDUFLAG | Total packets | Discarded packets |
| A | 0 | 14 | 0 |
| B | 0 | 14 | 0 |
| C | 0 | 14 | 0 |
| D | 0 | 15 | 0 |
| Mode SS | |||
|---|---|---|---|
| Quadrant | BADHDUFLAG | Total packets | Discarded packets |
| A | 0 | 134 | 0 |
| B | 0 | 134 | 0 |
| C | 0 | 134 | 0 |
| D | 0 | 134 | 0 |
| Mode M0 | |||
|---|---|---|---|
| Quadrant | BADHDUFLAG | Total packets | Discarded packets |
| A | 0 | 13789 | 3 |
| B | 0 | 17577 | 2 |
| C | 0 | 13306 | 2 |
| D | 0 | 16014 | 2 |
| Quadrant | Total seconds | Saturated seconds | Saturation percentage |
|---|---|---|---|
| A | 6517 | 12 | 0.184134% |
| B | 6517 | 477 | 7.319319% |
| C | 6517 | 5 | 0.076722% |
| D | 6517 | 252 | 3.866810% |
Noise dominated data is calculated using 1-second bins in cleaned event files. If a bin has >2000 counts, and if more than 50% of those come from <1% of pixels, then it is considered to be noise-dominated and hence unusable.
| Quadrant | # 1 sec bins | Bins with >0 counts | Bins with >2000 counts | High rate bins dominated by noise | Noise dominated (total time) | Noise dominated (detector-on time) | Marked lightcurve |
|---|---|---|---|---|---|---|---|
| A | 7743 | 6519 | 0 | 0 | 0.00% | 0.00% | 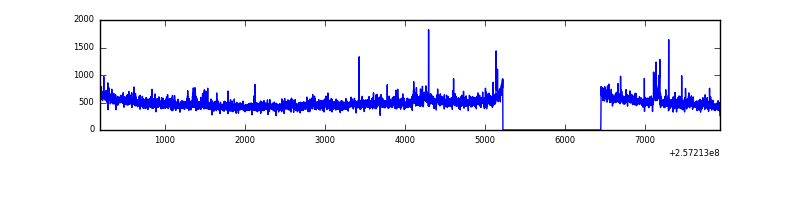 |
| B | 7743 | 6519 | 347 | 347 | 4.48% | 5.32% |  |
| C | 7743 | 6519 | 0 | 0 | 0.00% | 0.00% | 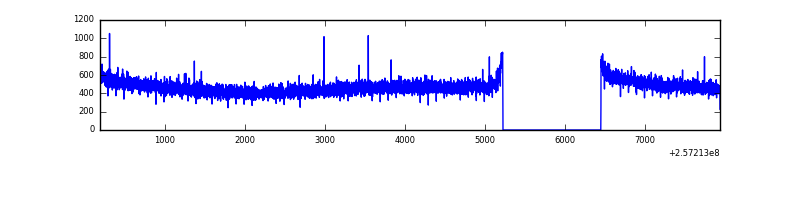 |
| D | 7743 | 6519 | 199 | 199 | 2.57% | 3.05% | 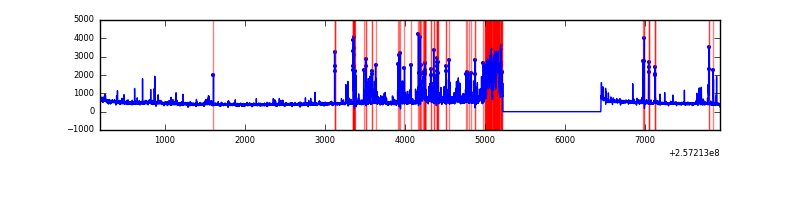 |
Top three noisy pixels from each quadrant. If the there are fewer than three noisy pixels in the level2.evt file, extra rows are filled as -1
| Pixel properties | Quadrant properties | ||||||
|---|---|---|---|---|---|---|---|
| Quadrant | DetID | PixID | Counts | Sigma | Mean | Median | Sigma |
| A | 12 | 189 | 99923 | 625.22 | 780 | 763 | 158.6 |
| A | 1 | 162 | 58582 | 364.56 | 780 | 763 | 158.6 |
| A | 1 | 178 | 23180 | 141.34 | 780 | 763 | 158.6 |
| B | 4 | 239 | 1102371 | 7813.53 | 761 | 742 | 141.0 |
| B | 0 | 85 | 197671 | 1396.76 | 761 | 742 | 141.0 |
| B | 3 | 64 | 107246 | 755.4 | 761 | 742 | 141.0 |
| C | 13 | 61 | 5760 | 27.93 | 780 | 785 | 178.1 |
| C | 8 | 222 | 3040 | 12.66 | 780 | 785 | 178.1 |
| C | 14 | 234 | 2651 | 10.48 | 780 | 785 | 178.1 |
| D | 1 | 52 | 605324 | 3370.88 | 750 | 730 | 179.4 |
| D | 14 | 34 | 323188 | 1797.85 | 750 | 730 | 179.4 |
| D | 8 | 195 | 69219 | 381.86 | 750 | 730 | 179.4 |
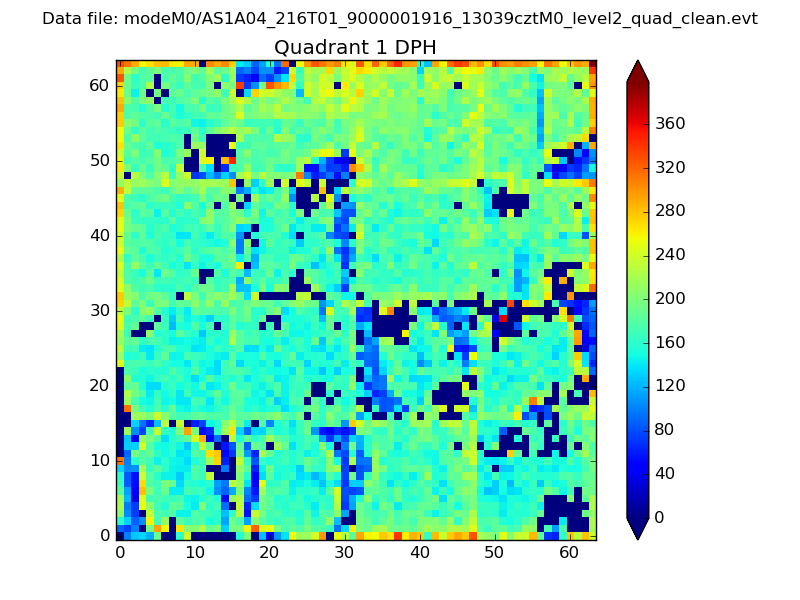
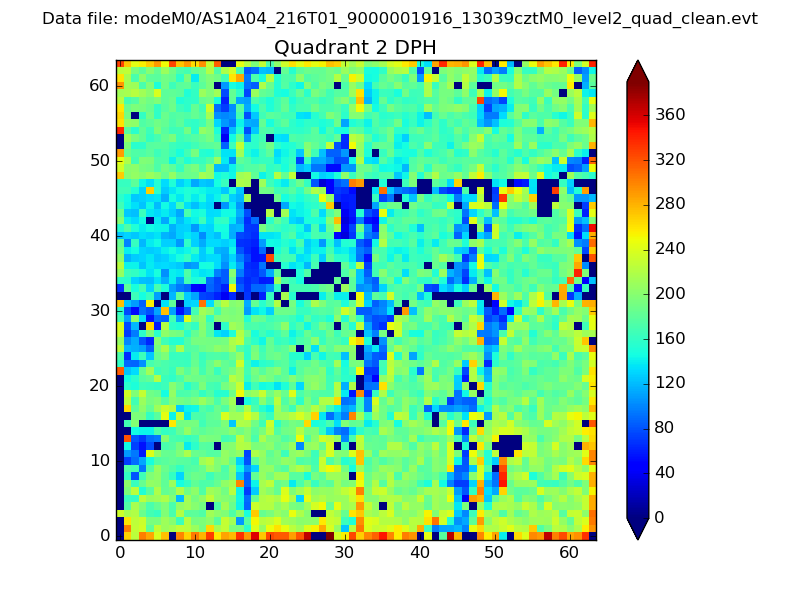
Histogram calculated using DETX and DETY for each event in the final _common_clean file
| Quadrant A |  |
 |
Quadrant B |
|---|---|---|---|
| Quadrant D | 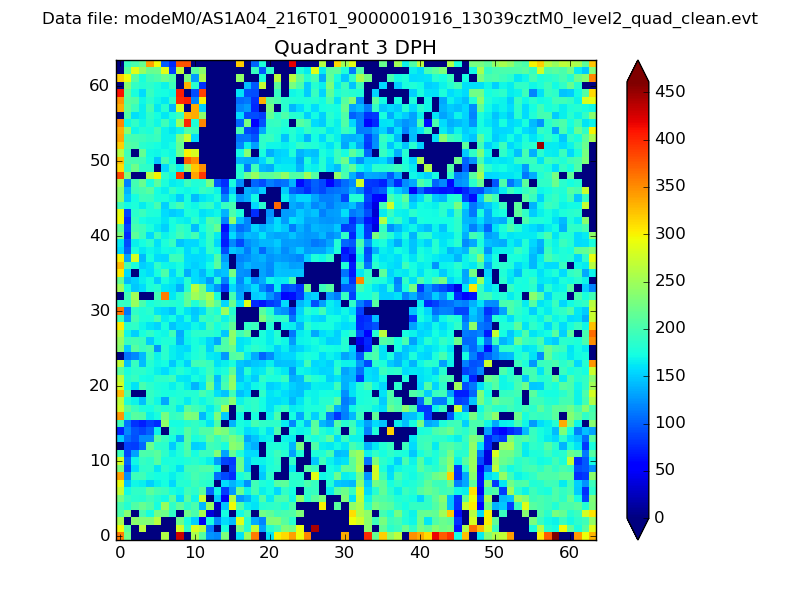 |
 |
Quadrant C |
| Plot type | Count rate plots | Images |
|---|---|---|
| Comparison with Poisson distribution Blue bars denote a histogram of data divided into 1 sec bins. Red curve is a Poisson curve with rate = median count rate of data. |
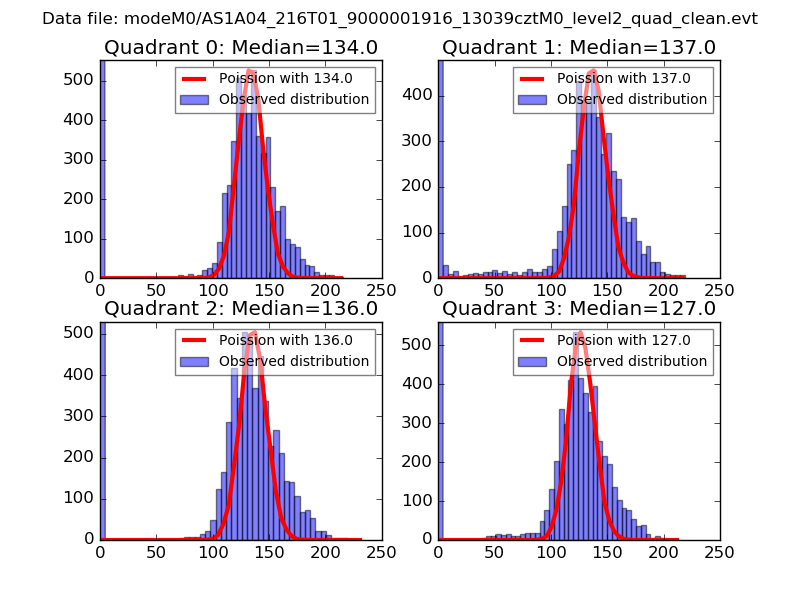 |
 |
| Quadrant-wise count rates Data is divided into 100 sec bins |
 |
|
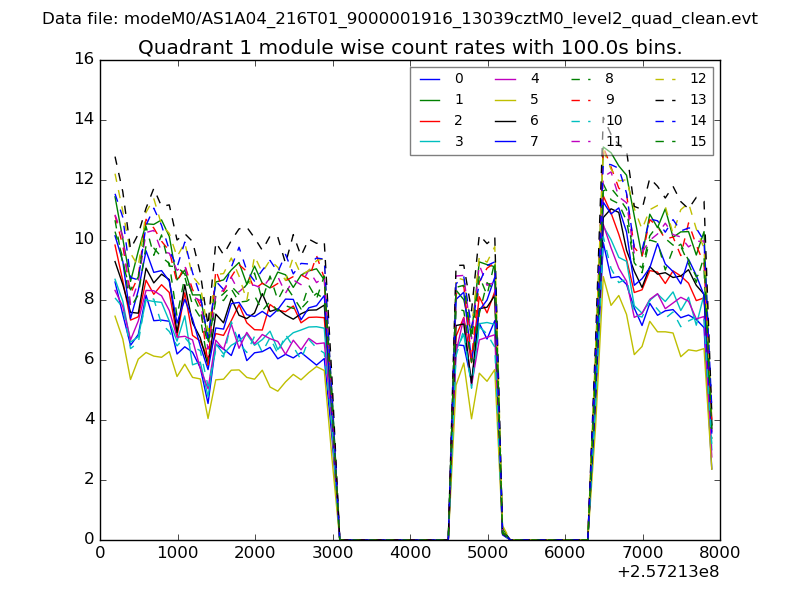
| Module-wise count rates for Quadrant A Data is divided into 100 sec bins |
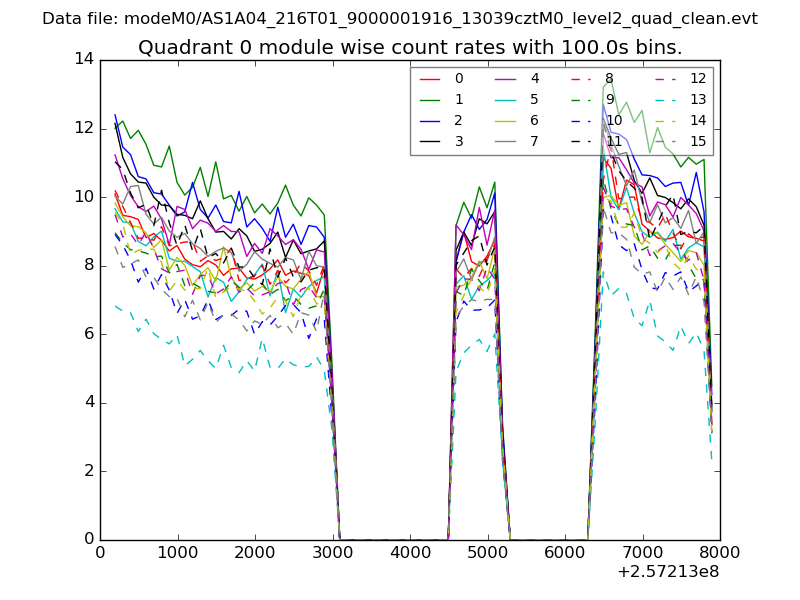 |
 |
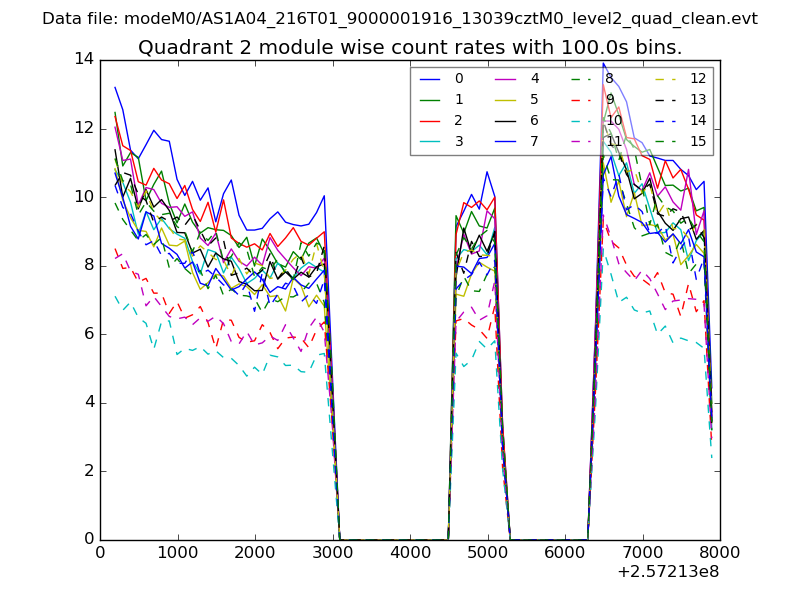
| Module-wise count rates for Quadrant B Data is divided into 100 sec bins |
 |
 |
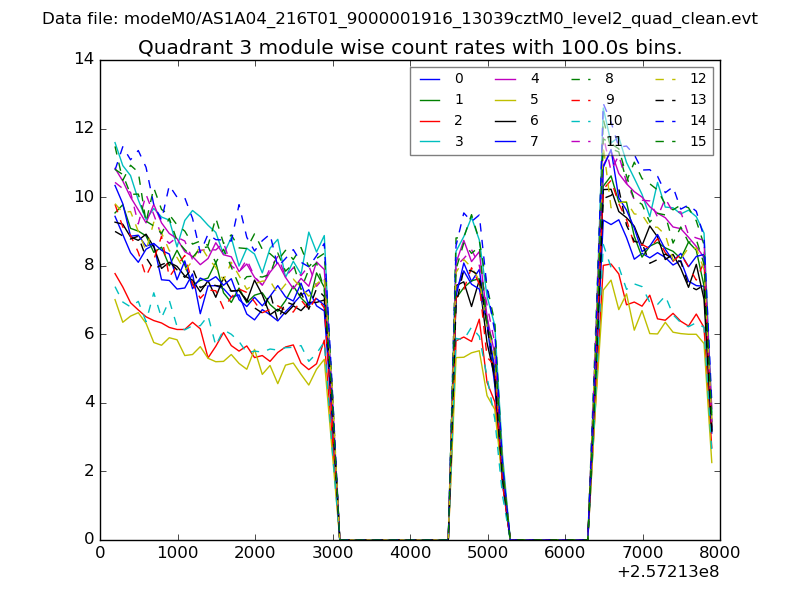
| Module-wise count rates for Quadrant C Data is divided into 100 sec bins |
 |
 |
| Module-wise count rates for Quadrant D Data is divided into 100 sec bins |
 |
 |
| Parameter | Plot |
|---|---|
| CZT HV Monitor | 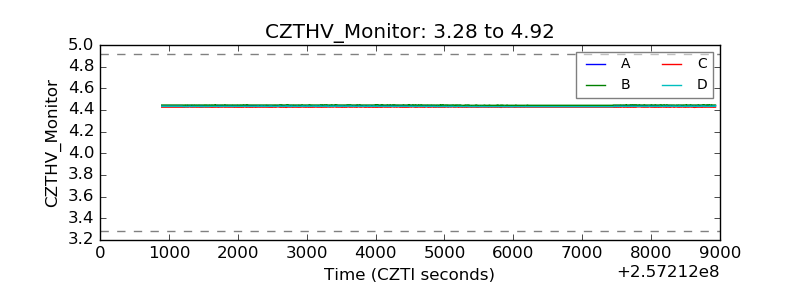 |
| D_VDD | 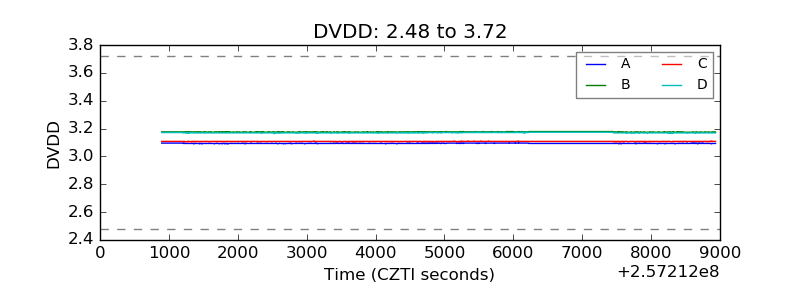 |
| Temperature 1 | 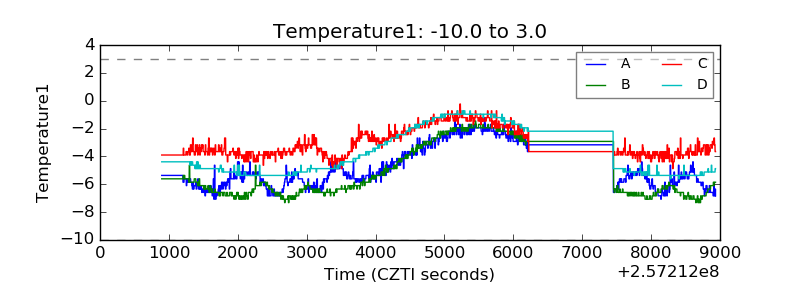 |
| Veto HV Monitor |  |
| Veto LLD |  |
| Alpha Counter | 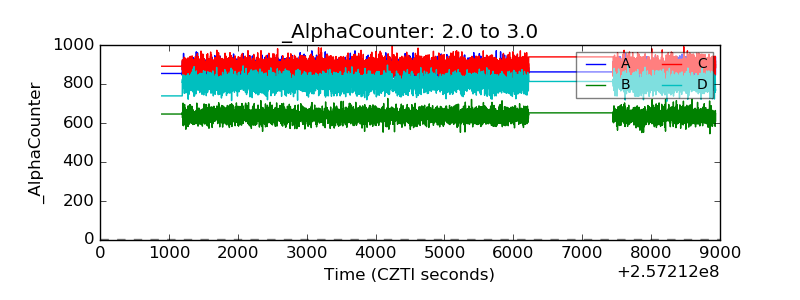 |
| _CPM_Rate | 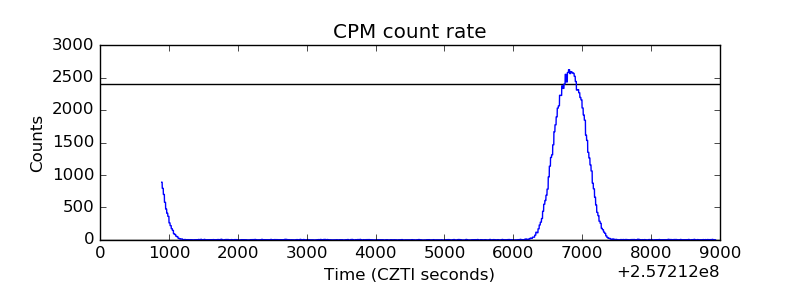 |
| CZT Counter | 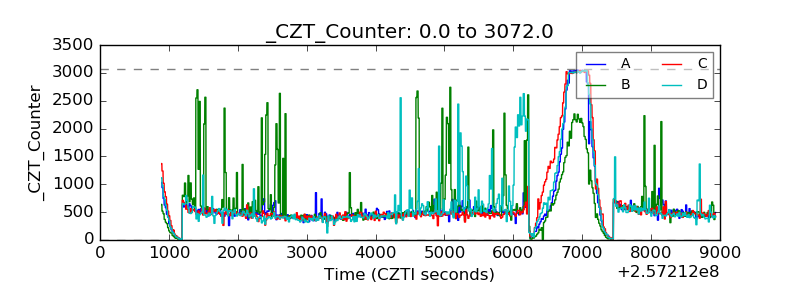 |
| +2.5 Volts monitor |  |
| +5 Volts monitor |  |
| _ROLL_ROT | 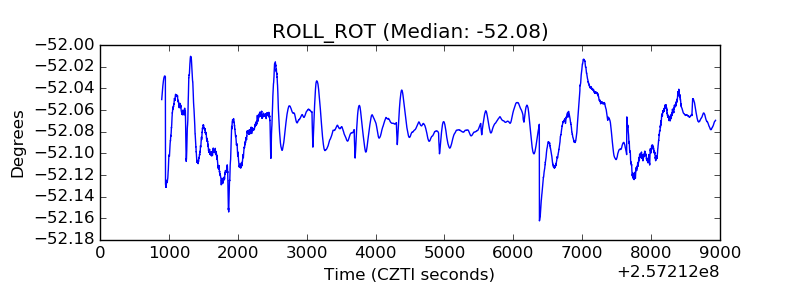 |
| _Roll_DEC | 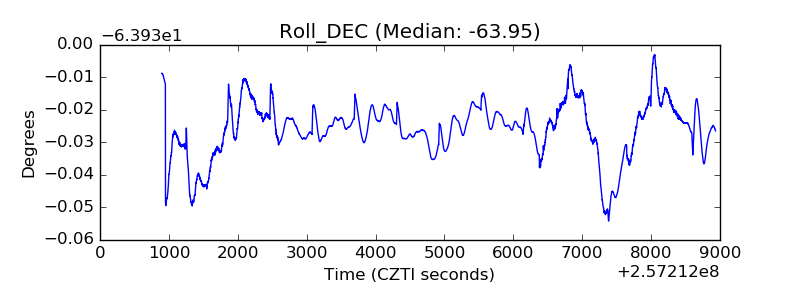 |
| _Roll_RA |  |
| Veto Counter | 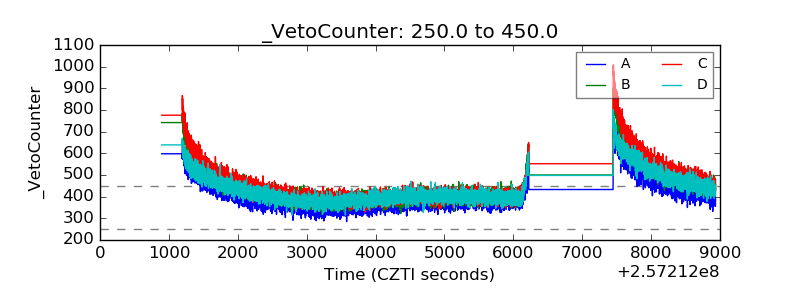 |