| Param | Original file | Final file |
|---|---|---|
| Filename | modeM0/AS1A04_216T01_9000001916_13041cztM0_level2.evt | modeM0/AS1A04_216T01_9000001916_13041cztM0_level2_quad_clean.evt |
| Size (bytes) | 490,677,120 | 104,679,360 |
| Size | 467.9 MB | 99.8 MB |
| Events in quadrant A | 3,330,672 | 686,153 |
| Events in quadrant B | 4,063,625 | 697,665 |
| Events in quadrant C | 3,081,895 | 702,194 |
| Events in quadrant D | 3,960,948 | 648,914 |
| Mode M9 | |||
|---|---|---|---|
| Quadrant | BADHDUFLAG | Total packets | Discarded packets |
| A | 0 | 20 | 0 |
| B | 0 | 20 | 0 |
| C | 0 | 20 | 0 |
| D | 0 | 21 | 0 |
| Mode SS | |||
|---|---|---|---|
| Quadrant | BADHDUFLAG | Total packets | Discarded packets |
| A | 0 | 128 | 0 |
| B | 0 | 128 | 0 |
| C | 0 | 128 | 0 |
| D | 0 | 128 | 0 |
| Mode M0 | |||
|---|---|---|---|
| Quadrant | BADHDUFLAG | Total packets | Discarded packets |
| A | 0 | 13629 | 3 |
| B | 0 | 16040 | 2 |
| C | 0 | 12924 | 2 |
| D | 0 | 15824 | 2 |
| Quadrant | Total seconds | Saturated seconds | Saturation percentage |
|---|---|---|---|
| A | 6230 | 73 | 1.171750% |
| B | 6230 | 273 | 4.382022% |
| C | 6230 | 50 | 0.802568% |
| D | 6230 | 165 | 2.648475% |
Noise dominated data is calculated using 1-second bins in cleaned event files. If a bin has >2000 counts, and if more than 50% of those come from <1% of pixels, then it is considered to be noise-dominated and hence unusable.
| Quadrant | # 1 sec bins | Bins with >0 counts | Bins with >2000 counts | High rate bins dominated by noise | Noise dominated (total time) | Noise dominated (detector-on time) | Marked lightcurve |
|---|---|---|---|---|---|---|---|
| A | 7546 | 6232 | 22 | 22 | 0.29% | 0.35% | 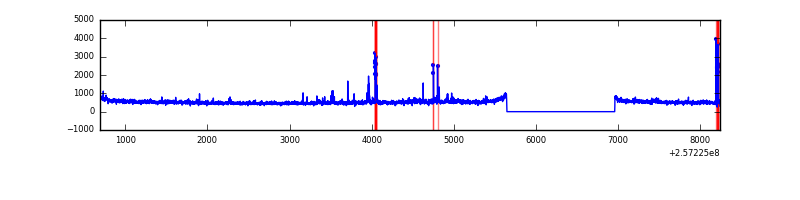 |
| B | 7546 | 6232 | 131 | 131 | 1.74% | 2.10% | 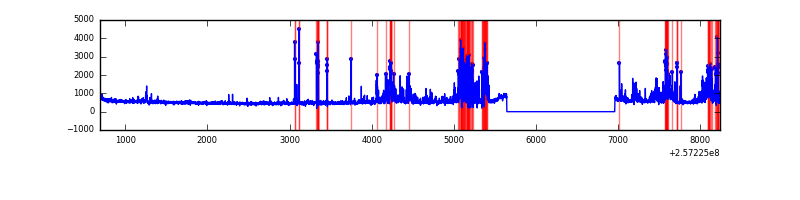 |
| C | 7546 | 6232 | 0 | 0 | 0.00% | 0.00% | 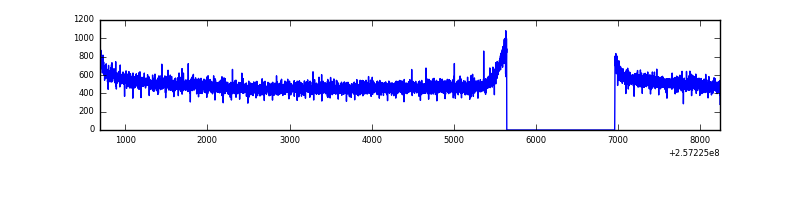 |
| D | 7546 | 6232 | 110 | 110 | 1.46% | 1.77% | 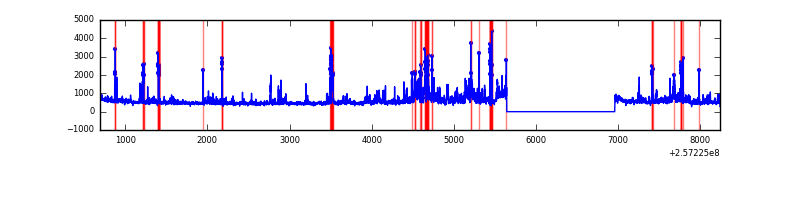 |
Top three noisy pixels from each quadrant. If the there are fewer than three noisy pixels in the level2.evt file, extra rows are filled as -1
| Pixel properties | Quadrant properties | ||||||
|---|---|---|---|---|---|---|---|
| Quadrant | DetID | PixID | Counts | Sigma | Mean | Median | Sigma |
| A | 12 | 189 | 84577 | 539.94 | 785 | 772 | 155.2 |
| A | 1 | 162 | 53877 | 342.15 | 785 | 772 | 155.2 |
| A | 15 | 223 | 52574 | 333.75 | 785 | 772 | 155.2 |
| B | 4 | 239 | 450457 | 3122.13 | 785 | 767 | 144.0 |
| B | 3 | 64 | 412492 | 2858.55 | 785 | 767 | 144.0 |
| B | 0 | 85 | 68197 | 468.16 | 785 | 767 | 144.0 |
| C | 13 | 61 | 5752 | 27.67 | 789 | 794 | 179.2 |
| C | 1 | 5 | 2146 | 7.55 | 789 | 794 | 179.2 |
| C | 8 | 222 | 1915 | 6.26 | 789 | 794 | 179.2 |
| D | 1 | 52 | 604721 | 3357.64 | 767 | 747 | 179.9 |
| D | 8 | 195 | 435871 | 2418.96 | 767 | 747 | 179.9 |
| D | 2 | 234 | 24650 | 132.88 | 767 | 747 | 179.9 |
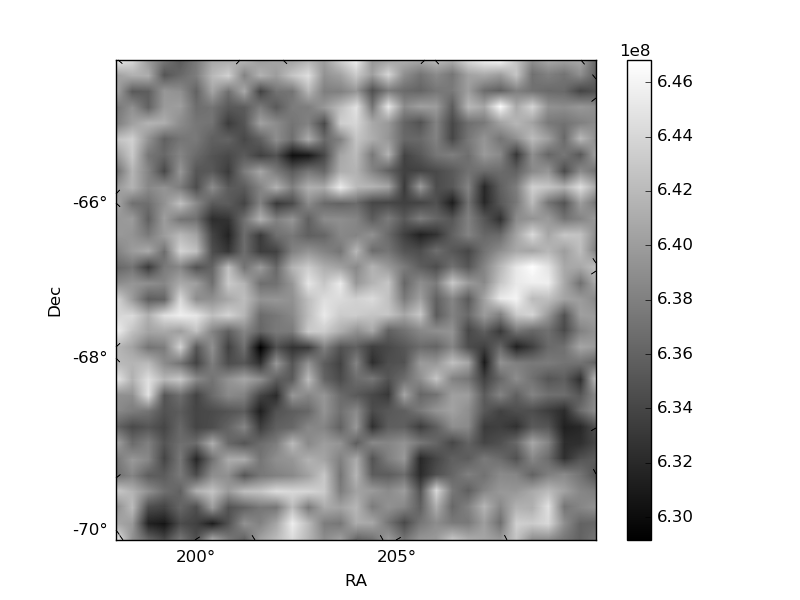
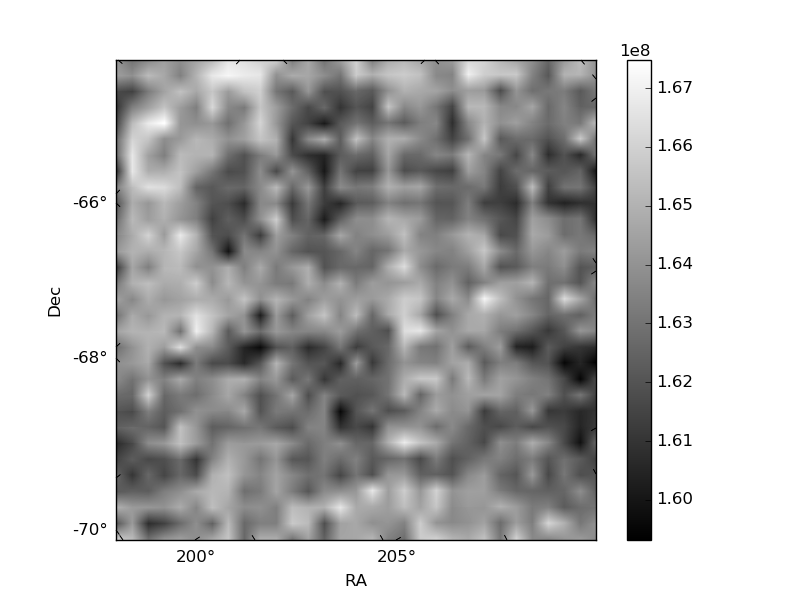
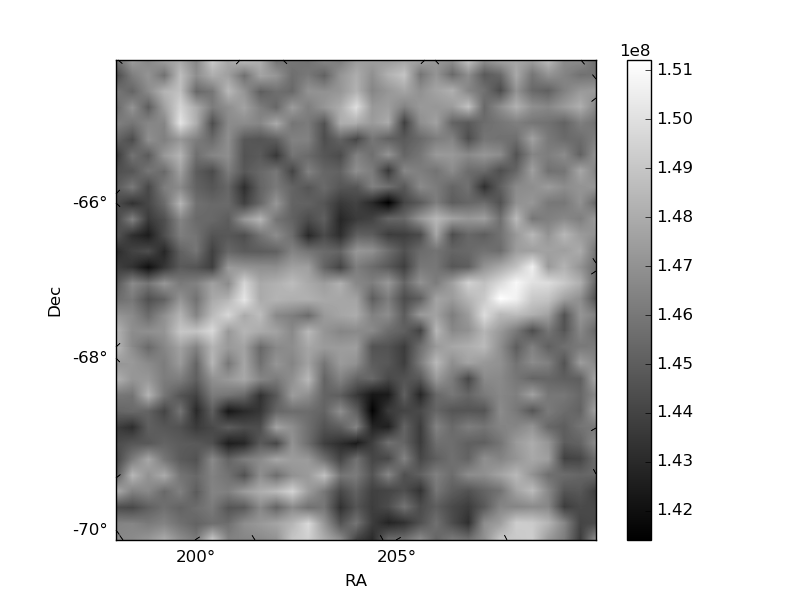
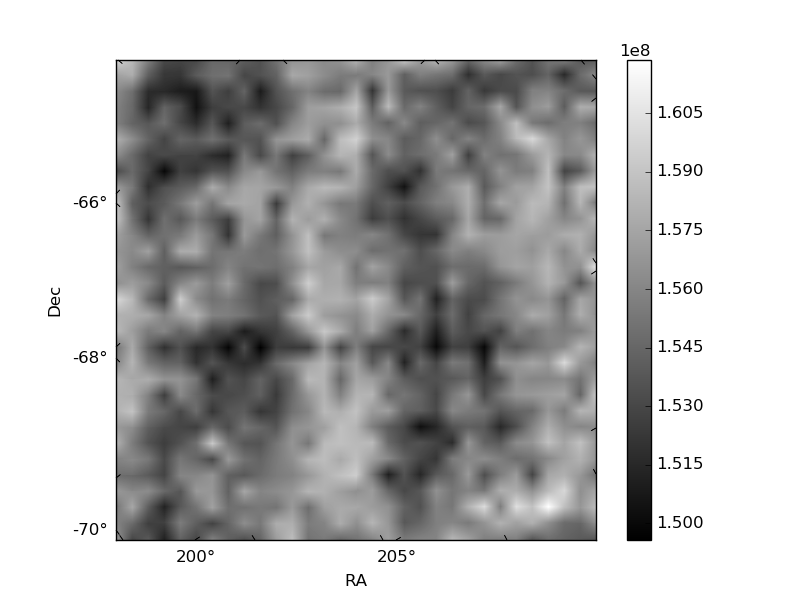
Histogram calculated using DETX and DETY for each event in the final _common_clean file
| Quadrant A | 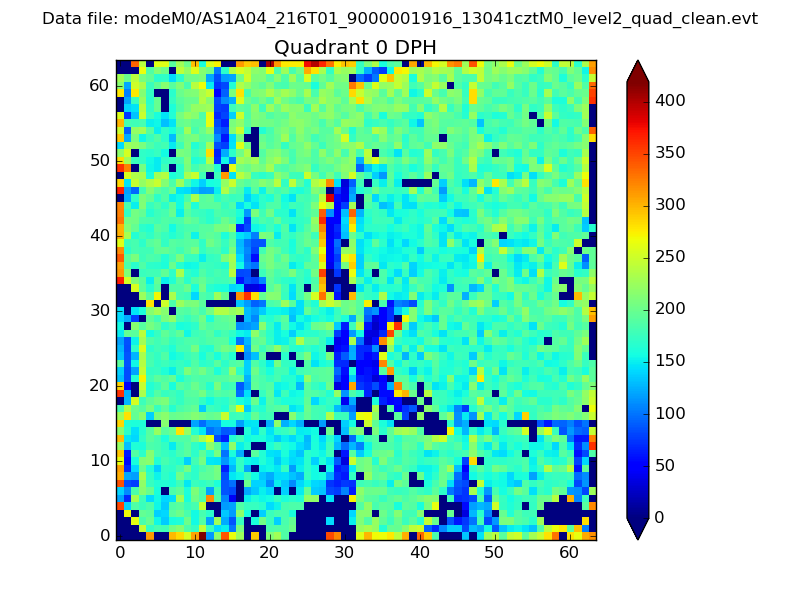 |
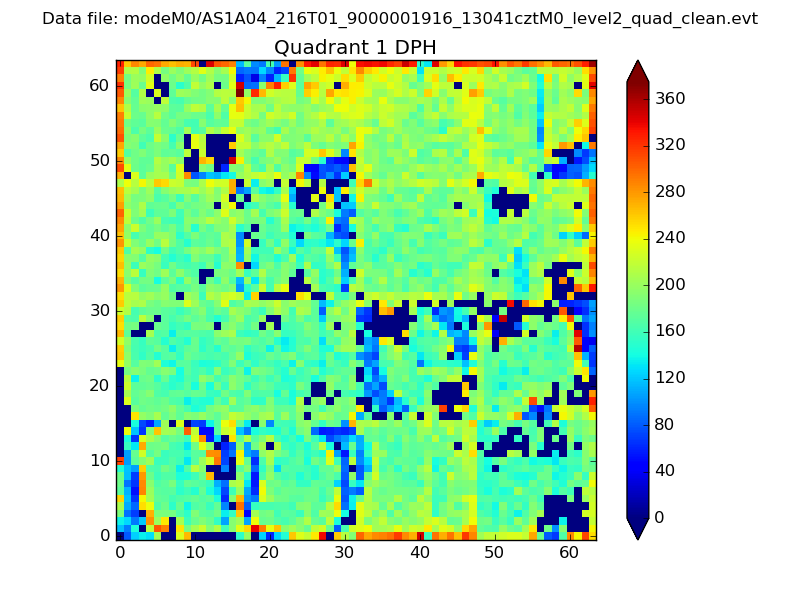 |
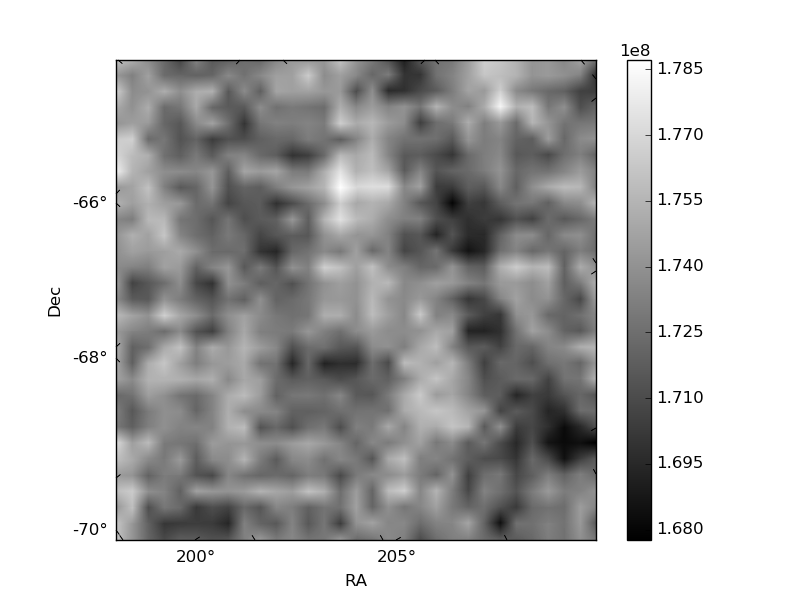
Quadrant B |
|---|---|---|---|
| Quadrant D | 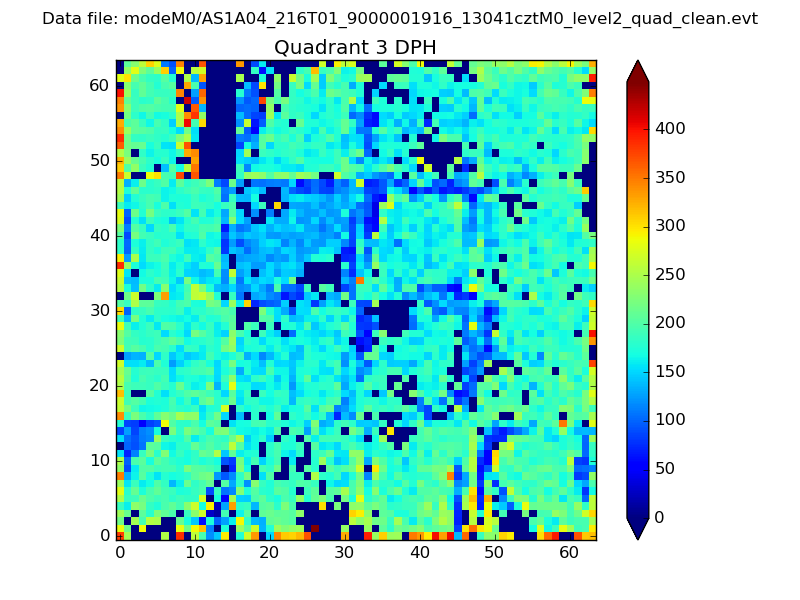 |
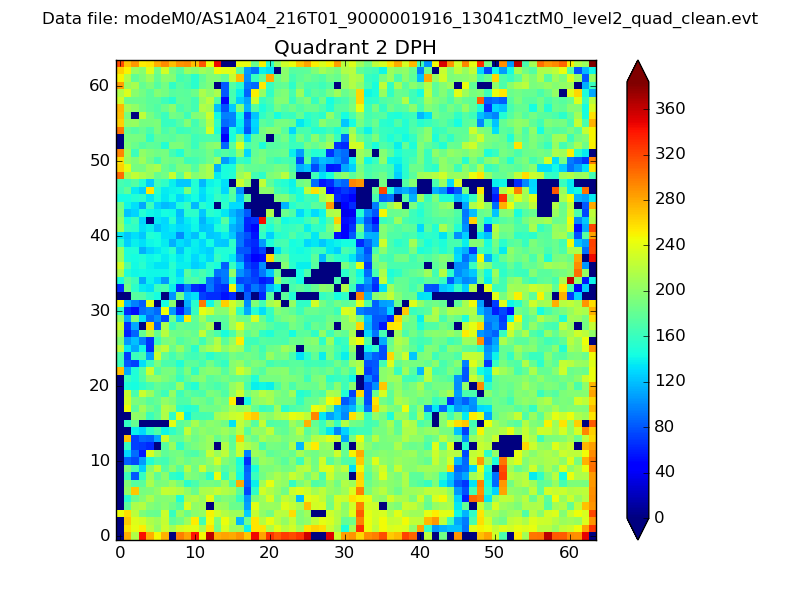 |
Quadrant C |
| Plot type | Count rate plots | Images |
|---|---|---|
| Comparison with Poisson distribution Blue bars denote a histogram of data divided into 1 sec bins. Red curve is a Poisson curve with rate = median count rate of data. |
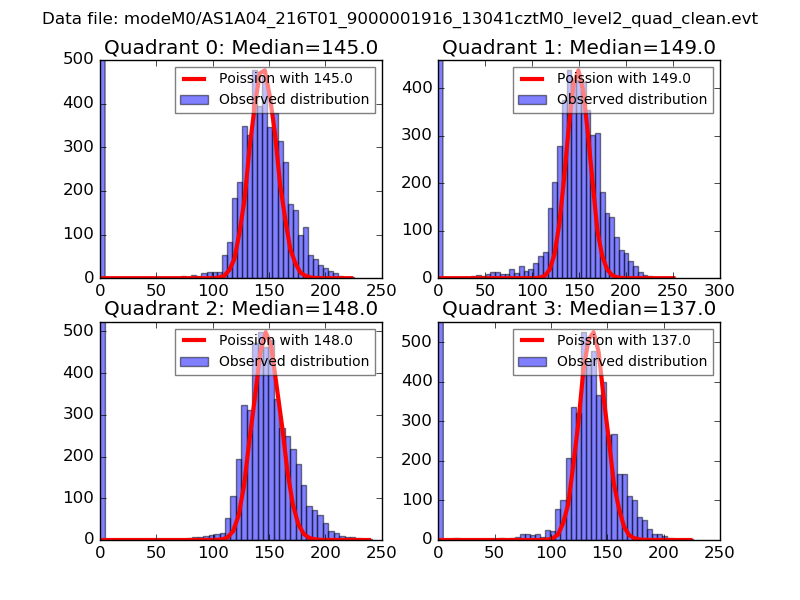 |
 |
| Quadrant-wise count rates Data is divided into 100 sec bins |
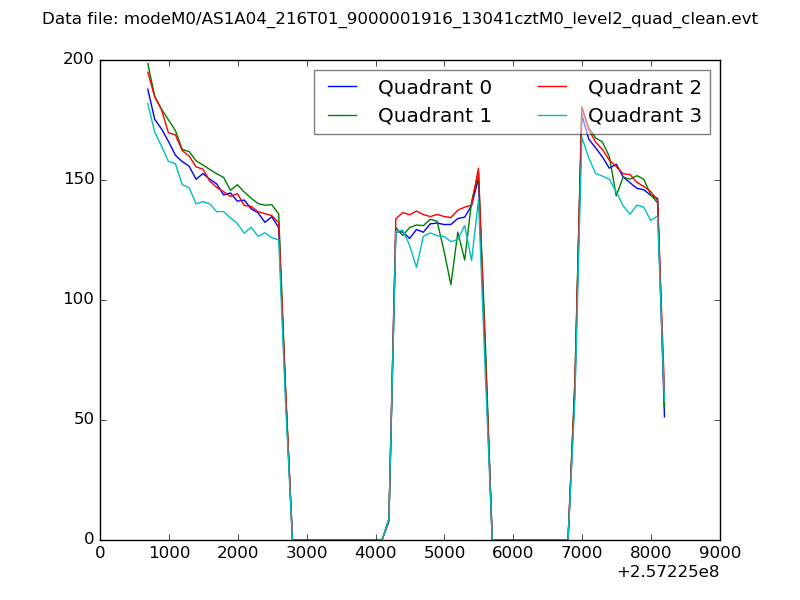 |
|
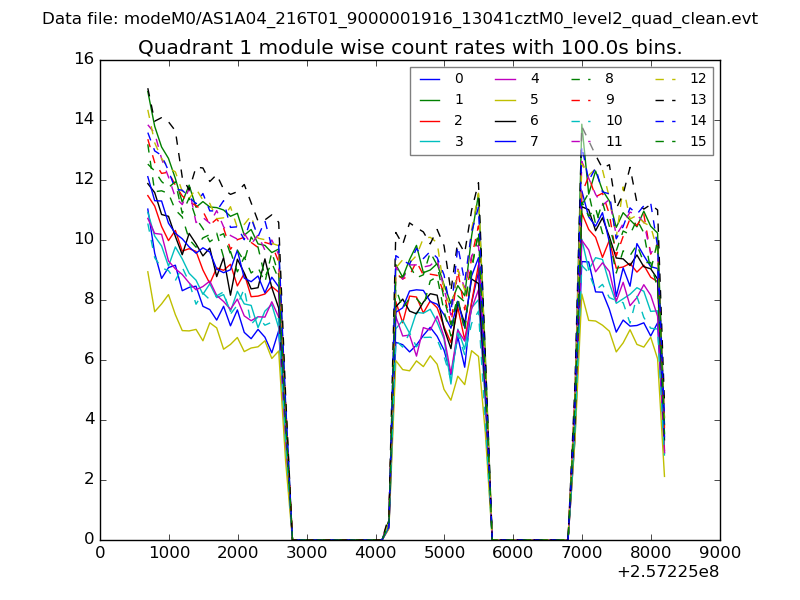
| Module-wise count rates for Quadrant A Data is divided into 100 sec bins |
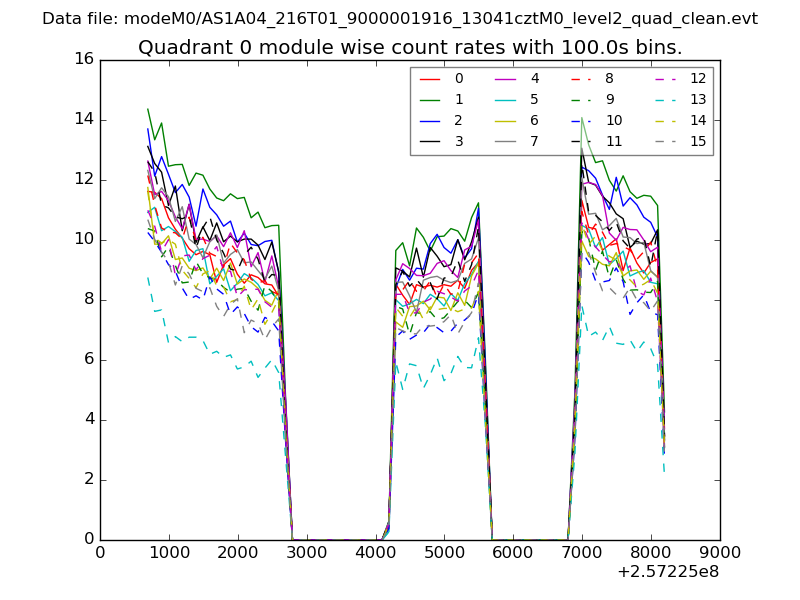 |
 |
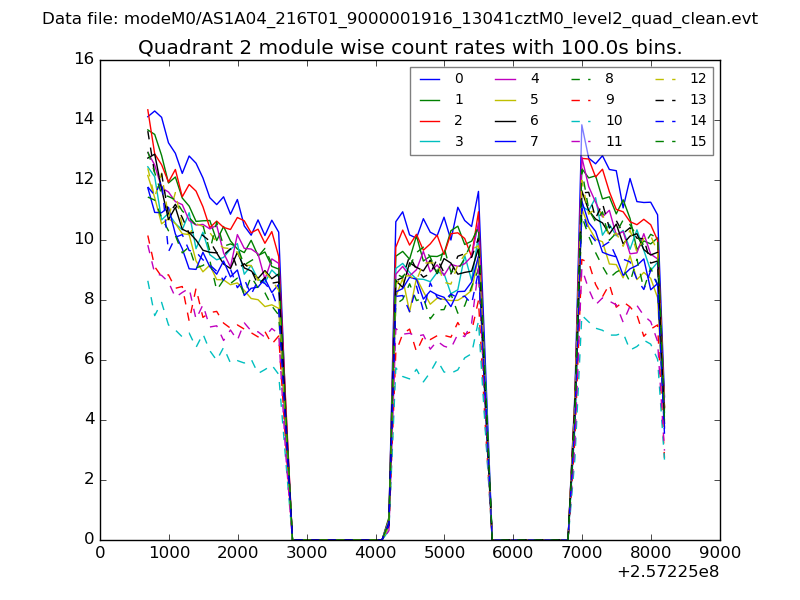
| Module-wise count rates for Quadrant B Data is divided into 100 sec bins |
 |
 |
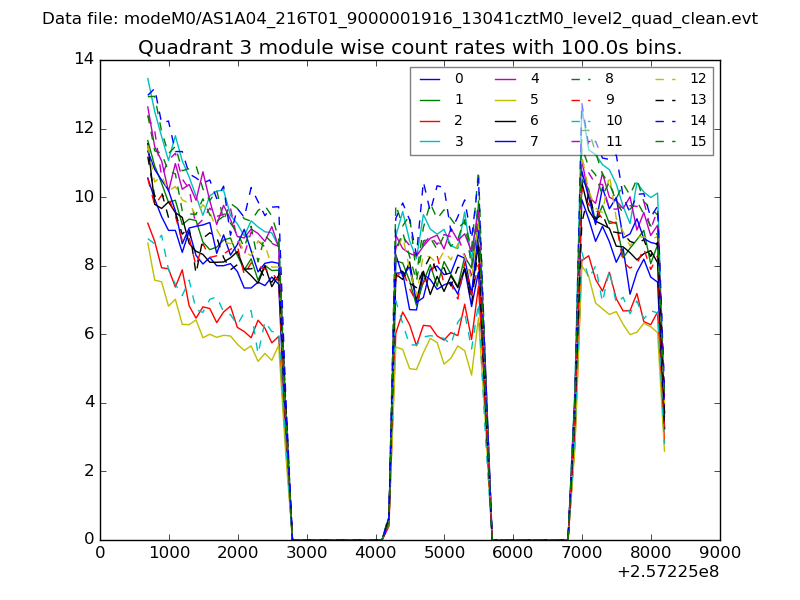
| Module-wise count rates for Quadrant C Data is divided into 100 sec bins |
 |
 |
| Module-wise count rates for Quadrant D Data is divided into 100 sec bins |
 |
 |
| Parameter | Plot |
|---|---|
| CZT HV Monitor | 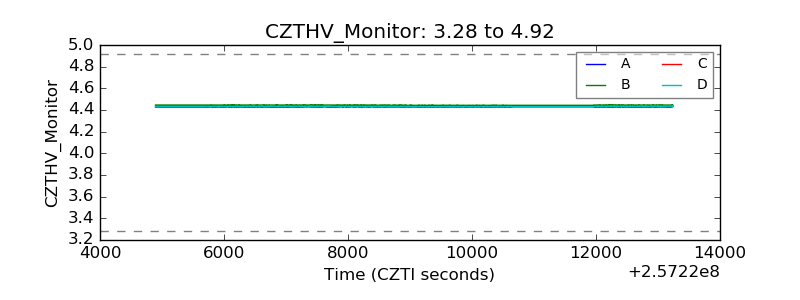 |
| D_VDD | 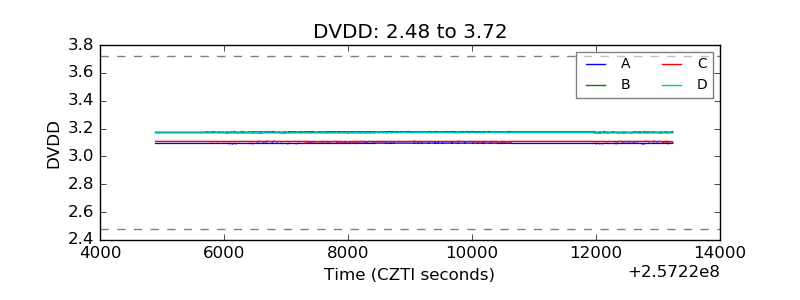 |
| Temperature 1 | 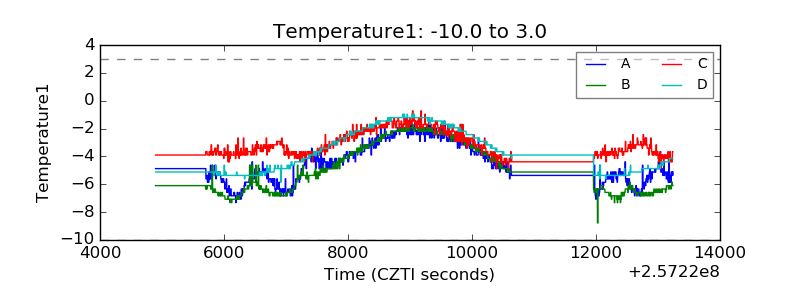 |
| Veto HV Monitor |  |
| Veto LLD | 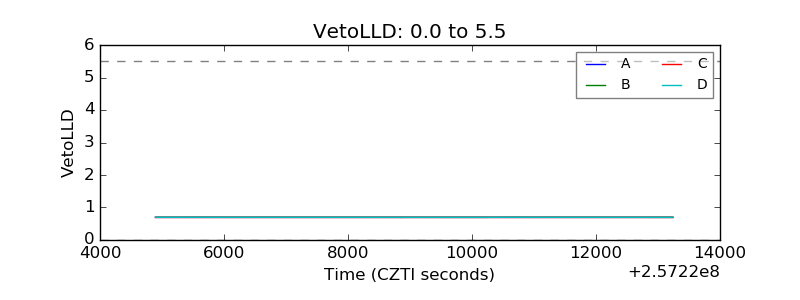 |
| Alpha Counter | 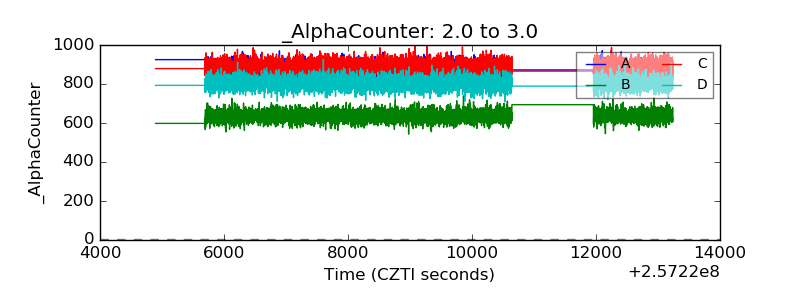 |
| _CPM_Rate |  |
| CZT Counter | 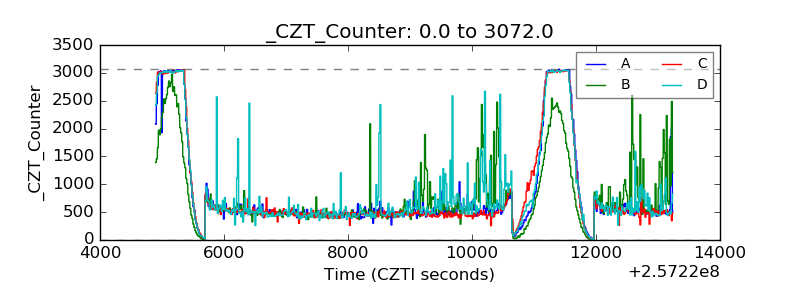 |
| +2.5 Volts monitor |  |
| +5 Volts monitor |  |
| _ROLL_ROT | 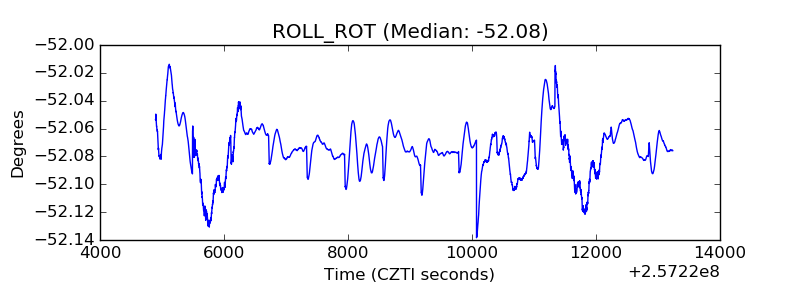 |
| _Roll_DEC | 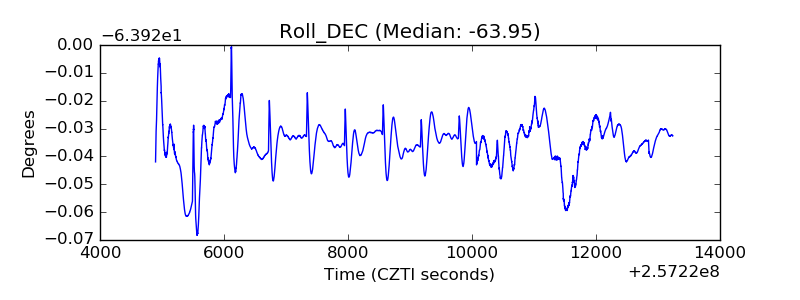 |
| _Roll_RA | 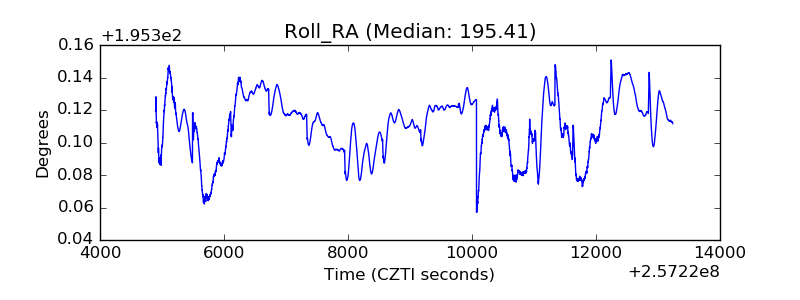 |
| Veto Counter | 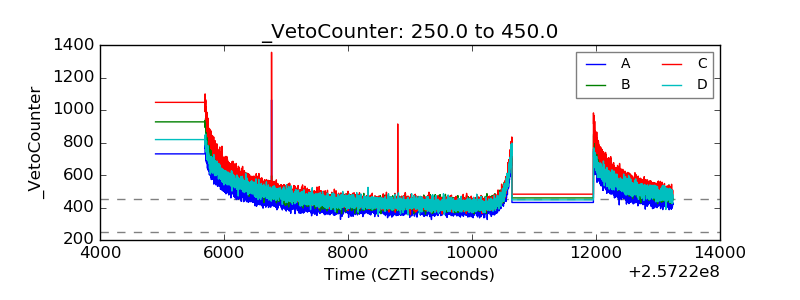 |