| Param | Original file | Final file |
|---|---|---|
| Filename | modeM0/AS1A04_216T01_9000001916_13042cztM0_level2.evt | modeM0/AS1A04_216T01_9000001916_13042cztM0_level2_quad_clean.evt |
| Size (bytes) | 527,296,320 | 92,571,840 |
| Size | 502.9 MB | 88.3 MB |
| Events in quadrant A | 3,197,454 | 608,168 |
| Events in quadrant B | 5,580,205 | 579,565 |
| Events in quadrant C | 2,866,973 | 618,535 |
| Events in quadrant D | 3,921,219 | 581,473 |
| Mode M9 | |||
|---|---|---|---|
| Quadrant | BADHDUFLAG | Total packets | Discarded packets |
| A | 0 | 12 | 0 |
| B | 0 | 12 | 0 |
| C | 0 | 12 | 0 |
| D | 0 | 12 | 0 |
| Mode SS | |||
|---|---|---|---|
| Quadrant | BADHDUFLAG | Total packets | Discarded packets |
| A | 0 | 120 | 0 |
| B | 0 | 120 | 0 |
| C | 0 | 120 | 0 |
| D | 0 | 120 | 0 |
| Mode M0 | |||
|---|---|---|---|
| Quadrant | BADHDUFLAG | Total packets | Discarded packets |
| A | 0 | 13071 | 2 |
| B | 0 | 20353 | 1 |
| C | 0 | 12223 | 1 |
| D | 0 | 15482 | 1 |
| Quadrant | Total seconds | Saturated seconds | Saturation percentage |
|---|---|---|---|
| A | 5951 | 92 | 1.545959% |
| B | 5951 | 1107 | 18.601916% |
| C | 5951 | 67 | 1.125861% |
| D | 5951 | 119 | 1.999664% |
Noise dominated data is calculated using 1-second bins in cleaned event files. If a bin has >2000 counts, and if more than 50% of those come from <1% of pixels, then it is considered to be noise-dominated and hence unusable.
| Quadrant | # 1 sec bins | Bins with >0 counts | Bins with >2000 counts | High rate bins dominated by noise | Noise dominated (total time) | Noise dominated (detector-on time) | Marked lightcurve |
|---|---|---|---|---|---|---|---|
| A | 7187 | 5953 | 10 | 10 | 0.14% | 0.17% | 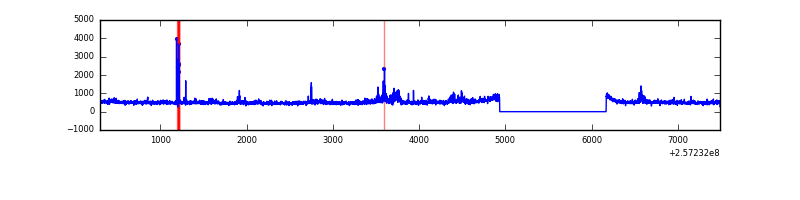 |
| B | 7187 | 5953 | 694 | 694 | 9.66% | 11.66% | 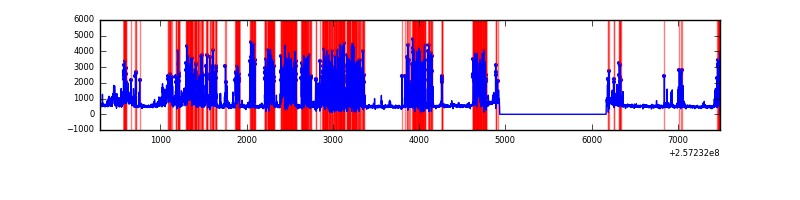 |
| C | 7187 | 5953 | 0 | 0 | 0.00% | 0.00% | 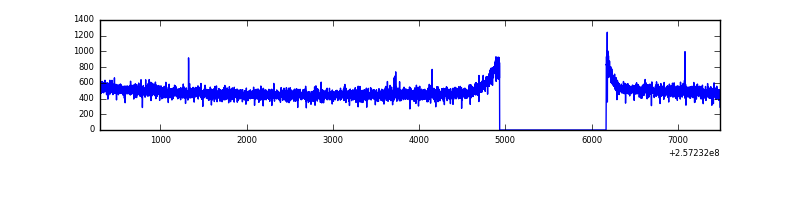 |
| D | 7187 | 5953 | 72 | 72 | 1.00% | 1.21% | 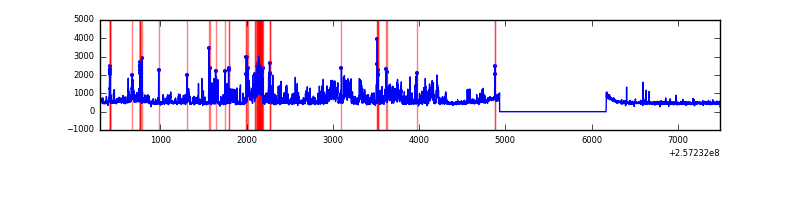 |
Top three noisy pixels from each quadrant. If the there are fewer than three noisy pixels in the level2.evt file, extra rows are filled as -1
| Pixel properties | Quadrant properties | ||||||
|---|---|---|---|---|---|---|---|
| Quadrant | DetID | PixID | Counts | Sigma | Mean | Median | Sigma |
| A | 8 | 15 | 163354 | 1106.92 | 735 | 719 | 146.9 |
| A | 12 | 189 | 72595 | 489.2 | 735 | 719 | 146.9 |
| A | 1 | 162 | 46672 | 312.76 | 735 | 719 | 146.9 |
| B | 4 | 239 | 1916466 | 15200.99 | 676 | 660 | 126.0 |
| B | 3 | 64 | 933406 | 7400.89 | 676 | 660 | 126.0 |
| B | 0 | 214 | 27821 | 215.51 | 676 | 660 | 126.0 |
| C | 13 | 61 | 5241 | 26.96 | 733 | 737 | 167.0 |
| C | 14 | 234 | 4356 | 21.66 | 733 | 737 | 167.0 |
| C | 1 | 5 | 3492 | 16.49 | 733 | 737 | 167.0 |
| D | 8 | 195 | 721786 | 4219.53 | 723 | 704 | 170.9 |
| D | 1 | 52 | 449537 | 2626.42 | 723 | 704 | 170.9 |
| D | 2 | 234 | 19063 | 107.43 | 723 | 704 | 170.9 |
Histogram calculated using DETX and DETY for each event in the final _common_clean file
| Quadrant A | 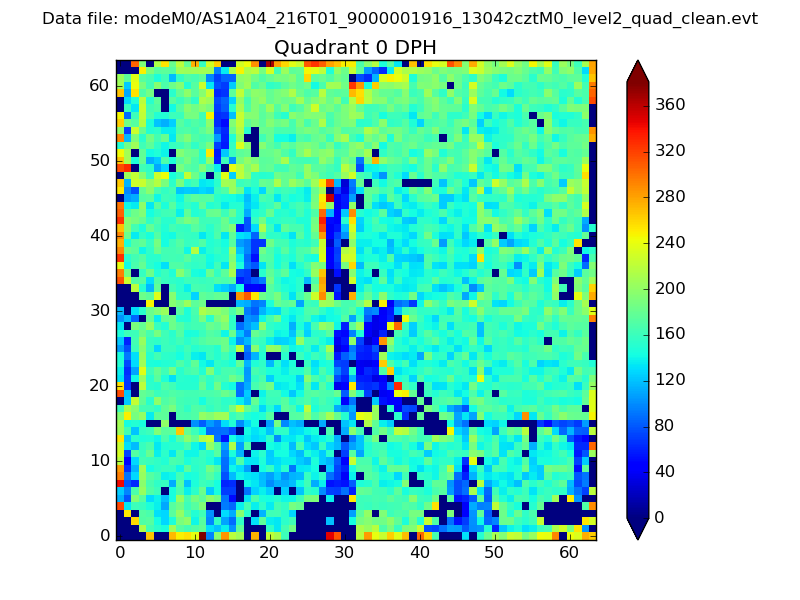 |
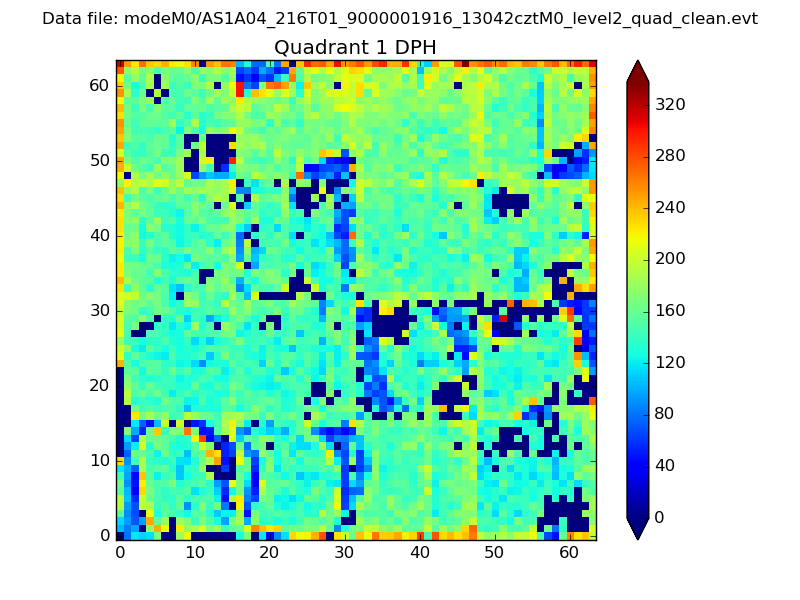 |
Quadrant B |
|---|---|---|---|
| Quadrant D | 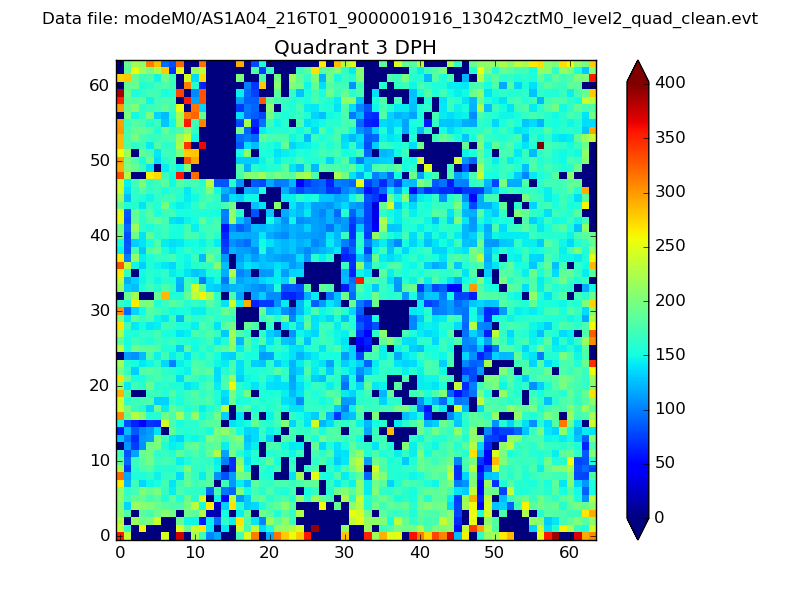 |
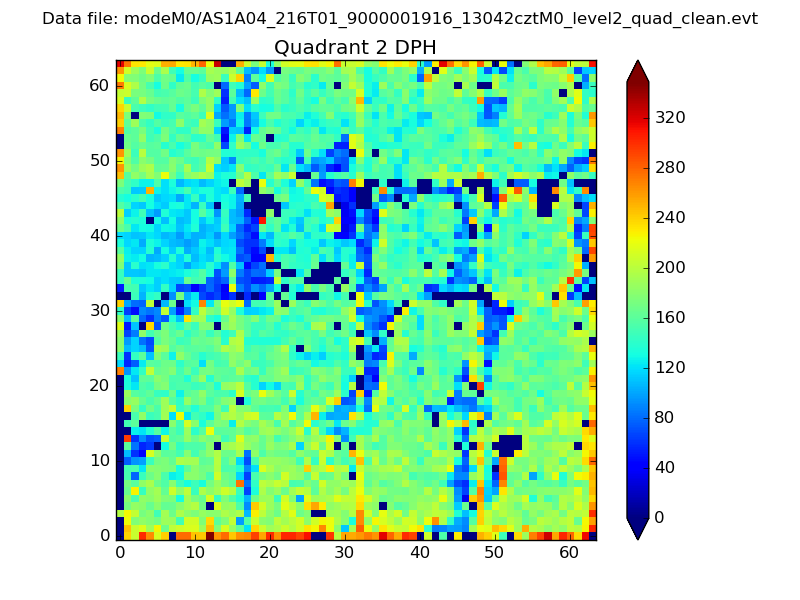 |
Quadrant C |
| Plot type | Count rate plots | Images |
|---|---|---|
| Comparison with Poisson distribution Blue bars denote a histogram of data divided into 1 sec bins. Red curve is a Poisson curve with rate = median count rate of data. |
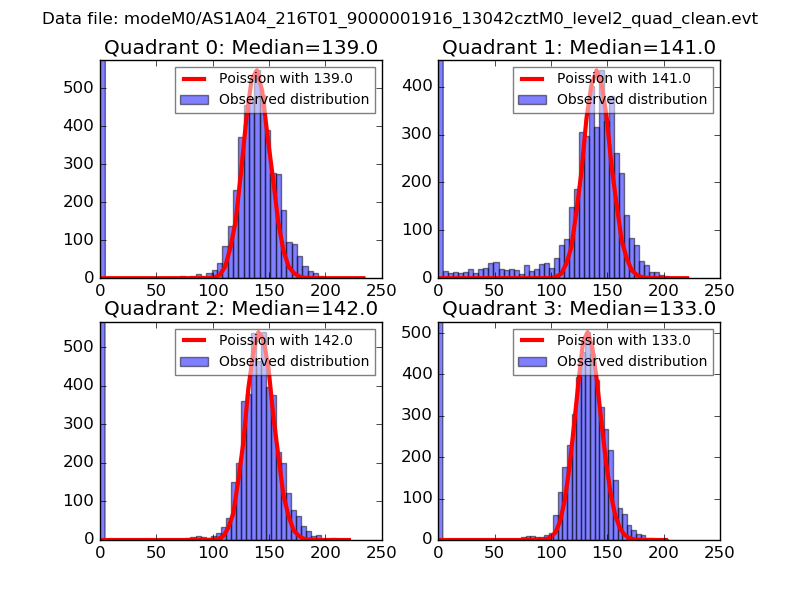 |
 |
| Quadrant-wise count rates Data is divided into 100 sec bins |
 |
|
| Module-wise count rates for Quadrant A Data is divided into 100 sec bins |
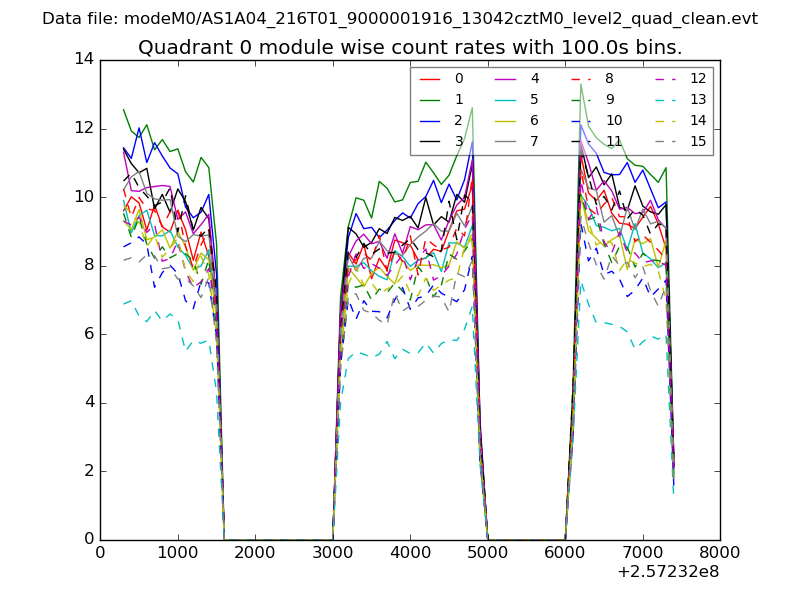 |
 |
| Module-wise count rates for Quadrant B Data is divided into 100 sec bins |
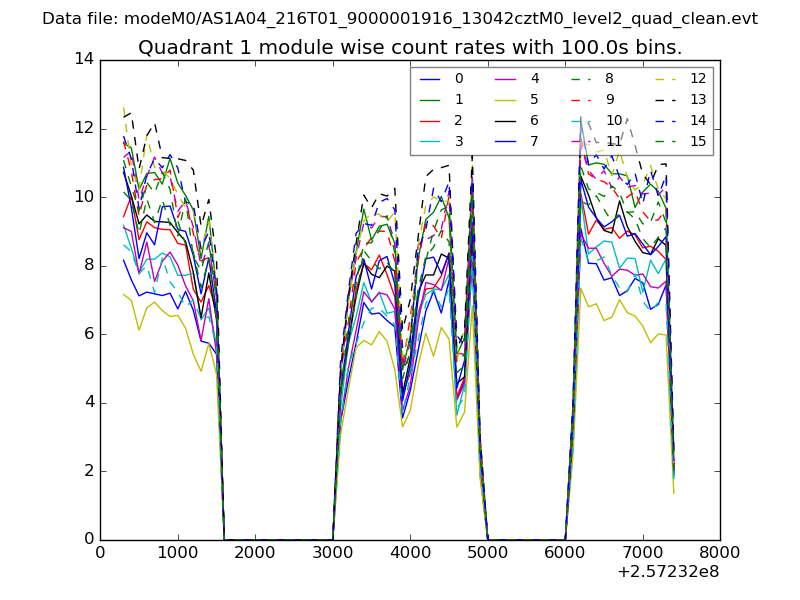 |
 |
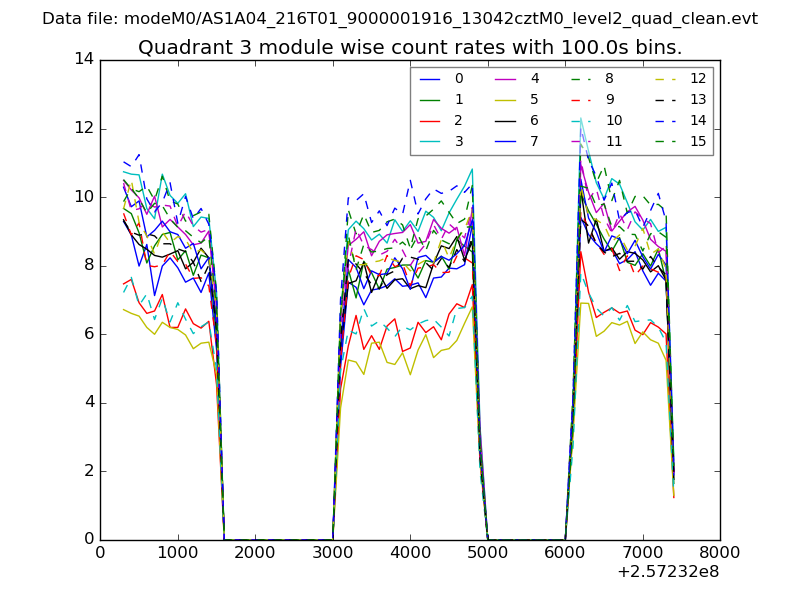
| Module-wise count rates for Quadrant C Data is divided into 100 sec bins |
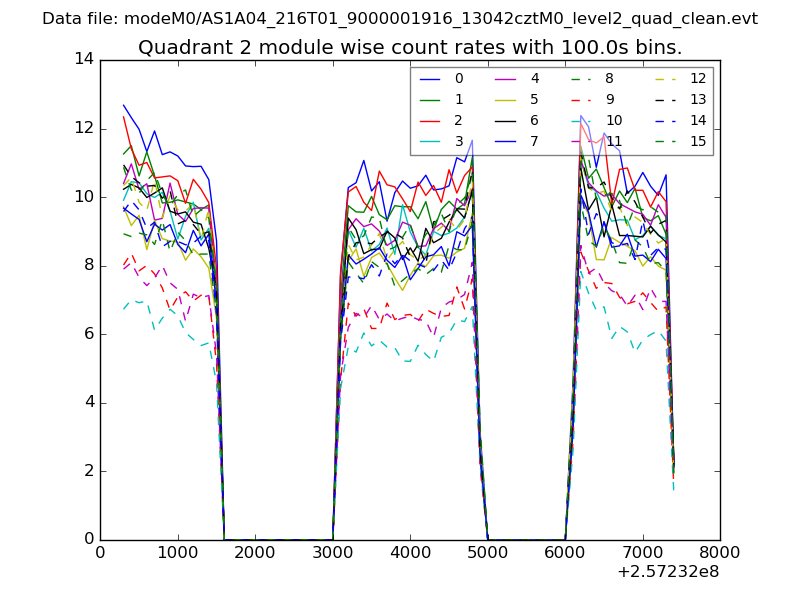 |
 |
| Module-wise count rates for Quadrant D Data is divided into 100 sec bins |
 |
 |
| Parameter | Plot |
|---|---|
| CZT HV Monitor | 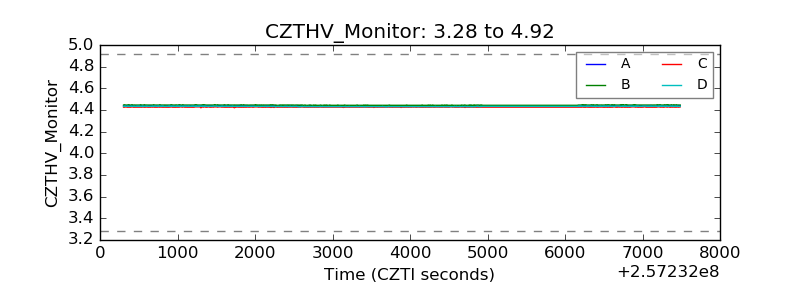 |
| D_VDD | 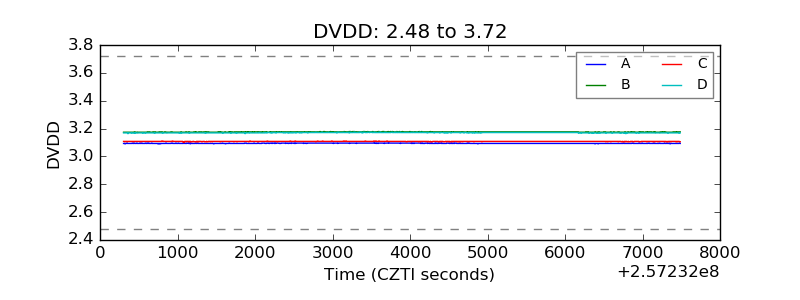 |
| Temperature 1 | 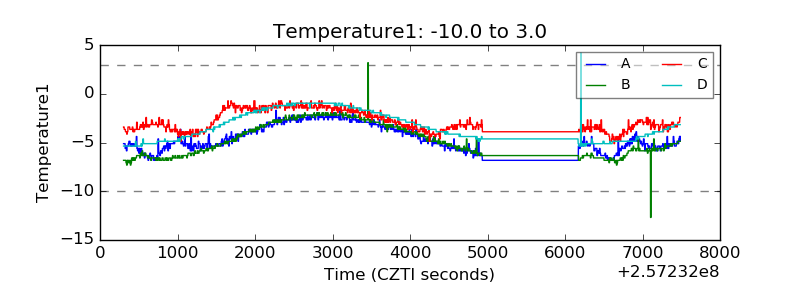 |
| Veto HV Monitor |  |
| Veto LLD | 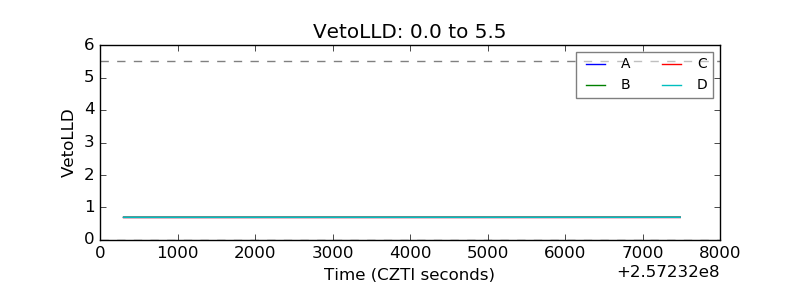 |
| Alpha Counter |  |
| _CPM_Rate | 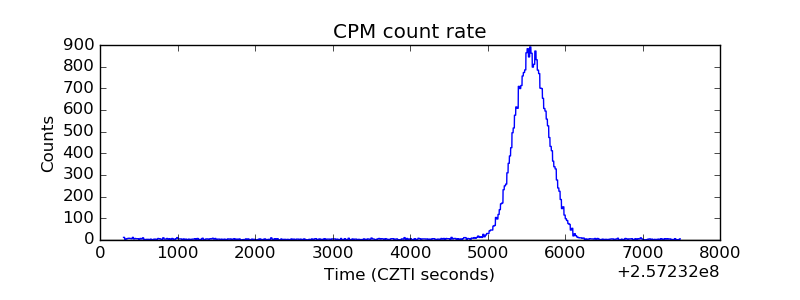 |
| CZT Counter | 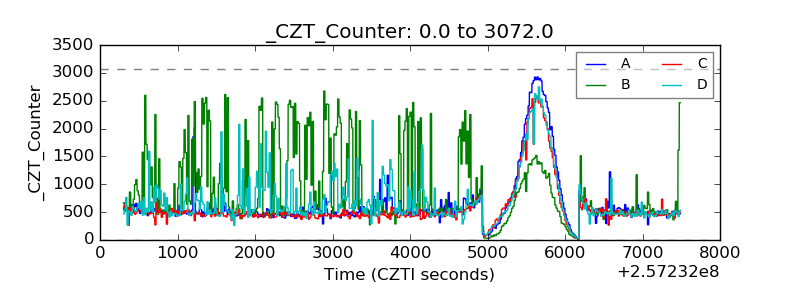 |
| +2.5 Volts monitor |  |
| +5 Volts monitor |  |
| _ROLL_ROT | 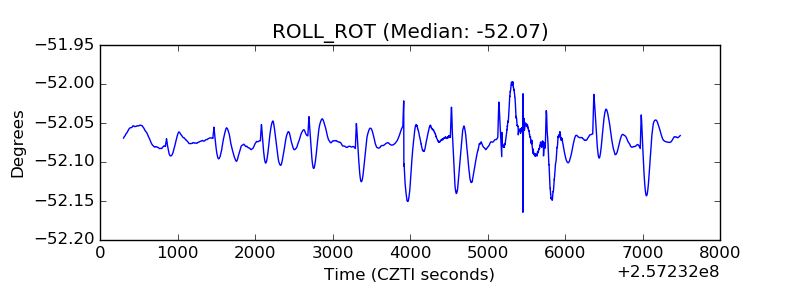 |
| _Roll_DEC | 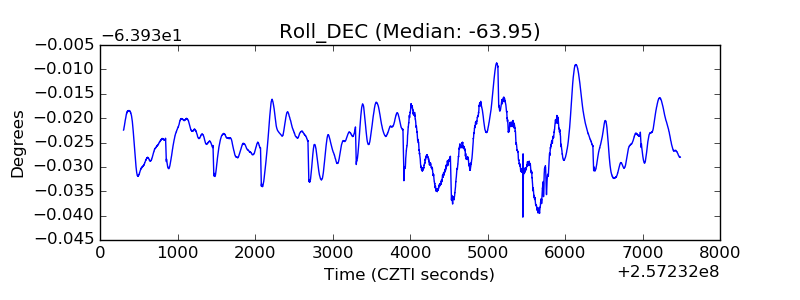 |
| _Roll_RA | 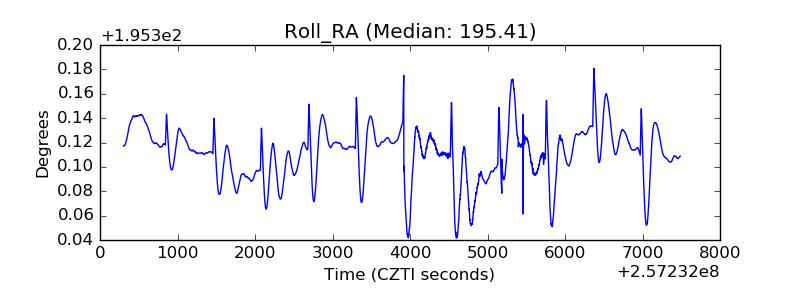 |
| Veto Counter | 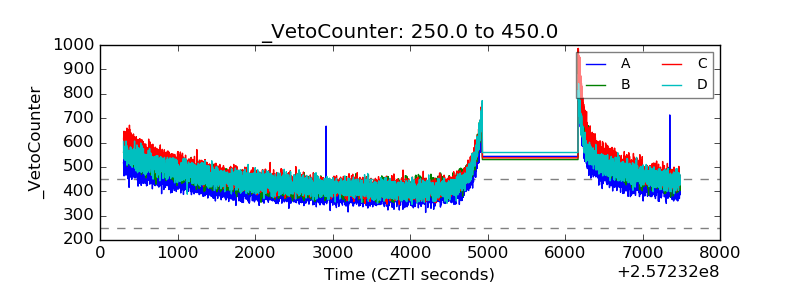 |