| Param | Original file | Final file |
|---|---|---|
| Filename | modeM0/AS1A04_216T01_9000001916_13045cztM0_level2.evt | modeM0/AS1A04_216T01_9000001916_13045cztM0_level2_quad_clean.evt |
| Size (bytes) | 677,206,080 | 87,612,480 |
| Size | 645.8 MB | 83.6 MB |
| Events in quadrant A | 3,727,342 | 563,624 |
| Events in quadrant B | 8,654,481 | 450,895 |
| Events in quadrant C | 3,495,306 | 572,407 |
| Events in quadrant D | 4,120,023 | 539,958 |
| Mode M9 | |||
|---|---|---|---|
| Quadrant | BADHDUFLAG | Total packets | Discarded packets |
| A | 0 | 7 | 0 |
| B | 0 | 7 | 0 |
| C | 0 | 7 | 0 |
| D | 0 | 8 | 0 |
| Mode SS | |||
|---|---|---|---|
| Quadrant | BADHDUFLAG | Total packets | Discarded packets |
| A | 0 | 152 | 0 |
| B | 0 | 152 | 0 |
| C | 0 | 152 | 0 |
| D | 0 | 152 | 0 |
| Mode M0 | |||
|---|---|---|---|
| Quadrant | BADHDUFLAG | Total packets | Discarded packets |
| A | 0 | 16004 | 3 |
| B | 0 | 30788 | 2 |
| C | 0 | 15739 | 2 |
| D | 0 | 17437 | 2 |
| Quadrant | Total seconds | Saturated seconds | Saturation percentage |
|---|---|---|---|
| A | 7551 | 266 | 3.522712% |
| B | 7551 | 2477 | 32.803602% |
| C | 7551 | 183 | 2.423520% |
| D | 7551 | 247 | 3.271090% |
Noise dominated data is calculated using 1-second bins in cleaned event files. If a bin has >2000 counts, and if more than 50% of those come from <1% of pixels, then it is considered to be noise-dominated and hence unusable.
| Quadrant | # 1 sec bins | Bins with >0 counts | Bins with >2000 counts | High rate bins dominated by noise | Noise dominated (total time) | Noise dominated (detector-on time) | Marked lightcurve |
|---|---|---|---|---|---|---|---|
| A | 7782 | 7553 | 2 | 2 | 0.03% | 0.03% | 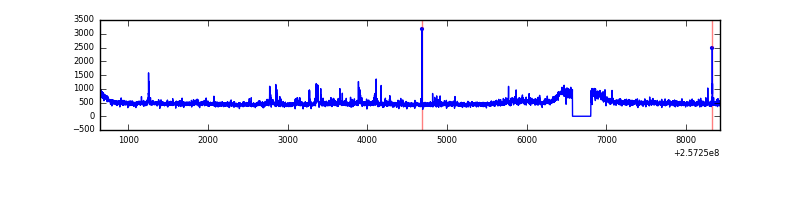 |
| B | 7782 | 7552 | 1461 | 1461 | 18.77% | 19.35% | 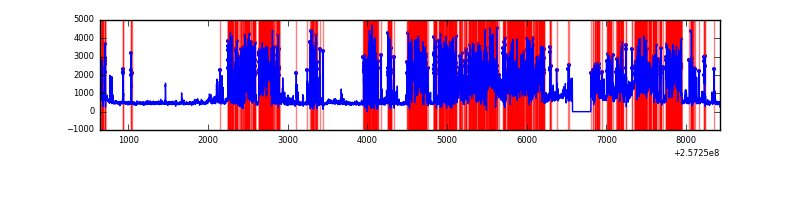 |
| C | 7782 | 7553 | 0 | 0 | 0.00% | 0.00% | 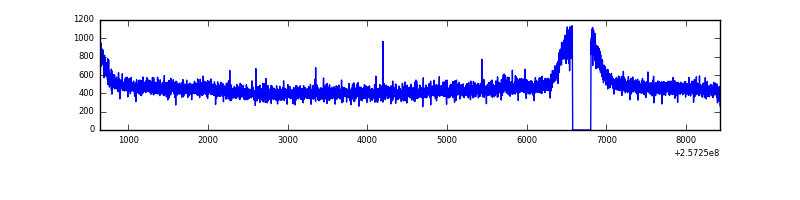 |
| D | 7782 | 7553 | 66 | 66 | 0.85% | 0.87% | 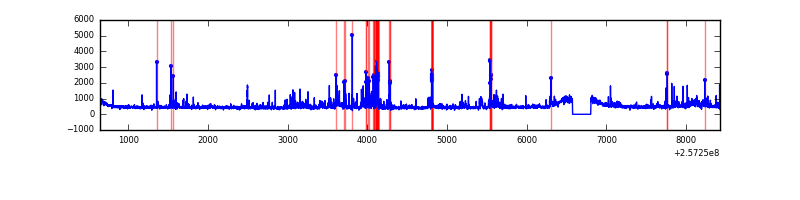 |
Top three noisy pixels from each quadrant. If the there are fewer than three noisy pixels in the level2.evt file, extra rows are filled as -1
| Pixel properties | Quadrant properties | ||||||
|---|---|---|---|---|---|---|---|
| Quadrant | DetID | PixID | Counts | Sigma | Mean | Median | Sigma |
| A | 8 | 15 | 143868 | 772.04 | 906 | 883 | 185.2 |
| A | 12 | 189 | 66634 | 355.02 | 906 | 883 | 185.2 |
| A | 1 | 162 | 14145 | 71.61 | 906 | 883 | 185.2 |
| B | 4 | 239 | 2717578 | 18548.03 | 759 | 737 | 146.5 |
| B | 0 | 85 | 2669838 | 18222.1 | 759 | 737 | 146.5 |
| B | 3 | 64 | 132679 | 900.78 | 759 | 737 | 146.5 |
| C | 13 | 61 | 6468 | 27.04 | 894 | 897 | 206.0 |
| C | 8 | 128 | 4588 | 17.92 | 894 | 897 | 206.0 |
| C | 8 | 112 | 2651 | 8.51 | 894 | 897 | 206.0 |
| D | 1 | 52 | 394545 | 1836.97 | 890 | 863 | 214.3 |
| D | 8 | 195 | 159114 | 738.42 | 890 | 863 | 214.3 |
| D | 2 | 33 | 66660 | 307.02 | 890 | 863 | 214.3 |
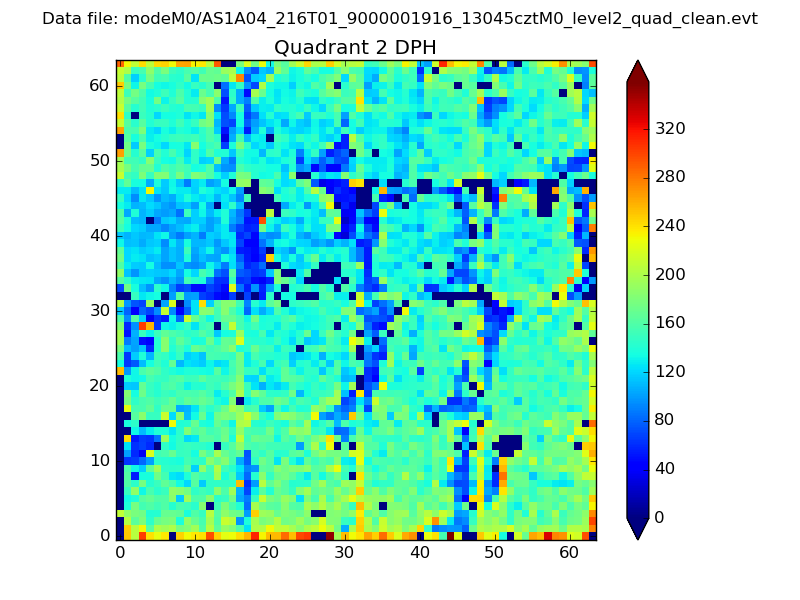
Histogram calculated using DETX and DETY for each event in the final _common_clean file
| Quadrant A | 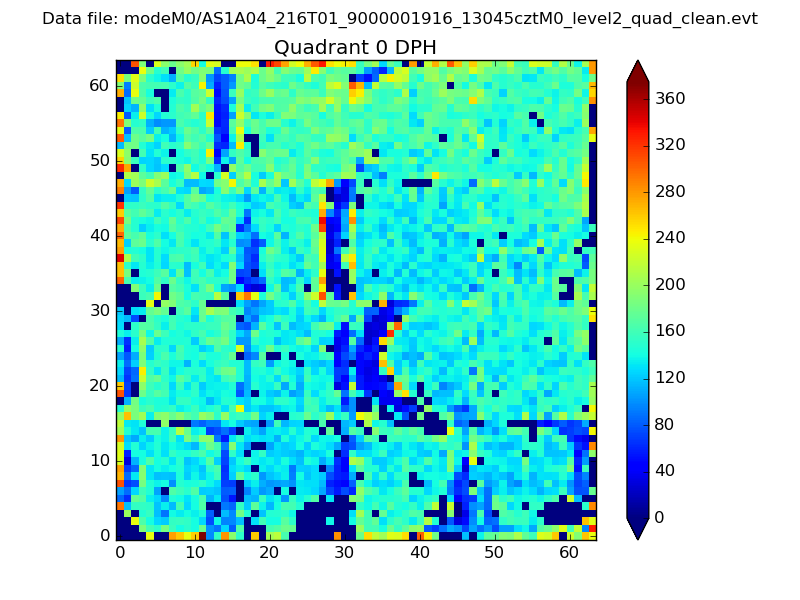 |
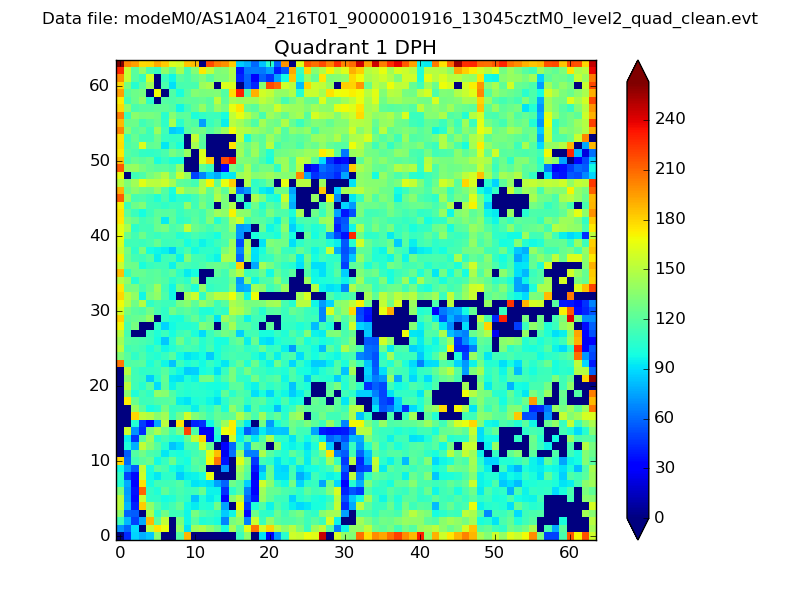 |
Quadrant B |
|---|---|---|---|
| Quadrant D | 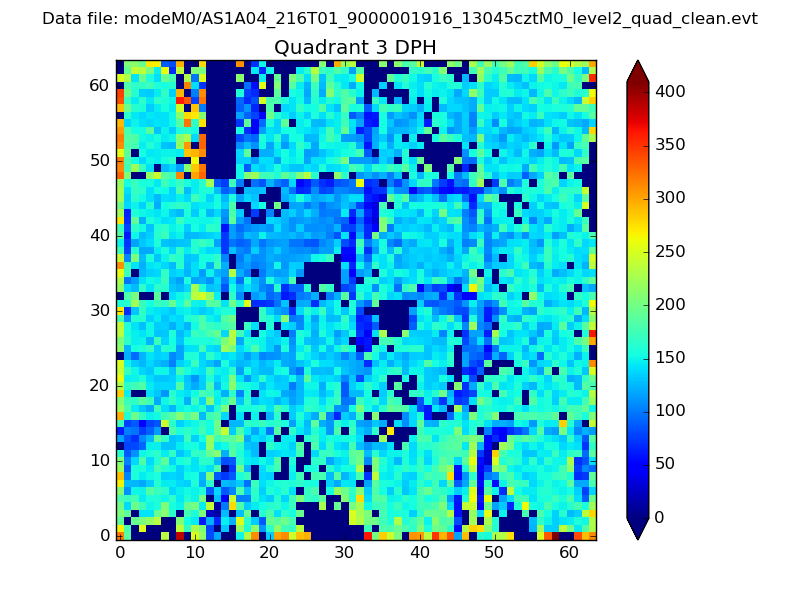 |
 |
Quadrant C |
| Plot type | Count rate plots | Images |
|---|---|---|
| Comparison with Poisson distribution Blue bars denote a histogram of data divided into 1 sec bins. Red curve is a Poisson curve with rate = median count rate of data. |
 |
 |
| Quadrant-wise count rates Data is divided into 100 sec bins |
 |
|
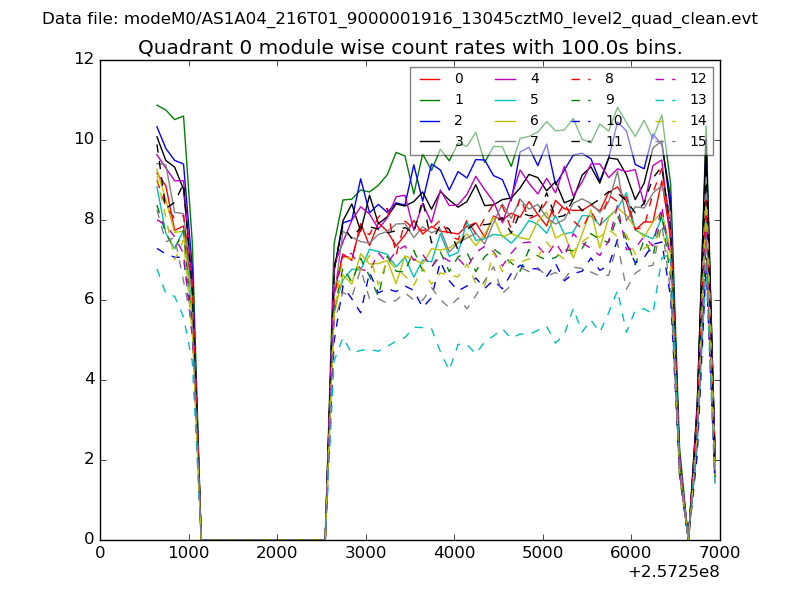
| Module-wise count rates for Quadrant A Data is divided into 100 sec bins |
 |
 |
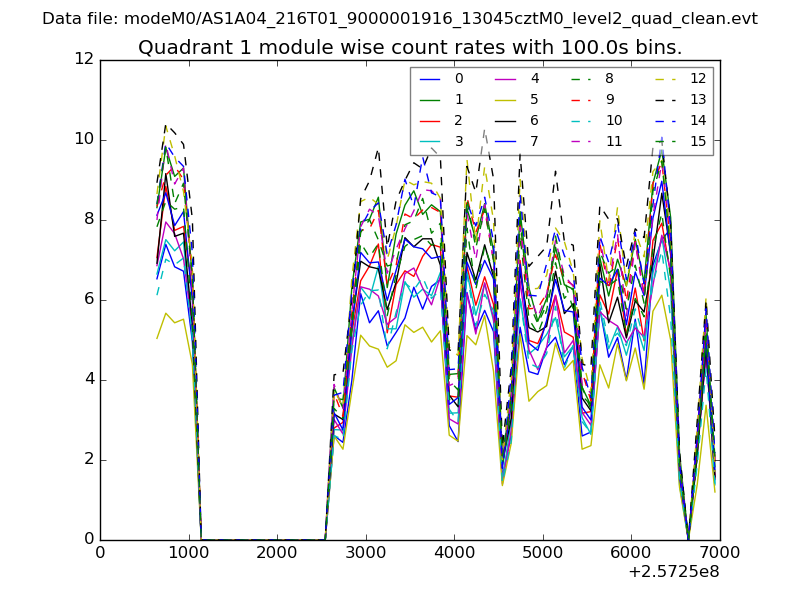
| Module-wise count rates for Quadrant B Data is divided into 100 sec bins |
 |
 |
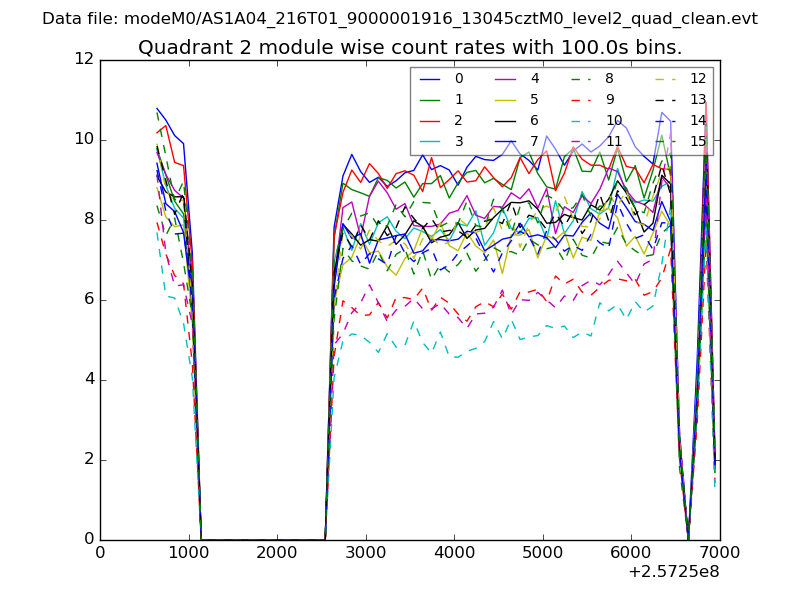
| Module-wise count rates for Quadrant C Data is divided into 100 sec bins |
 |
 |
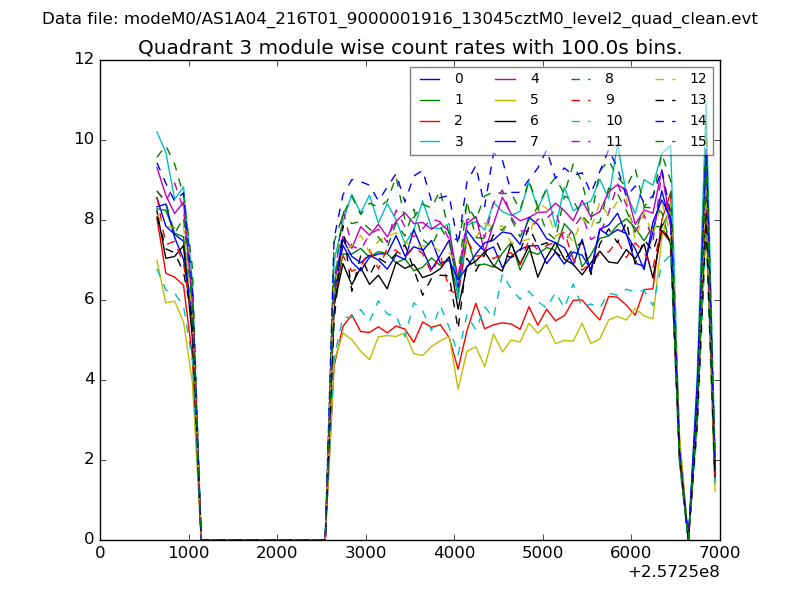
| Module-wise count rates for Quadrant D Data is divided into 100 sec bins |
 |
 |
| Parameter | Plot |
|---|---|
| CZT HV Monitor | 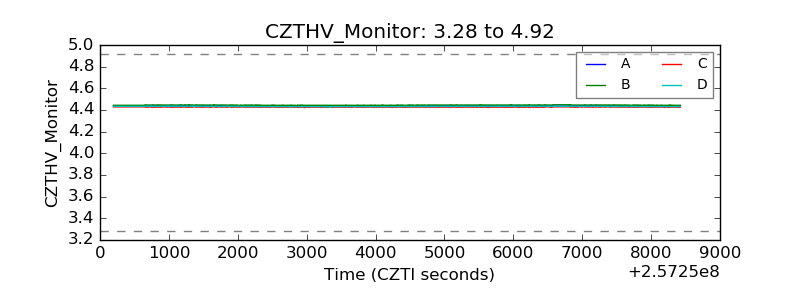 |
| D_VDD | 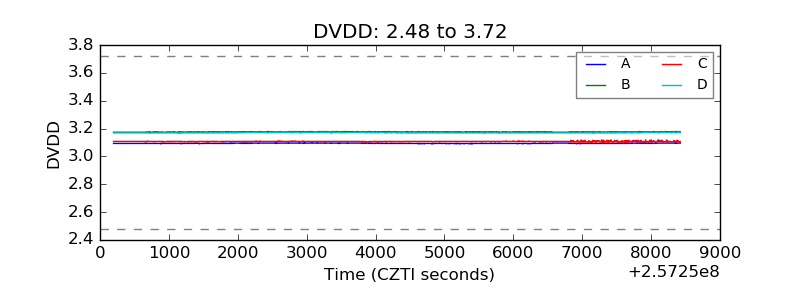 |
| Temperature 1 | 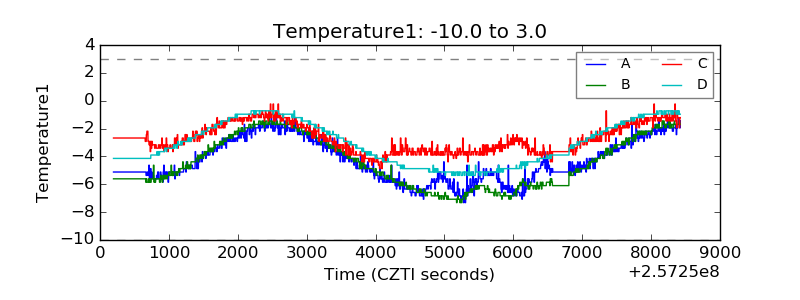 |
| Veto HV Monitor | 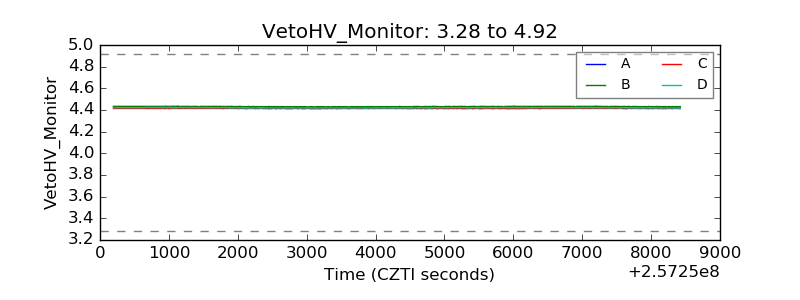 |
| Veto LLD | 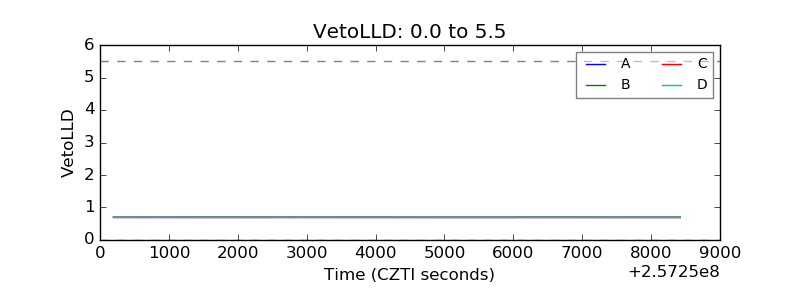 |
| Alpha Counter | 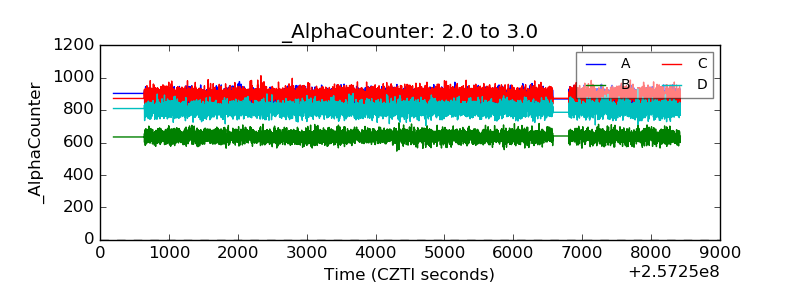 |
| _CPM_Rate | 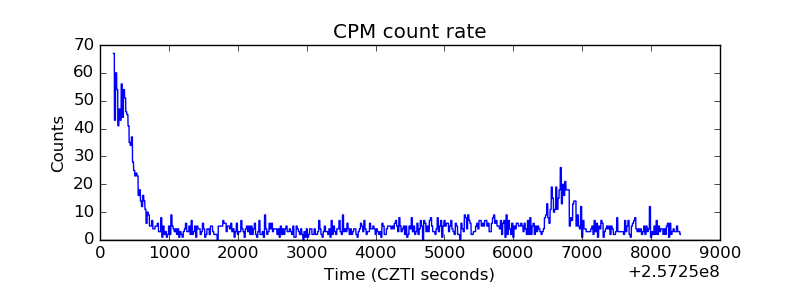 |
| CZT Counter | 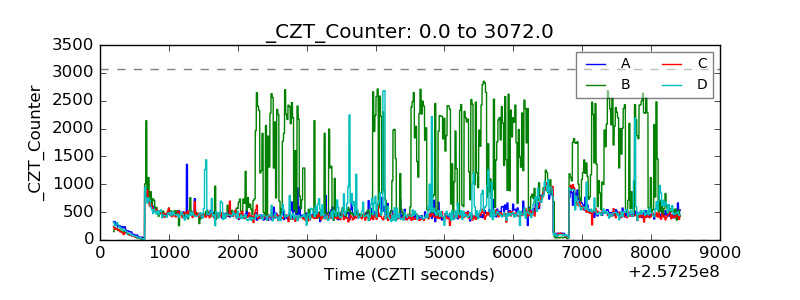 |
| +2.5 Volts monitor |  |
| +5 Volts monitor |  |
| _ROLL_ROT | 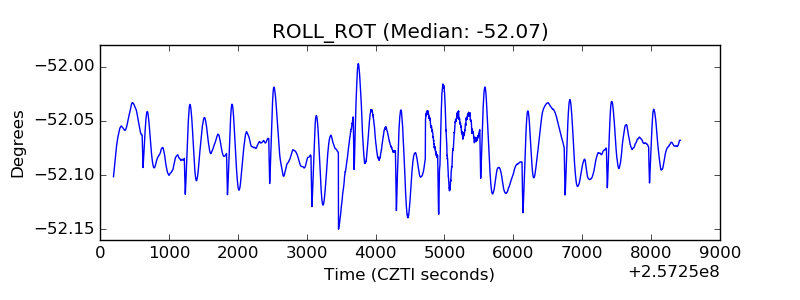 |
| _Roll_DEC | 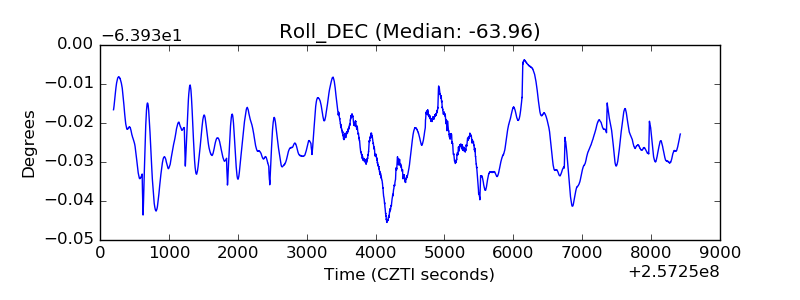 |
| _Roll_RA | 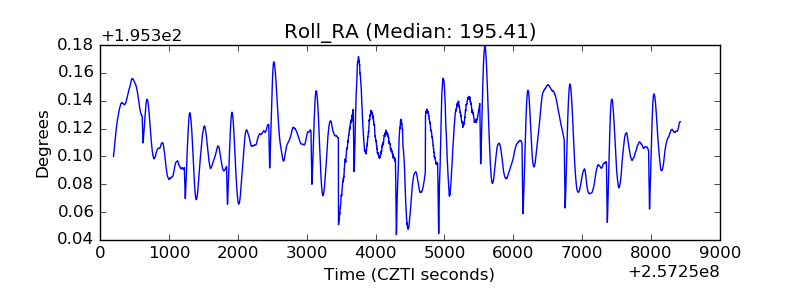 |
| Veto Counter | 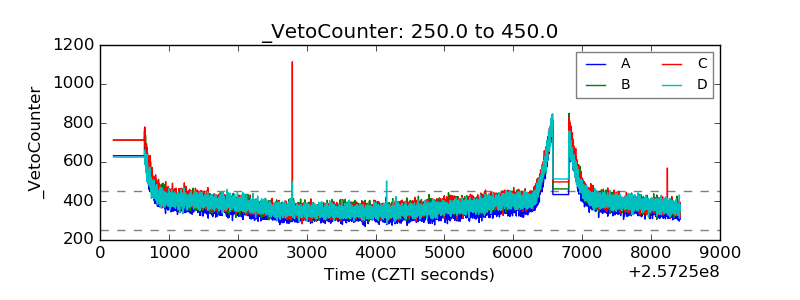 |