| Param | Original file | Final file |
|---|---|---|
| Filename | modeM0/AS1A04_216T01_9000001916_13047cztM0_level2.evt | modeM0/AS1A04_216T01_9000001916_13047cztM0_level2_quad_clean.evt |
| Size (bytes) | 904,285,440 | 106,709,760 |
| Size | 862.4 MB | 101.8 MB |
| Events in quadrant A | 5,373,837 | 638,359 |
| Events in quadrant B | 10,569,613 | 560,607 |
| Events in quadrant C | 4,973,171 | 642,153 |
| Events in quadrant D | 5,713,600 | 617,079 |
| Mode M9 | |||
|---|---|---|---|
| Quadrant | BADHDUFLAG | Total packets | Discarded packets |
| A | 0 | 1 | 0 |
| B | 0 | 1 | 0 |
| C | 0 | 1 | 0 |
| D | 0 | 1 | 0 |
| Mode SS | |||
|---|---|---|---|
| Quadrant | BADHDUFLAG | Total packets | Discarded packets |
| A | 0 | 228 | 0 |
| B | 0 | 228 | 0 |
| C | 0 | 228 | 0 |
| D | 0 | 228 | 0 |
| Mode M0 | |||
|---|---|---|---|
| Quadrant | BADHDUFLAG | Total packets | Discarded packets |
| A | 0 | 23382 | 4 |
| B | 0 | 38818 | 3 |
| C | 0 | 22808 | 3 |
| D | 0 | 24850 | 3 |
| Quadrant | Total seconds | Saturated seconds | Saturation percentage |
|---|---|---|---|
| A | 11155 | 189 | 1.694307% |
| B | 11155 | 2516 | 22.554908% |
| C | 11155 | 119 | 1.066786% |
| D | 11155 | 173 | 1.550874% |
Noise dominated data is calculated using 1-second bins in cleaned event files. If a bin has >2000 counts, and if more than 50% of those come from <1% of pixels, then it is considered to be noise-dominated and hence unusable.
| Quadrant | # 1 sec bins | Bins with >0 counts | Bins with >2000 counts | High rate bins dominated by noise | Noise dominated (total time) | Noise dominated (detector-on time) | Marked lightcurve |
|---|---|---|---|---|---|---|---|
| A | 11391 | 11158 | 3 | 3 | 0.03% | 0.03% | 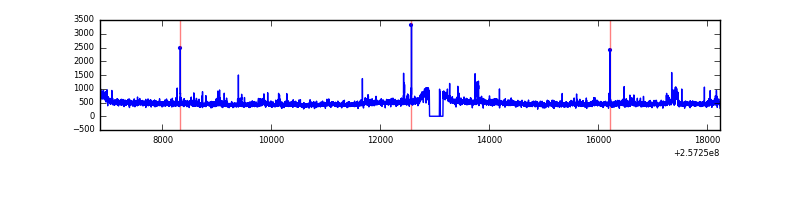 |
| B | 11391 | 11158 | 1464 | 1464 | 12.85% | 13.12% | 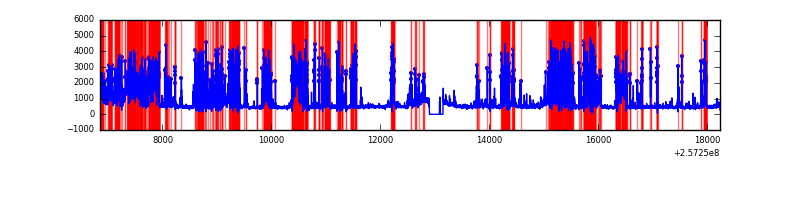 |
| C | 11391 | 11158 | 0 | 0 | 0.00% | 0.00% | 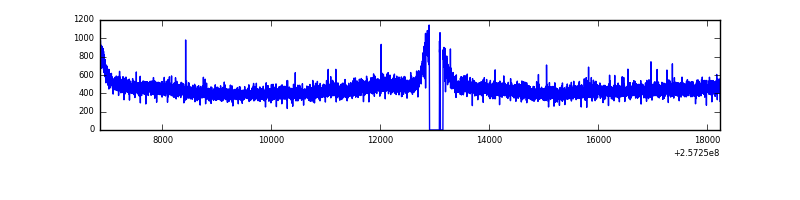 |
| D | 11391 | 11158 | 56 | 56 | 0.49% | 0.50% | 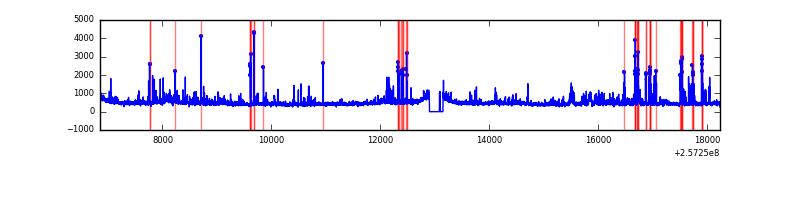 |
Top three noisy pixels from each quadrant. If the there are fewer than three noisy pixels in the level2.evt file, extra rows are filled as -1
| Pixel properties | Quadrant properties | ||||||
|---|---|---|---|---|---|---|---|
| Quadrant | DetID | PixID | Counts | Sigma | Mean | Median | Sigma |
| A | 12 | 189 | 215680 | 814.44 | 1293 | 1263 | 263.3 |
| A | 8 | 15 | 58630 | 217.9 | 1293 | 1263 | 263.3 |
| A | 1 | 162 | 38601 | 141.82 | 1293 | 1263 | 263.3 |
| B | 4 | 239 | 4625380 | 21487.68 | 1135 | 1106 | 215.2 |
| B | 0 | 85 | 1044982 | 4850.59 | 1135 | 1106 | 215.2 |
| B | 3 | 64 | 180451 | 833.36 | 1135 | 1106 | 215.2 |
| C | 8 | 128 | 11947 | 36.28 | 1270 | 1276 | 294.1 |
| C | 13 | 61 | 9233 | 27.05 | 1270 | 1276 | 294.1 |
| C | 8 | 112 | 6641 | 18.24 | 1270 | 1276 | 294.1 |
| D | 1 | 52 | 453591 | 1500.52 | 1258 | 1220 | 301.5 |
| D | 8 | 195 | 385902 | 1276.0 | 1258 | 1220 | 301.5 |
| D | 2 | 69 | 48187 | 155.79 | 1258 | 1220 | 301.5 |
Histogram calculated using DETX and DETY for each event in the final _common_clean file
| Quadrant A | 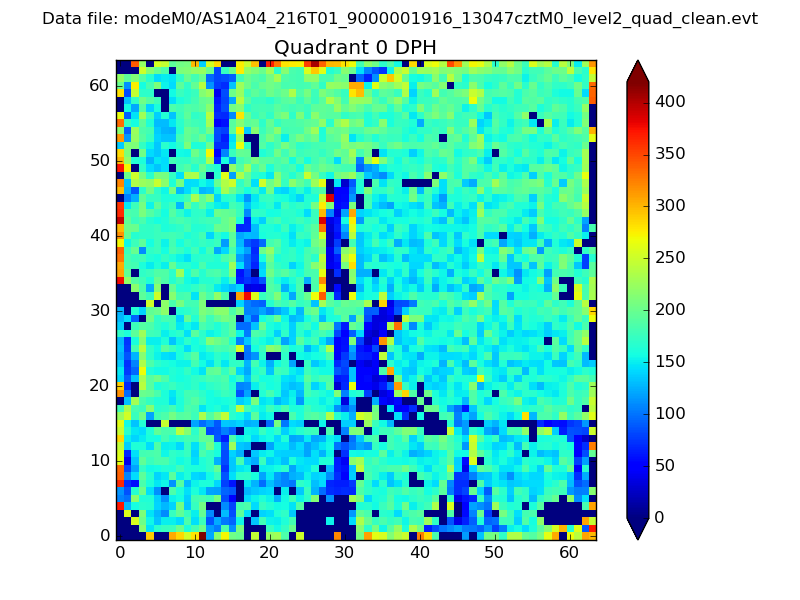 |
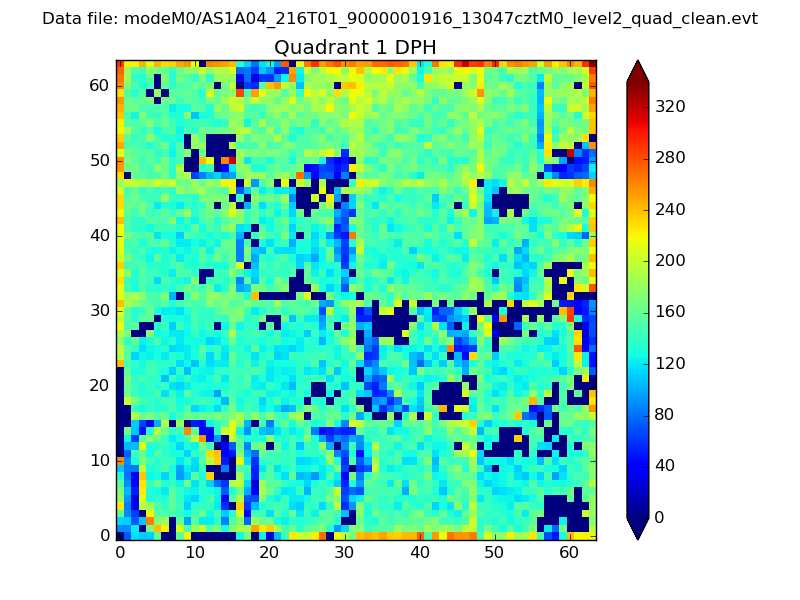 |
Quadrant B |
|---|---|---|---|
| Quadrant D | 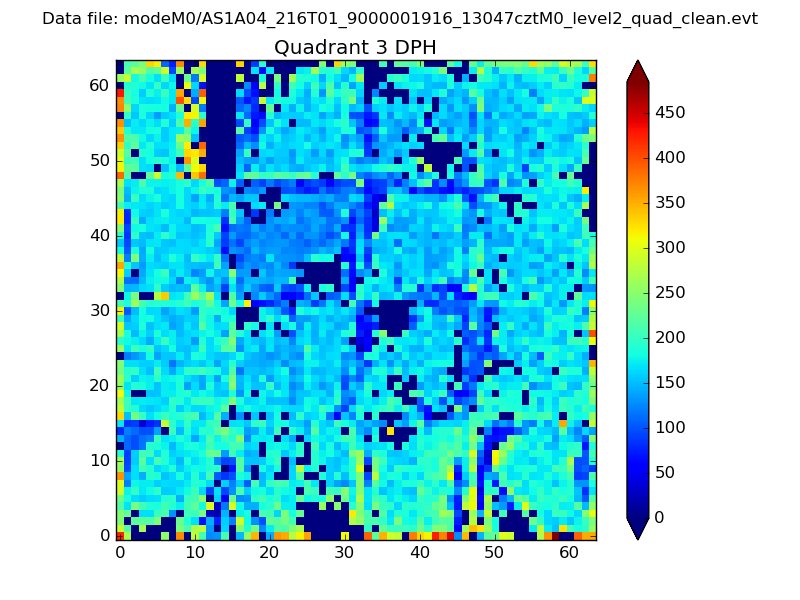 |
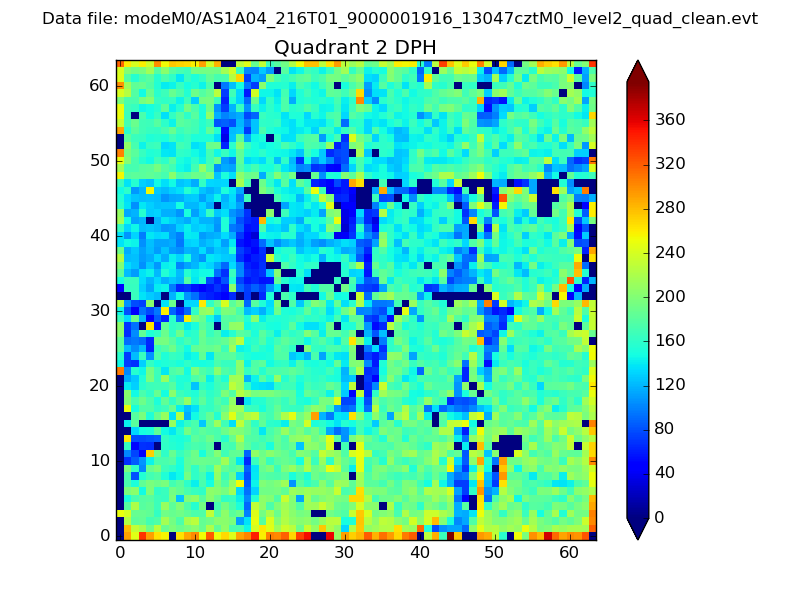 |
Quadrant C |
| Plot type | Count rate plots | Images |
|---|---|---|
| Comparison with Poisson distribution Blue bars denote a histogram of data divided into 1 sec bins. Red curve is a Poisson curve with rate = median count rate of data. |
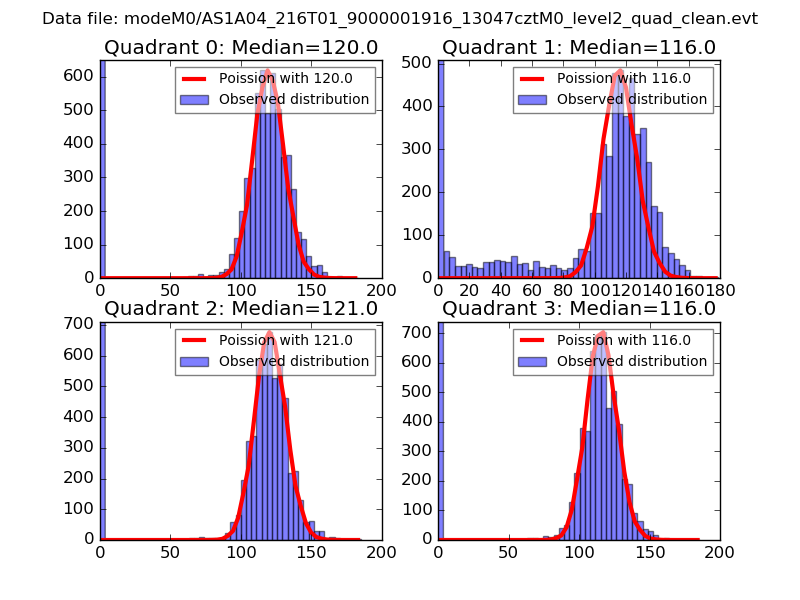 |
 |
| Quadrant-wise count rates Data is divided into 100 sec bins |
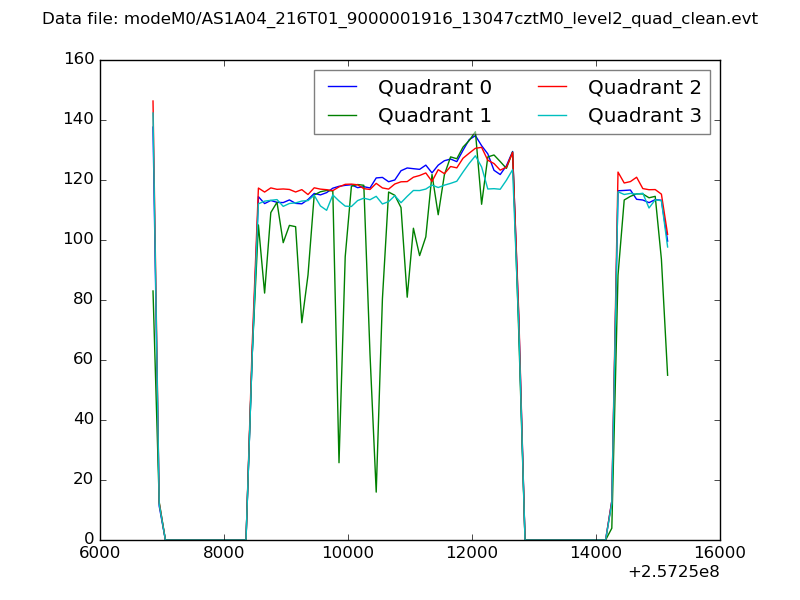 |
|
| Module-wise count rates for Quadrant A Data is divided into 100 sec bins |
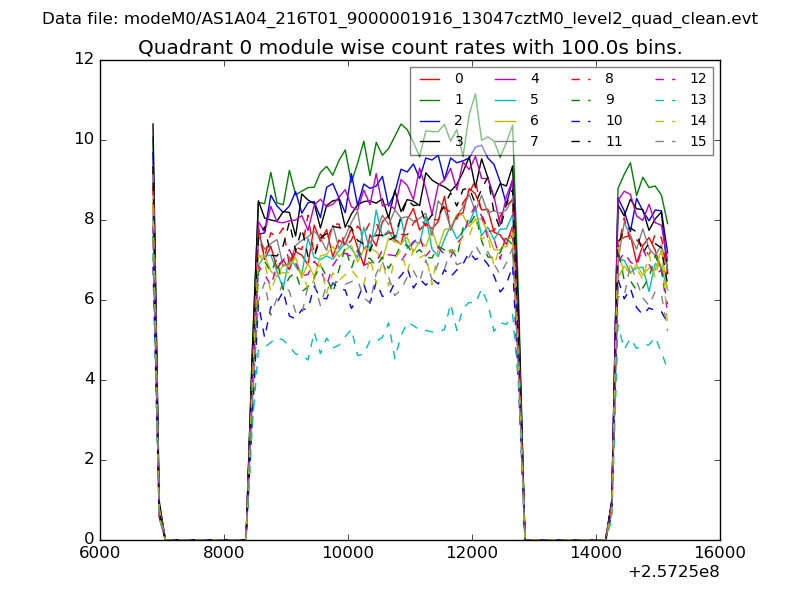 |
 |
| Module-wise count rates for Quadrant B Data is divided into 100 sec bins |
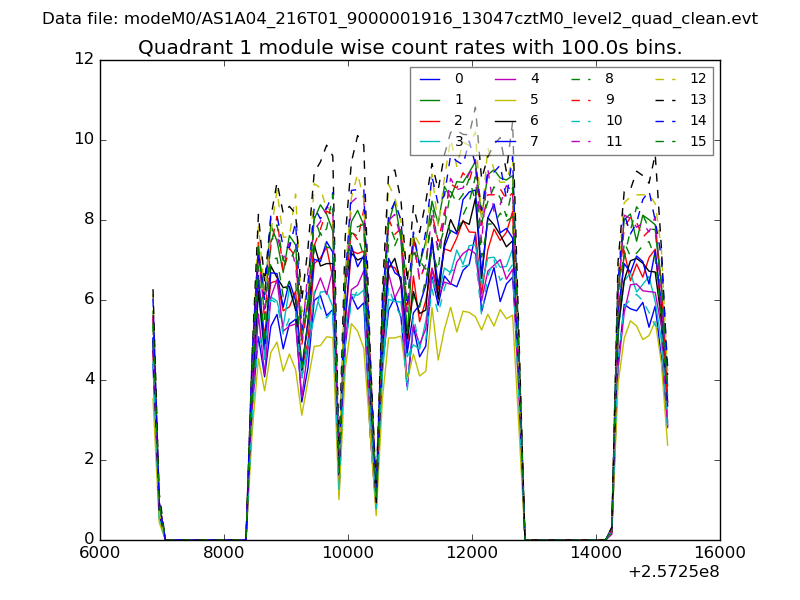 |
 |
| Module-wise count rates for Quadrant C Data is divided into 100 sec bins |
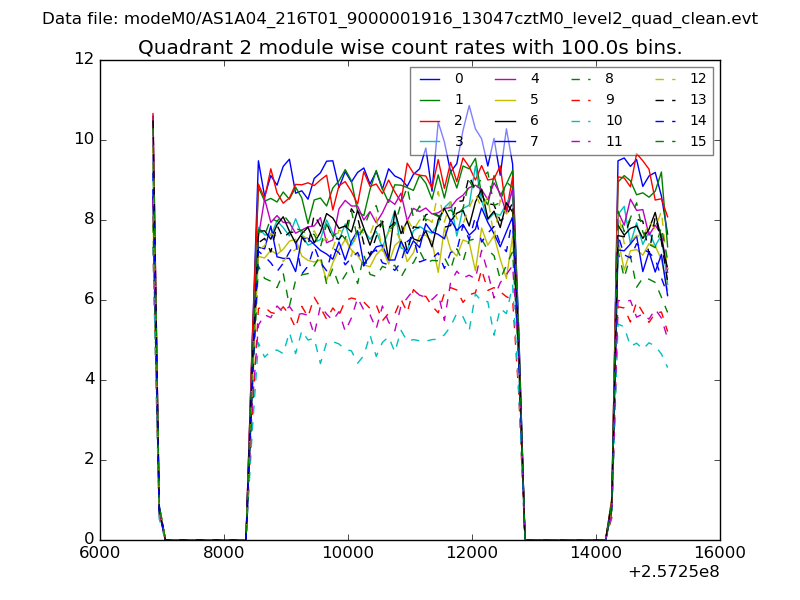 |
 |
| Module-wise count rates for Quadrant D Data is divided into 100 sec bins |
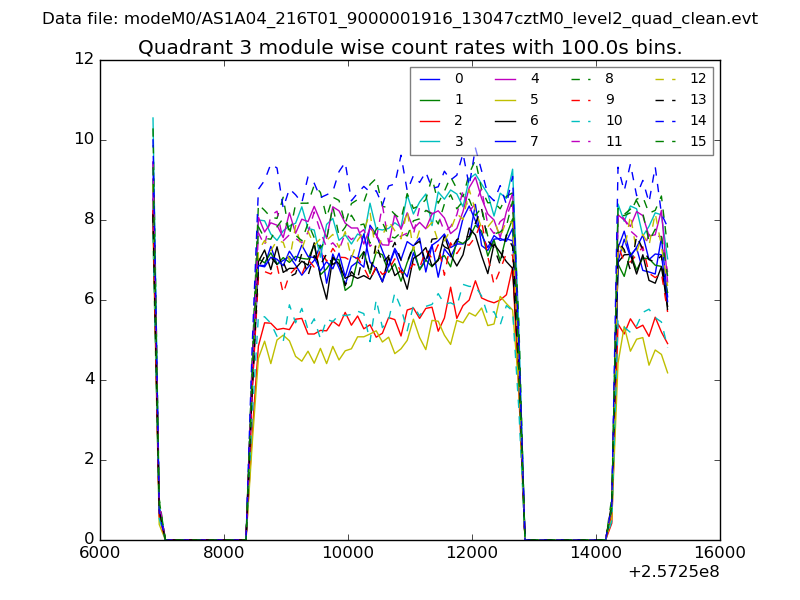 |
 |
| Parameter | Plot |
|---|---|
| CZT HV Monitor | 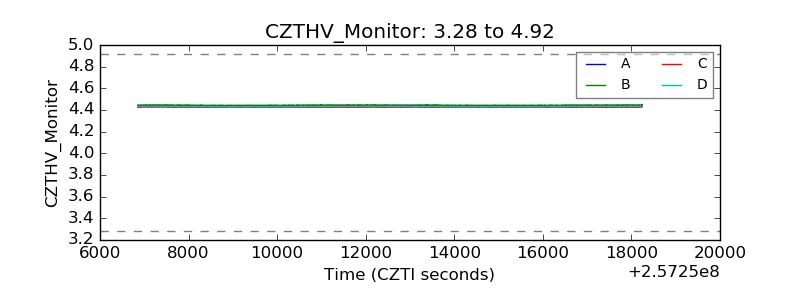 |
| D_VDD | 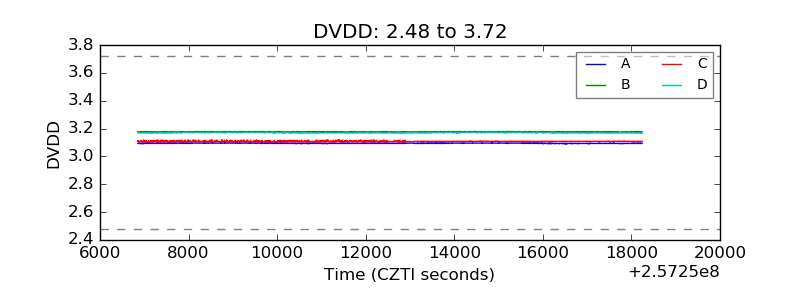 |
| Temperature 1 | 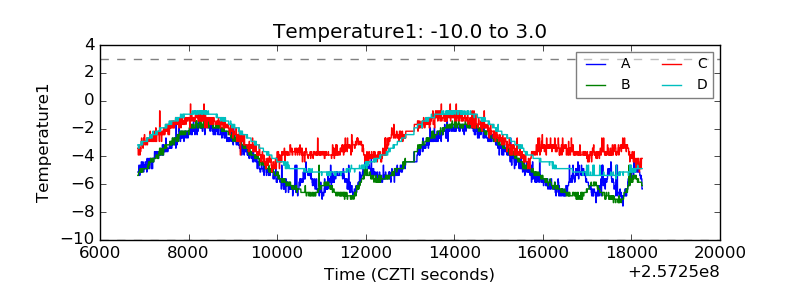 |
| Veto HV Monitor | 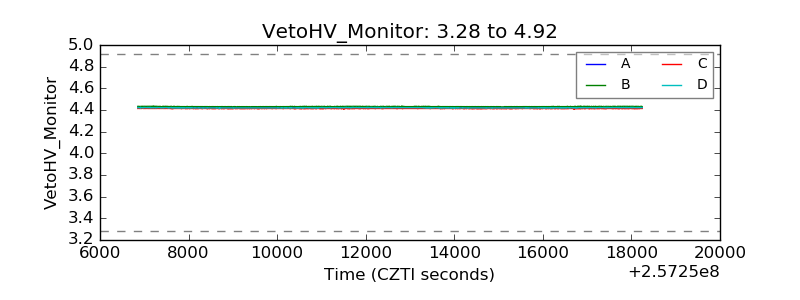 |
| Veto LLD | 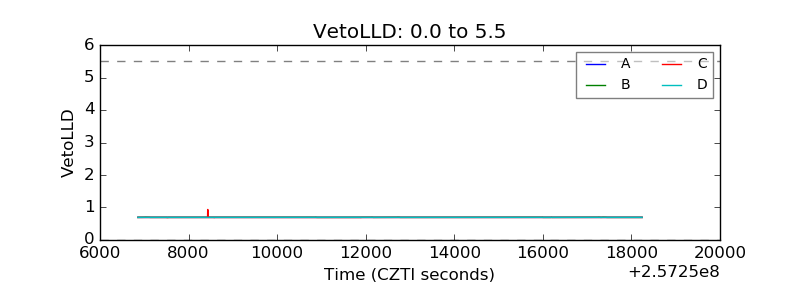 |
| Alpha Counter | 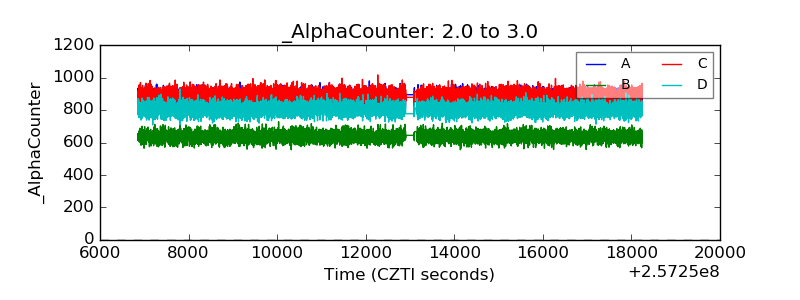 |
| _CPM_Rate | 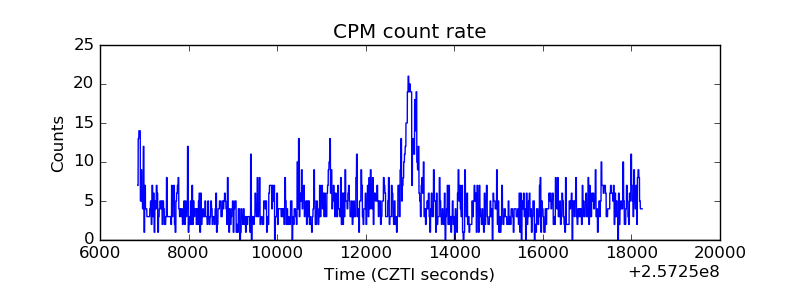 |
| CZT Counter | 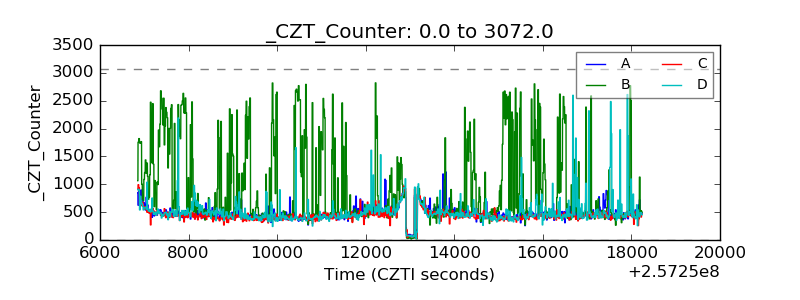 |
| +2.5 Volts monitor |  |
| +5 Volts monitor |  |
| _ROLL_ROT | 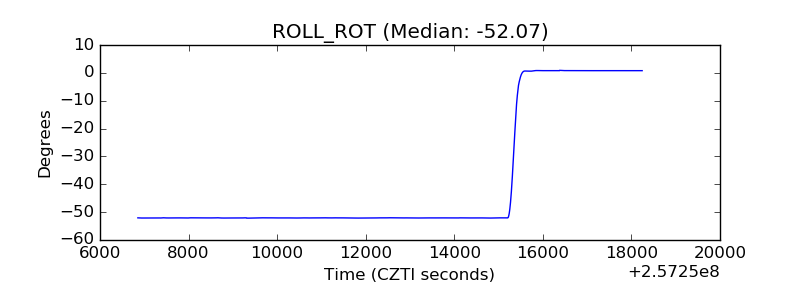 |
| _Roll_DEC | 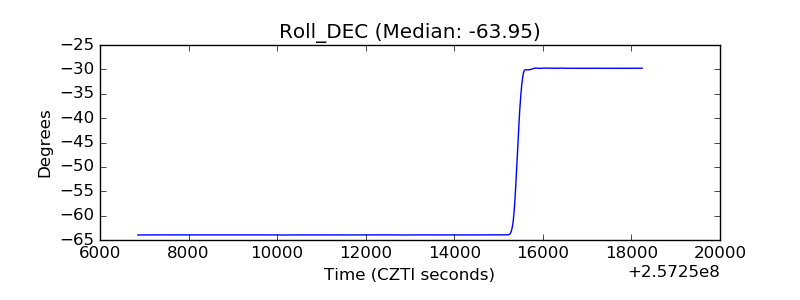 |
| _Roll_RA | 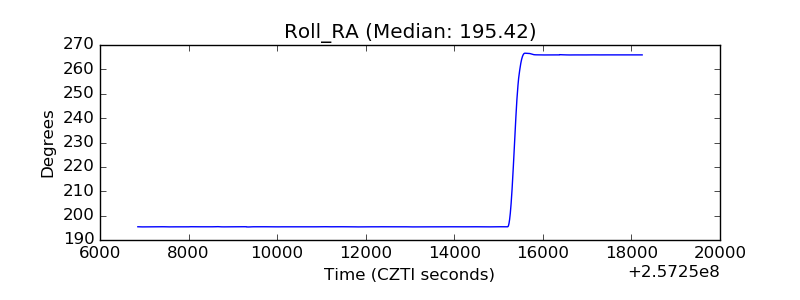 |
| Veto Counter | 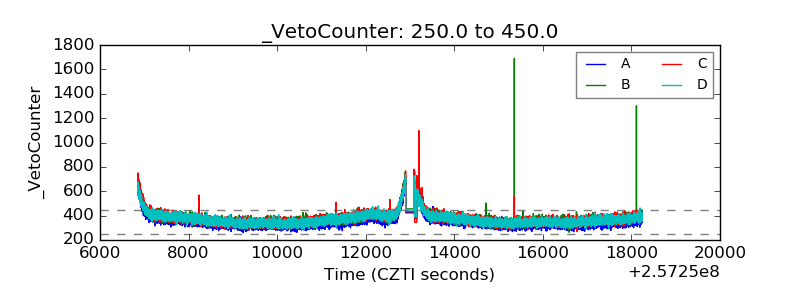 |