| Param | Original file | Final file |
|---|---|---|
| Filename | modeM0/AS1A04_216T01_9000001916_13049cztM0_level2.evt | modeM0/AS1A04_216T01_9000001916_13049cztM0_level2_quad_clean.evt |
| Size (bytes) | 386,568,000 | 57,954,240 |
| Size | 368.7 MB | 55.3 MB |
| Events in quadrant A | 2,661,419 | 357,041 |
| Events in quadrant B | 3,883,639 | 337,677 |
| Events in quadrant C | 2,297,029 | 360,222 |
| Events in quadrant D | 2,521,347 | 345,620 |
| Mode M9 | |||
|---|---|---|---|
| Quadrant | BADHDUFLAG | Total packets | Discarded packets |
| A | 0 | 4 | 0 |
| B | 0 | 4 | 0 |
| C | 0 | 4 | 0 |
| D | 0 | 4 | 0 |
| Mode SS | |||
|---|---|---|---|
| Quadrant | BADHDUFLAG | Total packets | Discarded packets |
| A | 0 | 102 | 0 |
| B | 0 | 102 | 0 |
| C | 0 | 102 | 0 |
| D | 0 | 102 | 0 |
| Mode M0 | |||
|---|---|---|---|
| Quadrant | BADHDUFLAG | Total packets | Discarded packets |
| A | 0 | 11070 | 1 |
| B | 0 | 14830 | 1 |
| C | 0 | 10373 | 1 |
| D | 0 | 10942 | 1 |
| Quadrant | Total seconds | Saturated seconds | Saturation percentage |
|---|---|---|---|
| A | 5049 | 99 | 1.960784% |
| B | 5049 | 697 | 13.804714% |
| C | 5049 | 63 | 1.247772% |
| D | 5049 | 69 | 1.366607% |
Noise dominated data is calculated using 1-second bins in cleaned event files. If a bin has >2000 counts, and if more than 50% of those come from <1% of pixels, then it is considered to be noise-dominated and hence unusable.
| Quadrant | # 1 sec bins | Bins with >0 counts | Bins with >2000 counts | High rate bins dominated by noise | Noise dominated (total time) | Noise dominated (detector-on time) | Marked lightcurve |
|---|---|---|---|---|---|---|---|
| A | 5455 | 5051 | 1 | 1 | 0.02% | 0.02% | 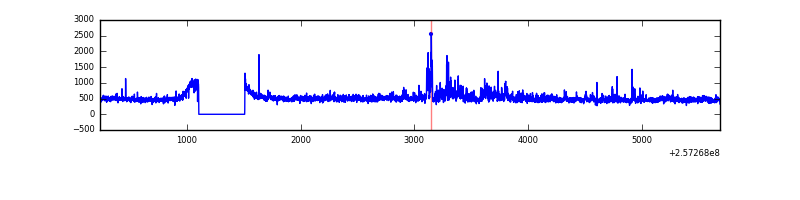 |
| B | 5455 | 5051 | 319 | 319 | 5.85% | 6.32% |  |
| C | 5455 | 5051 | 0 | 0 | 0.00% | 0.00% | 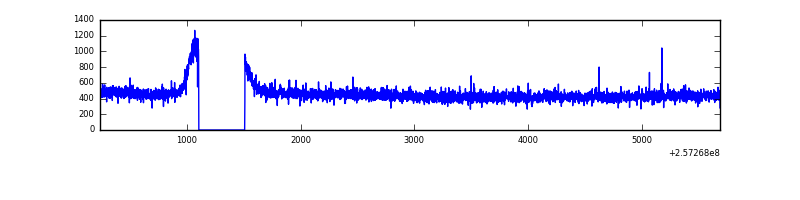 |
| D | 5455 | 5051 | 2 | 2 | 0.04% | 0.04% | 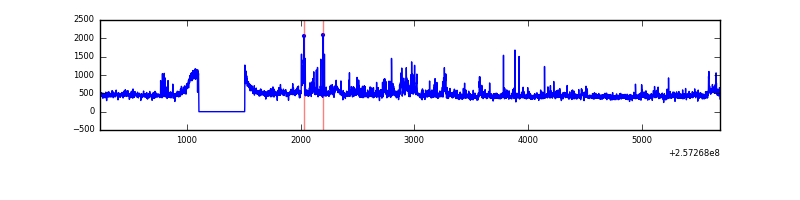 |
Top three noisy pixels from each quadrant. If the there are fewer than three noisy pixels in the level2.evt file, extra rows are filled as -1
| Pixel properties | Quadrant properties | ||||||
|---|---|---|---|---|---|---|---|
| Quadrant | DetID | PixID | Counts | Sigma | Mean | Median | Sigma |
| A | 8 | 15 | 174345 | 1395.9 | 595 | 582 | 124.5 |
| A | 12 | 189 | 84405 | 673.38 | 595 | 582 | 124.5 |
| A | 1 | 162 | 50443 | 400.55 | 595 | 582 | 124.5 |
| B | 4 | 239 | 1257111 | 11780.85 | 550 | 534 | 106.7 |
| B | 3 | 64 | 312641 | 2926.11 | 550 | 534 | 106.7 |
| B | 0 | 85 | 51063 | 473.73 | 550 | 534 | 106.7 |
| C | 8 | 128 | 7743 | 52.29 | 584 | 588 | 136.8 |
| C | 13 | 61 | 4440 | 28.15 | 584 | 588 | 136.8 |
| C | 8 | 112 | 4427 | 28.05 | 584 | 588 | 136.8 |
| D | 8 | 195 | 151415 | 1065.41 | 582 | 566 | 141.6 |
| D | 1 | 52 | 70392 | 493.16 | 582 | 566 | 141.6 |
| D | 10 | 157 | 65659 | 459.74 | 582 | 566 | 141.6 |
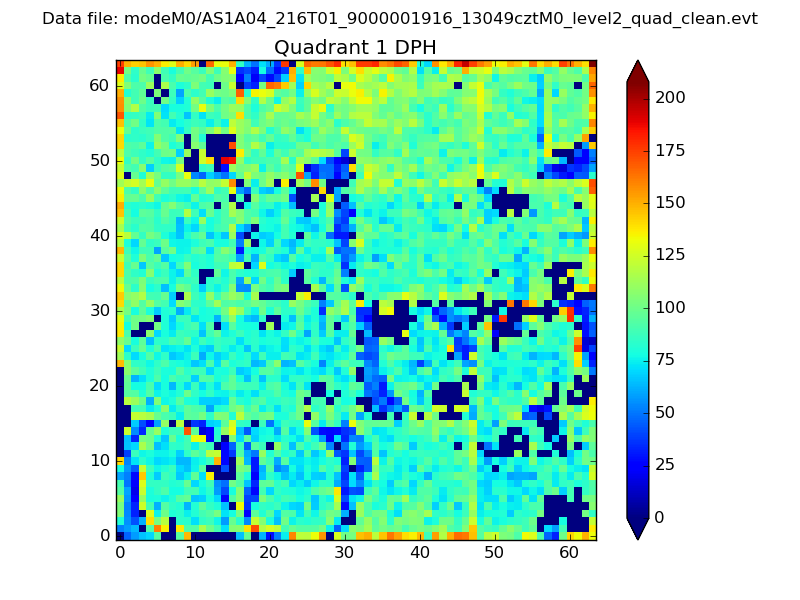
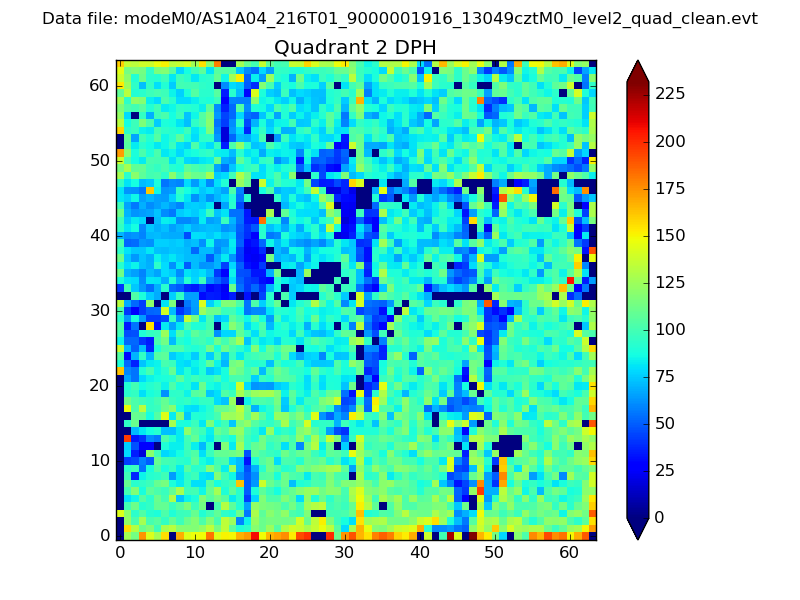
Histogram calculated using DETX and DETY for each event in the final _common_clean file
| Quadrant A | 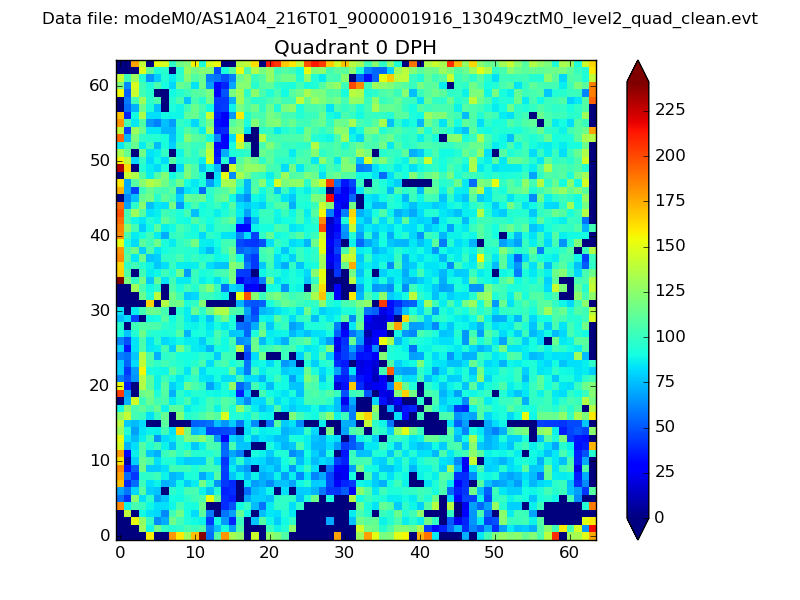 |
 |
Quadrant B |
|---|---|---|---|
| Quadrant D | 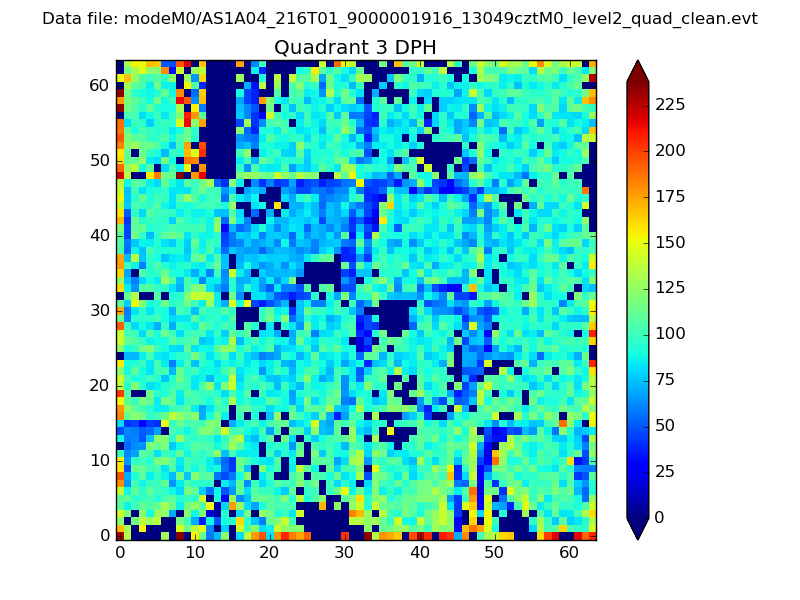 |
 |
Quadrant C |
| Plot type | Count rate plots | Images |
|---|---|---|
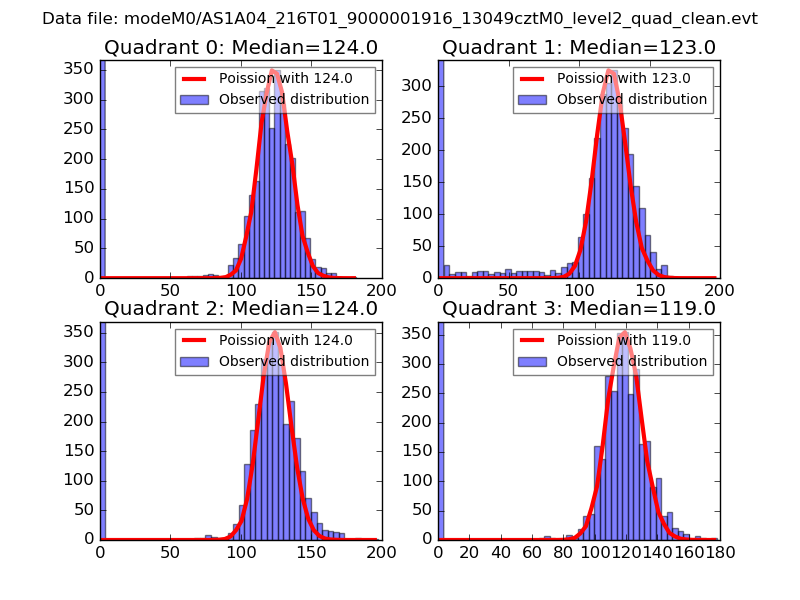
| Comparison with Poisson distribution Blue bars denote a histogram of data divided into 1 sec bins. Red curve is a Poisson curve with rate = median count rate of data. |
 |
 |
| Quadrant-wise count rates Data is divided into 100 sec bins |
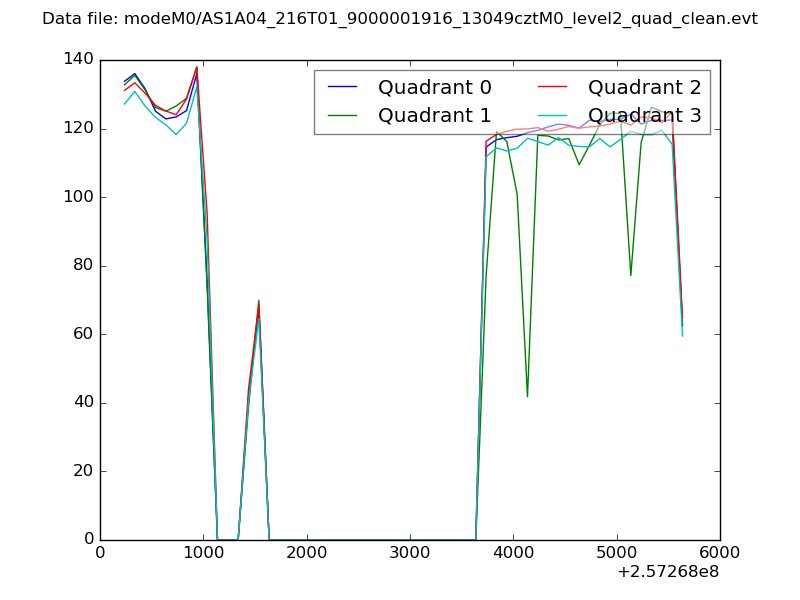 |
|
| Module-wise count rates for Quadrant A Data is divided into 100 sec bins |
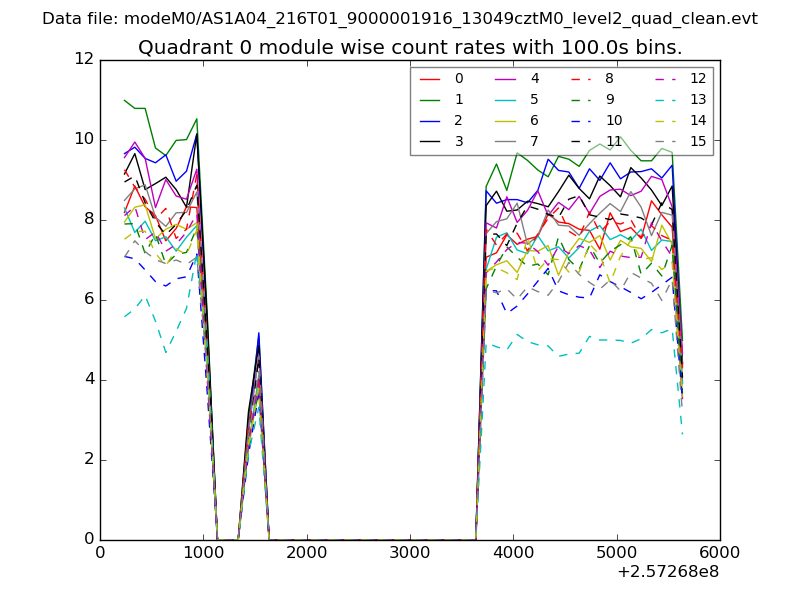 |
 |
| Module-wise count rates for Quadrant B Data is divided into 100 sec bins |
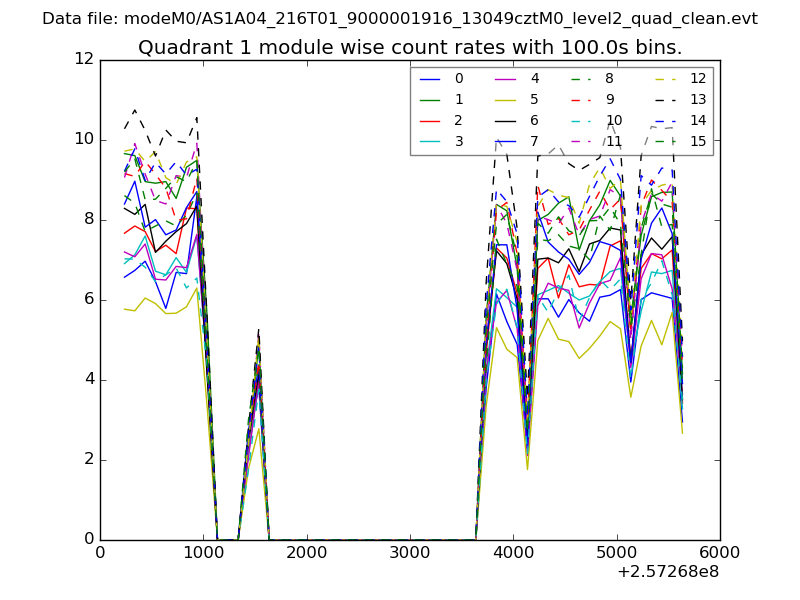 |
 |
| Module-wise count rates for Quadrant C Data is divided into 100 sec bins |
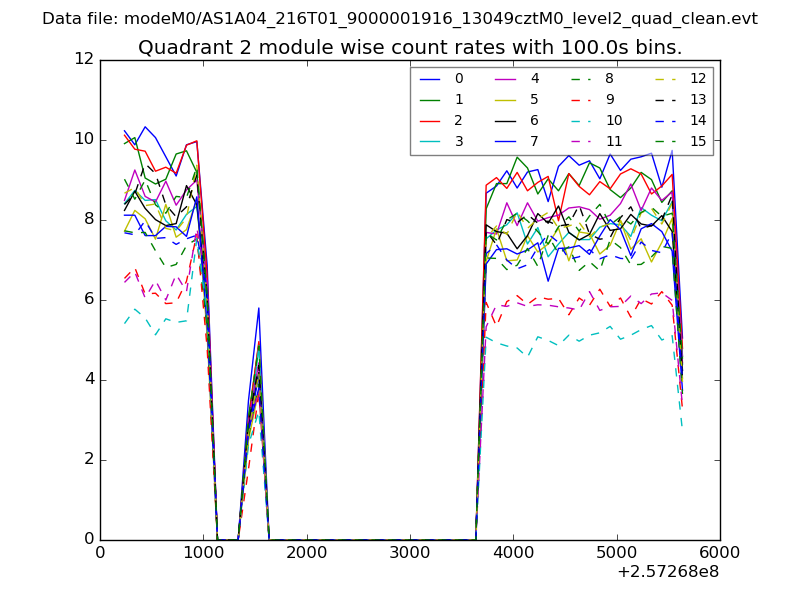 |
 |
| Module-wise count rates for Quadrant D Data is divided into 100 sec bins |
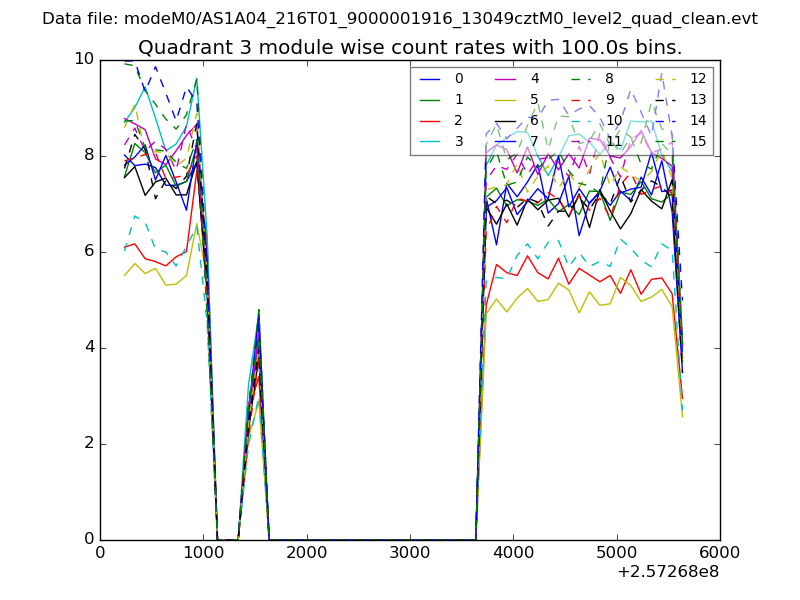 |
 |
| Parameter | Plot |
|---|---|
| CZT HV Monitor | 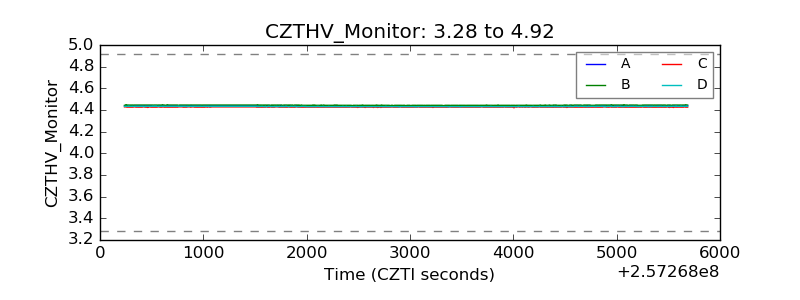 |
| D_VDD | 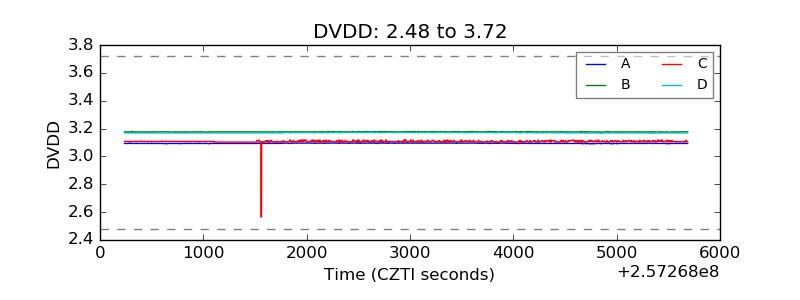 |
| Temperature 1 | 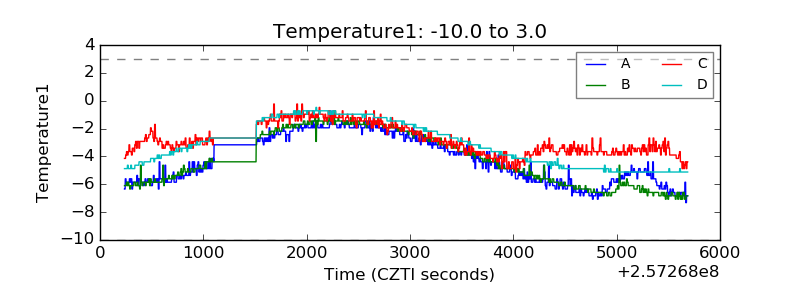 |
| Veto HV Monitor | 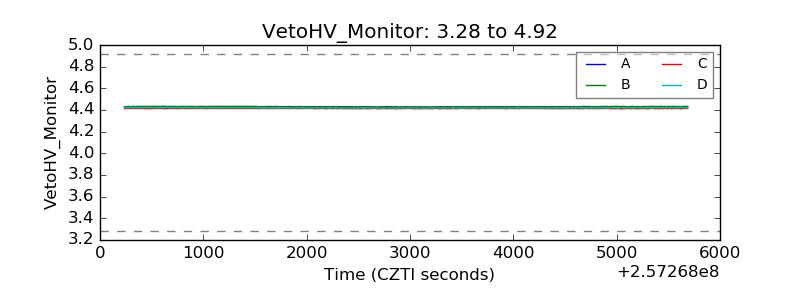 |
| Veto LLD | 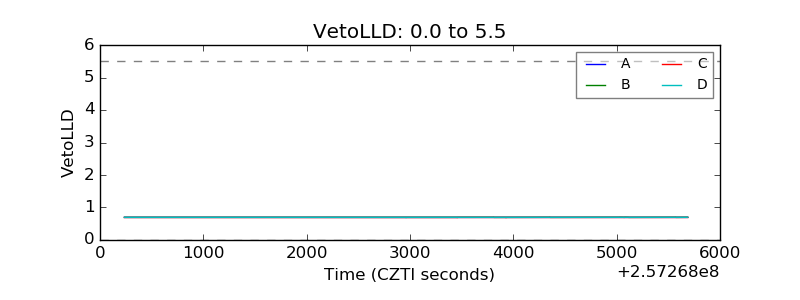 |
| Alpha Counter | 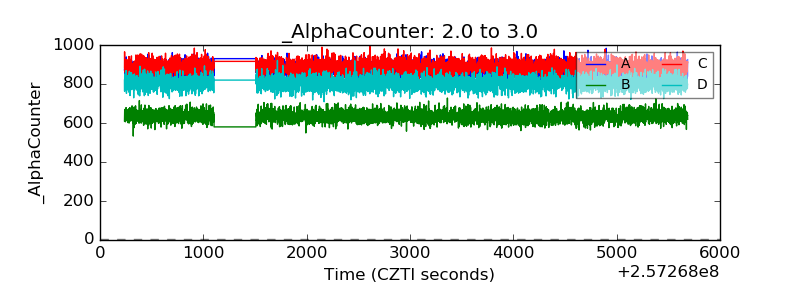 |
| _CPM_Rate | 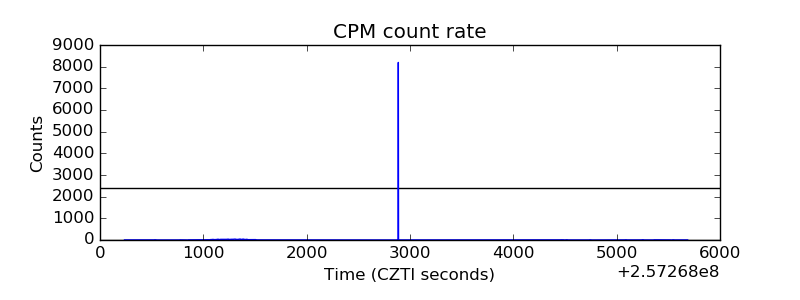 |
| CZT Counter | 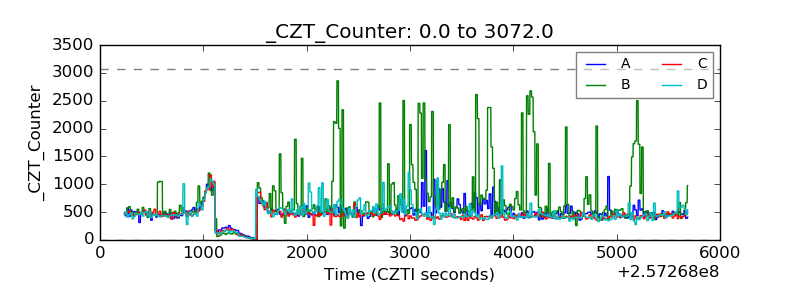 |
| +2.5 Volts monitor | 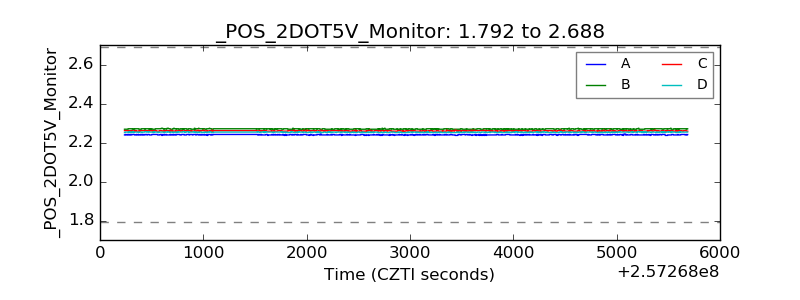 |
| +5 Volts monitor |  |
| _ROLL_ROT | 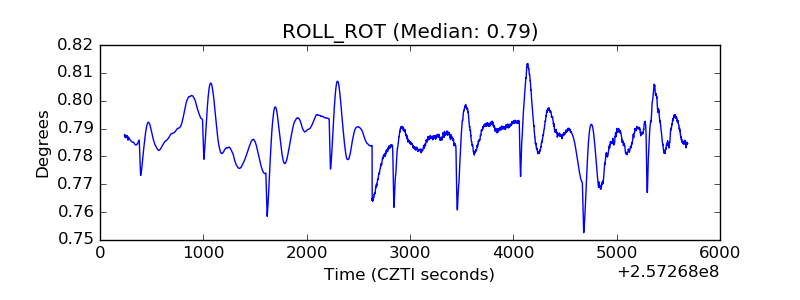 |
| _Roll_DEC | 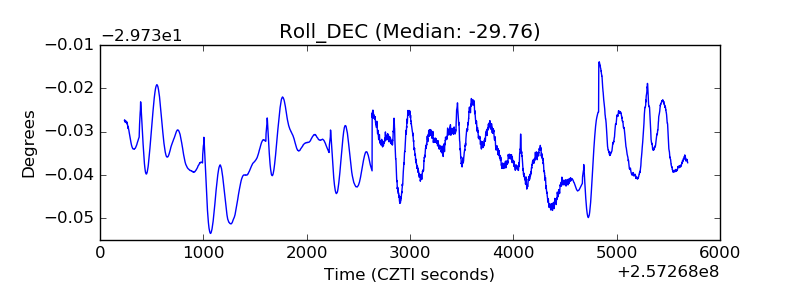 |
| _Roll_RA | 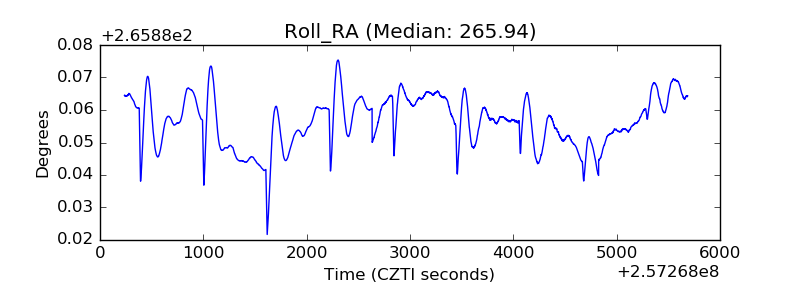 |
| Veto Counter | 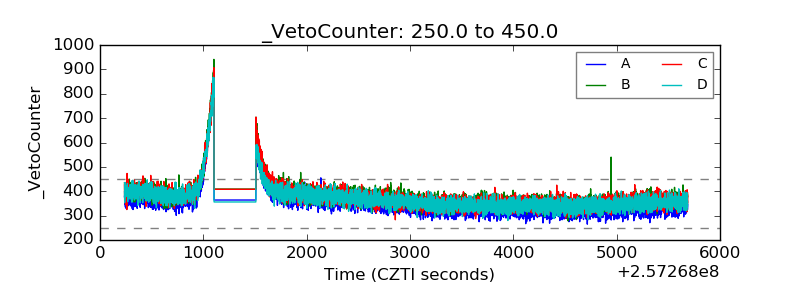 |