| Param | Original file | Final file |
|---|---|---|
| Filename | modeM0/AS1A04_149T01_9000001918cztM0_level2.fits | modeM0/AS1A04_149T01_9000001918cztM0_level2_quad_clean.evt |
| Size (bytes) | 1,103,371,200 | 1,082,111,040 |
| Size | 1.0 GB | 1.0 GB |
| Events in quadrant A | 6,805,924 | 6,783,221 |
| Events in quadrant B | 5,739,896 | 5,363,937 |
| Events in quadrant C | 6,881,308 | 6,557,393 |
| Events in quadrant D | 5,815,734 | 5,907,438 |
| Mode M9 | |||
|---|---|---|---|
| Quadrant | BADHDUFLAG | Total packets | Discarded packets |
| A | 0 | 193 | 0 |
| B | 0 | 193 | 0 |
| C | 0 | 193 | 0 |
| D | 0 | 193 | 0 |
| Mode M0 | |||
|---|---|---|---|
| Quadrant | BADHDUFLAG | Total packets | Discarded packets |
| A | 0 | 259730 | 0 |
| B | 0 | 390566 | 0 |
| C | 0 | 244021 | 0 |
| D | 0 | 303474 | 0 |
| Mode SS | |||
|---|---|---|---|
| Quadrant | BADHDUFLAG | Total packets | Discarded packets |
| A | 0 | 2428 | 0 |
| B | 0 | 2428 | 0 |
| C | 0 | 2428 | 0 |
| D | 0 | 2428 | 0 |
| Quadrant | Total seconds | Saturated seconds | Saturation percentage |
|---|---|---|---|
| A | 119071 | 1982 | 1.664553% |
| B | 119071 | 24477 | 20.556643% |
| C | 119071 | 1224 | 1.027958% |
| D | 119071 | 5067 | 4.255444% |
Noise dominated data is calculated using 1-second bins in cleaned event files. If a bin has >2000 counts, and if more than 50% of those come from <1% of pixels, then it is considered to be noise-dominated and hence unusable.
| Quadrant | # 1 sec bins | Bins with >0 counts | Bins with >2000 counts | High rate bins dominated by noise | Noise dominated (total time) | Noise dominated (detector-on time) | Marked lightcurve |
|---|---|---|---|---|---|---|---|
| A | 138377 | 119072 | 0 | 0 | 0.00% | 0.00% |  |
| B | 138377 | 114122 | 0 | 0 | 0.00% | 0.00% |  |
| C | 138377 | 119071 | 0 | 0 | 0.00% | 0.00% |  |
| D | 138377 | 119000 | 0 | 0 | 0.00% | 0.00% |  |
Top three noisy pixels from each quadrant. If the there are fewer than three noisy pixels in the level2.evt file, extra rows are filled as -1
| Pixel properties | Quadrant properties | ||||||
|---|---|---|---|---|---|---|---|
| Quadrant | DetID | PixID | Counts | Sigma | Mean | Median | Sigma |
| A | 0 | 29 | 6537 | 11.14 | 1773 | 1663 | 437.4 |
| A | 7 | 110 | 5691 | 9.21 | 1773 | 1663 | 437.4 |
| A | 9 | 19 | 5081 | 7.81 | 1773 | 1663 | 437.4 |
| B | 2 | 9 | 4930 | 11.83 | 1514 | 1447 | 294.4 |
| B | 14 | 254 | 3781 | 7.93 | 1514 | 1447 | 294.4 |
| B | 5 | 128 | 3752 | 7.83 | 1514 | 1447 | 294.4 |
| C | 1 | 80 | 5217 | 7.64 | 1814 | 1696 | 460.7 |
| C | 1 | 81 | 5168 | 7.54 | 1814 | 1696 | 460.7 |
| C | 12 | 241 | 4790 | 6.72 | 1814 | 1696 | 460.7 |
| D | 6 | 231 | 4339 | 6.46 | 1658 | 1514 | 437.6 |
| D | 10 | 189 | 4152 | 6.03 | 1658 | 1514 | 437.6 |
| D | 3 | 14 | 4130 | 5.98 | 1658 | 1514 | 437.6 |
Histogram calculated using DETX and DETY for each event in the final _common_clean file
| Quadrant A | 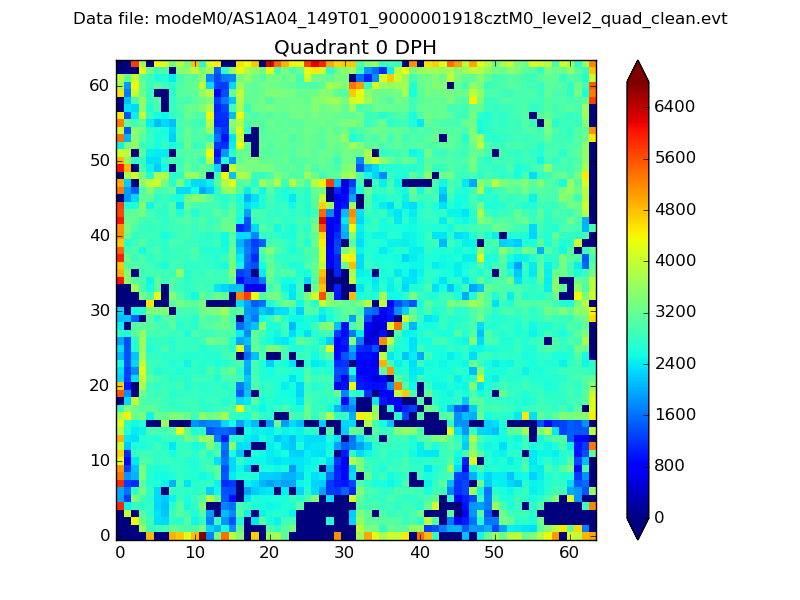 |
 |
Quadrant B |
|---|---|---|---|
| Quadrant D |  |
 |
Quadrant C |
| Plot type | Count rate plots | Images |
|---|---|---|
| Comparison with Poisson distribution Blue bars denote a histogram of data divided into 1 sec bins. Red curve is a Poisson curve with rate = median count rate of data. |
 |
 |
| Quadrant-wise count rates Data is divided into 100 sec bins |
 |
|
| Module-wise count rates for Quadrant A Data is divided into 100 sec bins |
 |
 |
| Module-wise count rates for Quadrant B Data is divided into 100 sec bins |
 |
 |
| Module-wise count rates for Quadrant C Data is divided into 100 sec bins |
 |
 |
| Module-wise count rates for Quadrant D Data is divided into 100 sec bins |
 |
 |
| Parameter | Plot |
|---|---|
| CZT HV Monitor |  |
| D_VDD |  |
| Temperature 1 |  |
| Veto HV Monitor |  |
| Veto LLD |  |
| Alpha Counter |  |
| _CPM_Rate |  |
| CZT Counter |  |
| +2.5 Volts monitor |  |
| +5 Volts monitor |  |
| _ROLL_ROT | 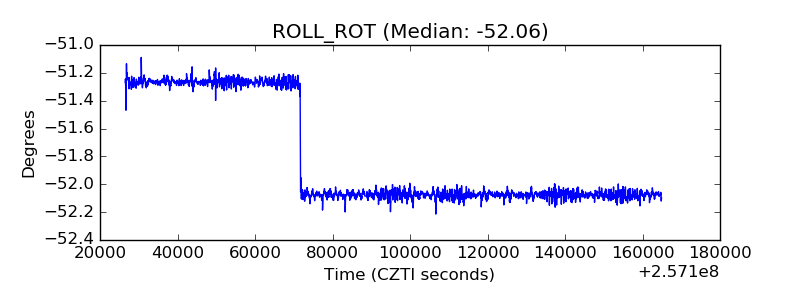 |
| _Roll_DEC |  |
| _Roll_RA |  |
| Veto Counter |  |