| Param | Original file | Final file |
|---|---|---|
| Filename | modeM0/AS1A04_149T01_9000001918_13022cztM0_level2.evt | modeM0/AS1A04_149T01_9000001918_13022cztM0_level2_quad_clean.evt |
| Size (bytes) | 25,842,240 | 7,591,680 |
| Size | 24.6 MB | 7.2 MB |
| Events in quadrant A | 178,176 | 49,219 |
| Events in quadrant B | 173,752 | 50,123 |
| Events in quadrant C | 169,078 | 48,602 |
| Events in quadrant D | 231,088 | 45,673 |
| Mode M0 | |||
|---|---|---|---|
| Quadrant | BADHDUFLAG | Total packets | Discarded packets |
| A | 0 | 805 | 1 |
| B | 0 | 803 | 0 |
| C | 0 | 796 | 0 |
| D | 0 | 966 | 0 |
| Mode SS | |||
|---|---|---|---|
| Quadrant | BADHDUFLAG | Total packets | Discarded packets |
| A | 0 | 8 | 0 |
| B | 0 | 8 | 0 |
| C | 0 | 8 | 0 |
| D | 0 | 8 | 0 |
| Quadrant | Total seconds | Saturated seconds | Saturation percentage |
|---|---|---|---|
| A | 396 | 0 | 0.000000% |
| B | 396 | 0 | 0.000000% |
| C | 396 | 1 | 0.252525% |
| D | 396 | 3 | 0.757576% |
Noise dominated data is calculated using 1-second bins in cleaned event files. If a bin has >2000 counts, and if more than 50% of those come from <1% of pixels, then it is considered to be noise-dominated and hence unusable.
| Quadrant | # 1 sec bins | Bins with >0 counts | Bins with >2000 counts | High rate bins dominated by noise | Noise dominated (total time) | Noise dominated (detector-on time) | Marked lightcurve |
|---|---|---|---|---|---|---|---|
| A | 397 | 397 | 0 | 0 | 0.00% | 0.00% | 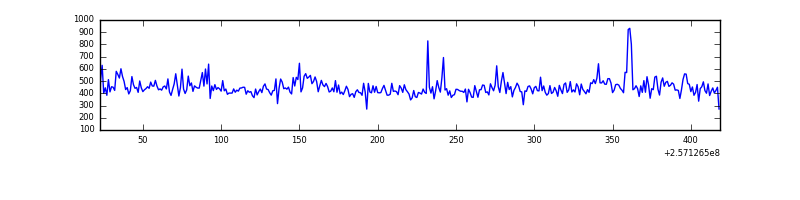 |
| B | 397 | 397 | 0 | 0 | 0.00% | 0.00% | 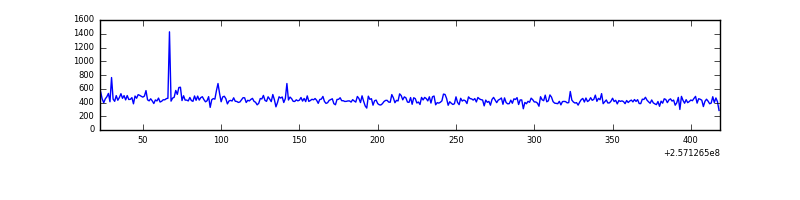 |
| C | 397 | 397 | 0 | 0 | 0.00% | 0.00% | 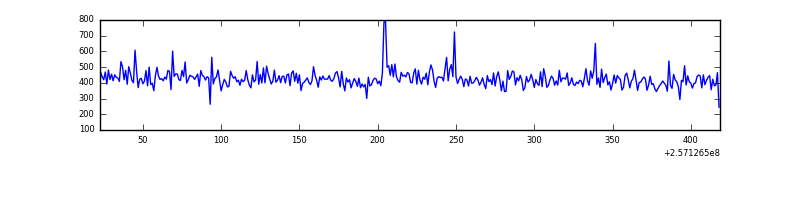 |
| D | 397 | 397 | 4 | 4 | 1.01% | 1.01% | 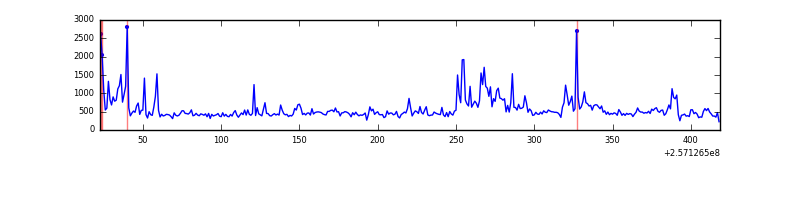 |
Top three noisy pixels from each quadrant. If the there are fewer than three noisy pixels in the level2.evt file, extra rows are filled as -1
| Pixel properties | Quadrant properties | ||||||
|---|---|---|---|---|---|---|---|
| Quadrant | DetID | PixID | Counts | Sigma | Mean | Median | Sigma |
| A | 12 | 189 | 11704 | 1084.73 | 42 | 41 | 10.8 |
| A | 1 | 162 | 1171 | 105.1 | 42 | 41 | 10.8 |
| A | 0 | 226 | 371 | 30.69 | 42 | 41 | 10.8 |
| B | 4 | 239 | 2486 | 234.6 | 43 | 42 | 10.4 |
| B | 0 | 219 | 1846 | 173.17 | 43 | 42 | 10.4 |
| B | 12 | 111 | 951 | 87.26 | 43 | 42 | 10.4 |
| C | 12 | 4 | 2572 | 215.56 | 42 | 42 | 11.7 |
| C | 13 | 61 | 304 | 22.32 | 42 | 42 | 11.7 |
| C | 3 | 202 | 116 | 6.3 | 42 | 42 | 11.7 |
| D | 1 | 52 | 77100 | 6647.52 | 40 | 39 | 11.6 |
| D | 2 | 234 | 1157 | 96.44 | 40 | 39 | 11.6 |
| D | 12 | 0 | 576 | 46.32 | 40 | 39 | 11.6 |
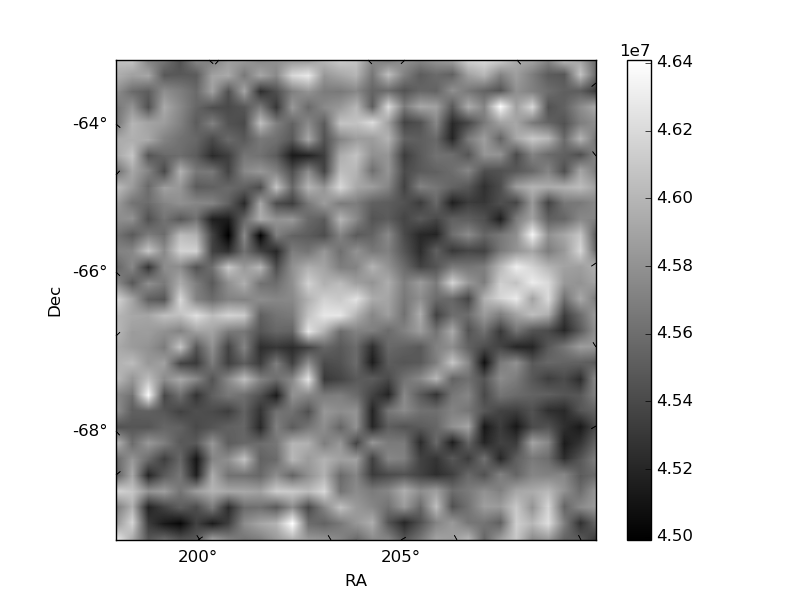
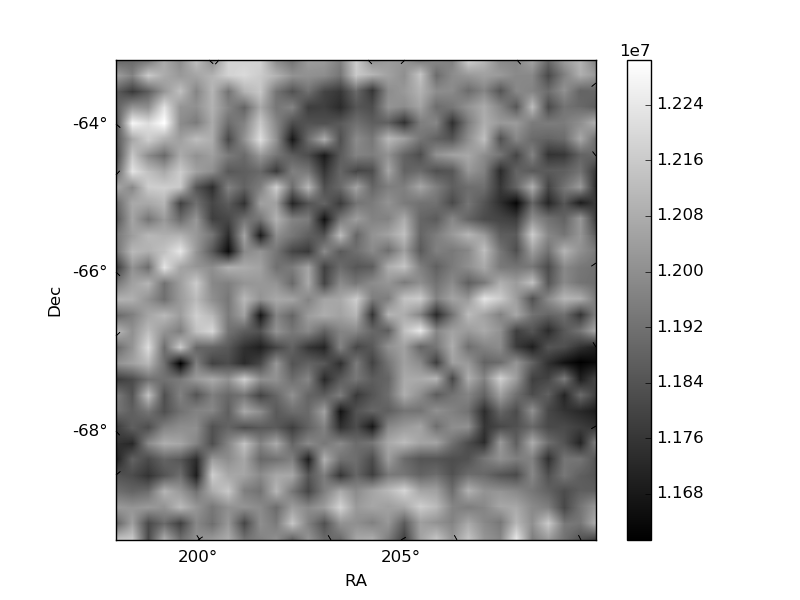
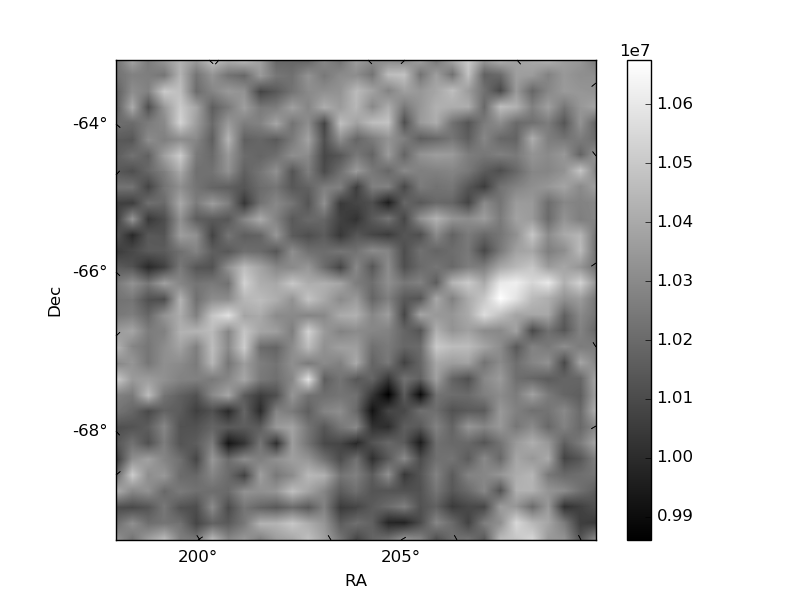
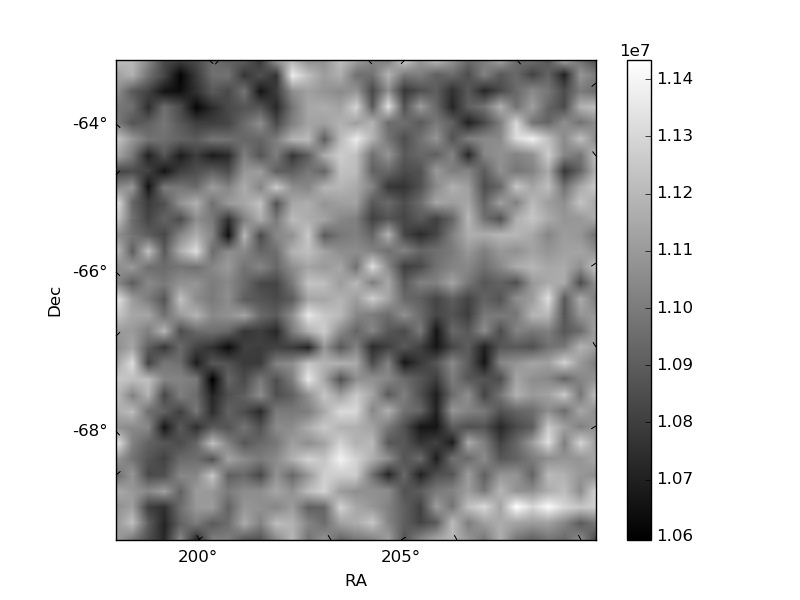
Histogram calculated using DETX and DETY for each event in the final _common_clean file
| Quadrant A | 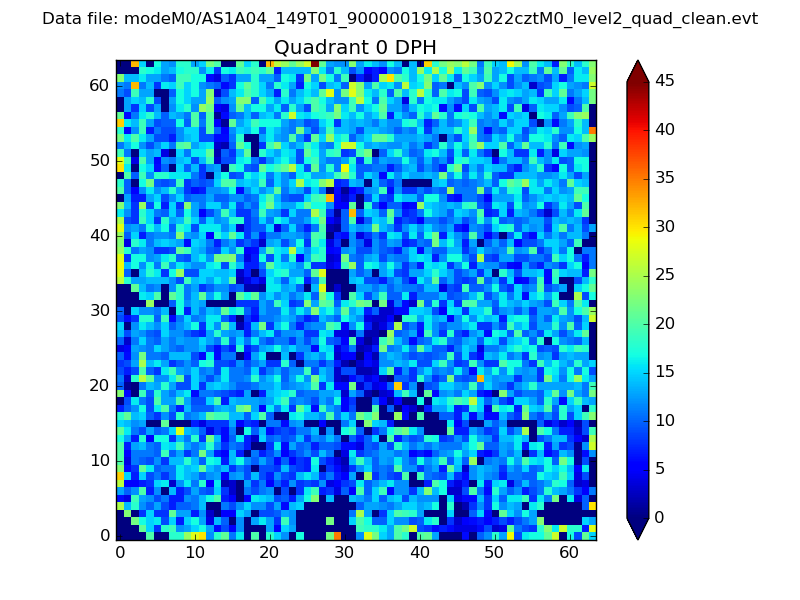 |
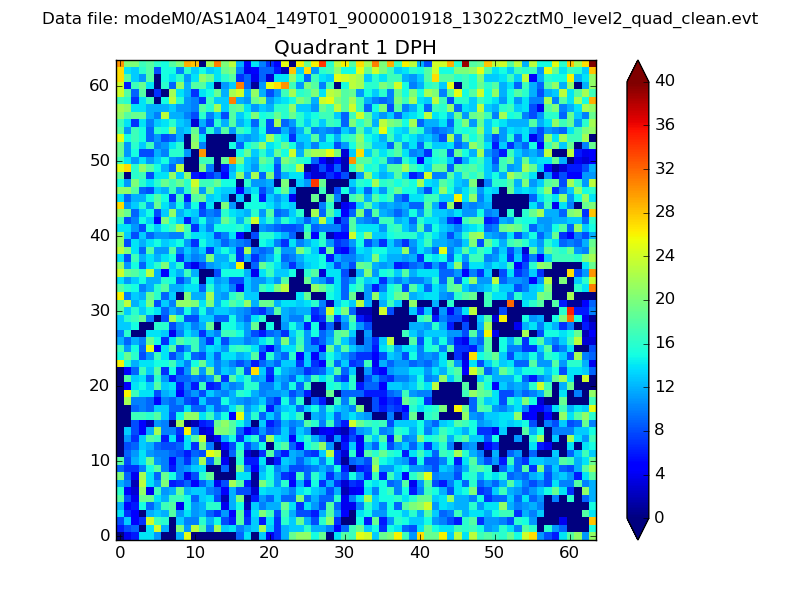 |
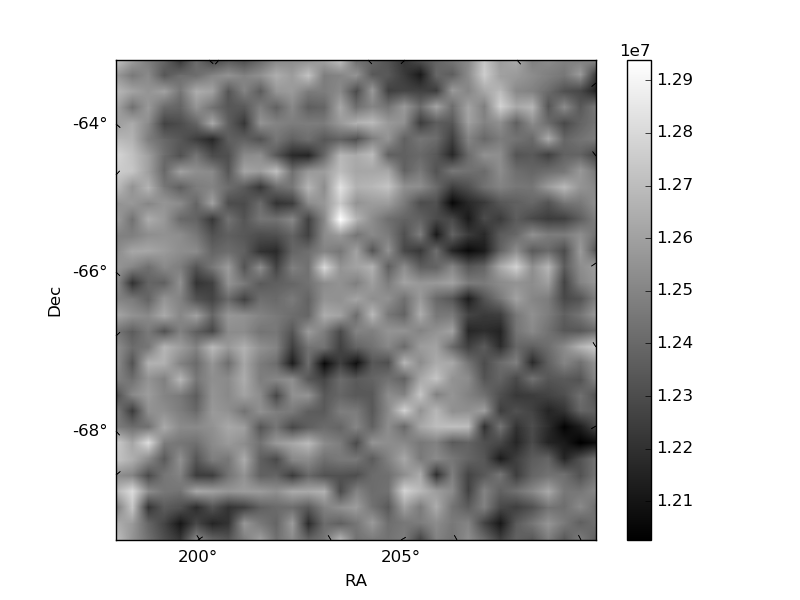
Quadrant B |
|---|---|---|---|
| Quadrant D | 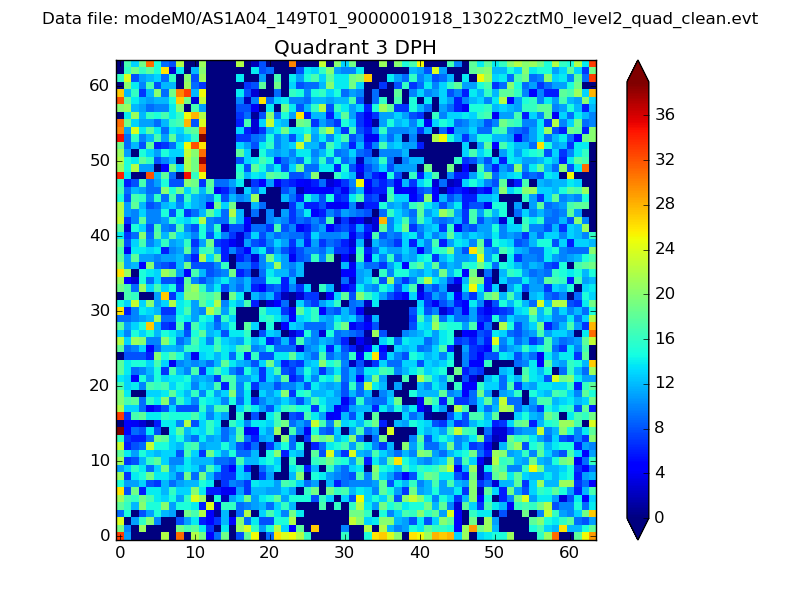 |
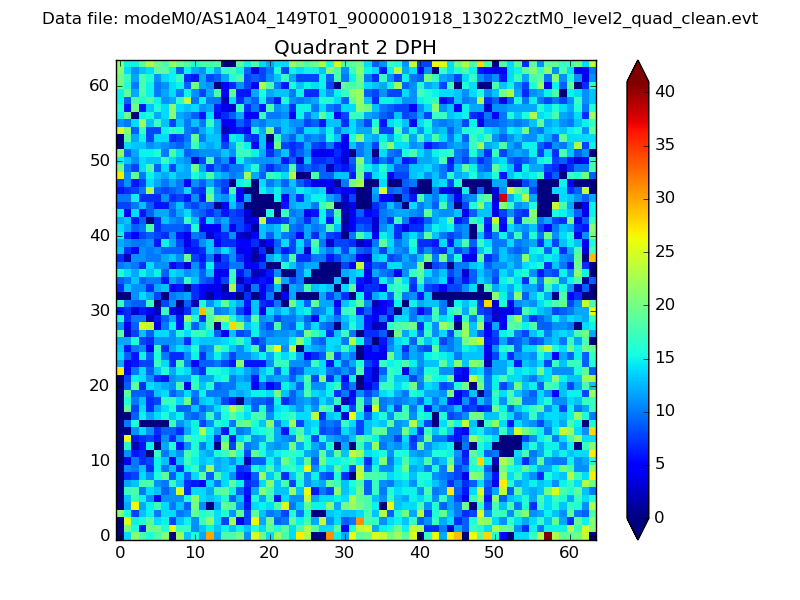 |
Quadrant C |
| Plot type | Count rate plots | Images |
|---|---|---|
| Comparison with Poisson distribution Blue bars denote a histogram of data divided into 1 sec bins. Red curve is a Poisson curve with rate = median count rate of data. |
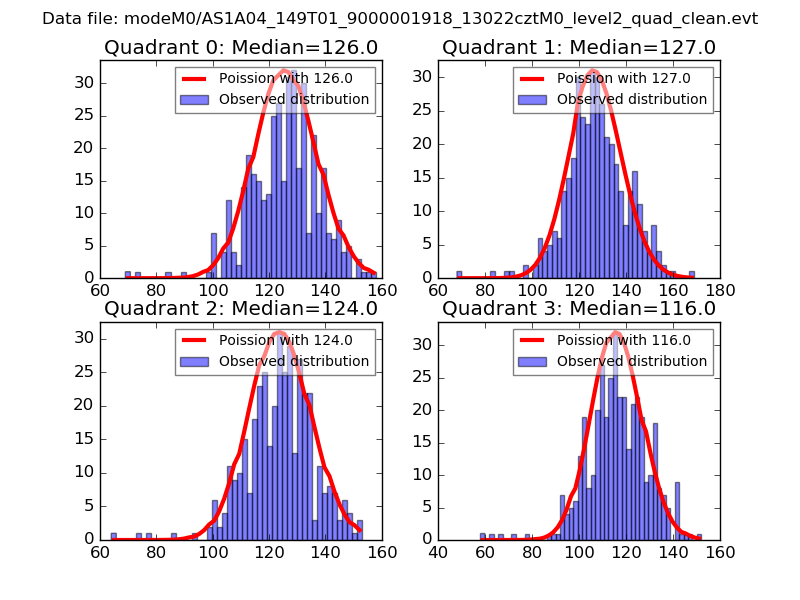 |
 |
| Quadrant-wise count rates Data is divided into 100 sec bins |
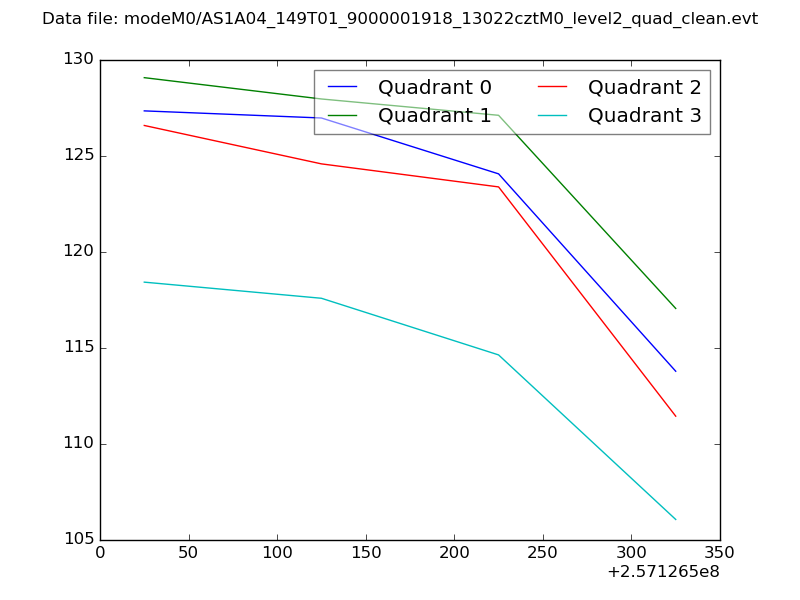 |
|
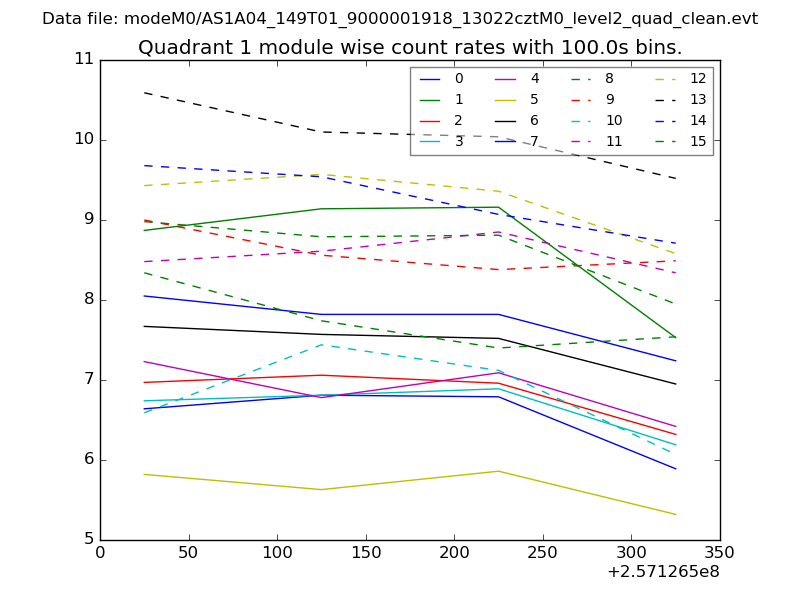
| Module-wise count rates for Quadrant A Data is divided into 100 sec bins |
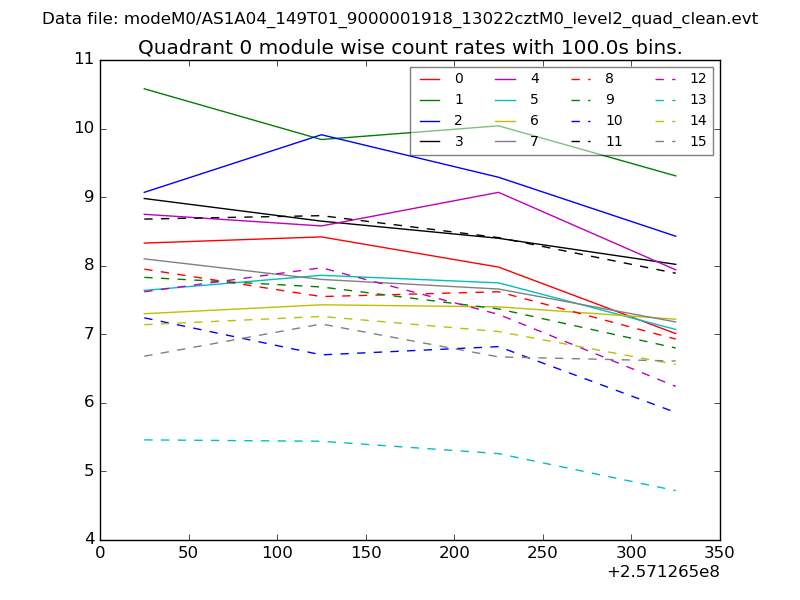 |
 |
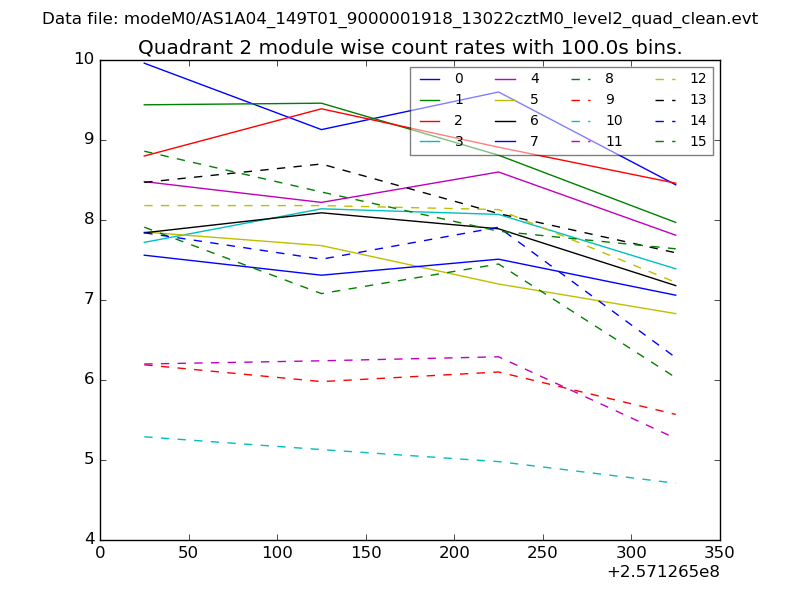
| Module-wise count rates for Quadrant B Data is divided into 100 sec bins |
 |
 |
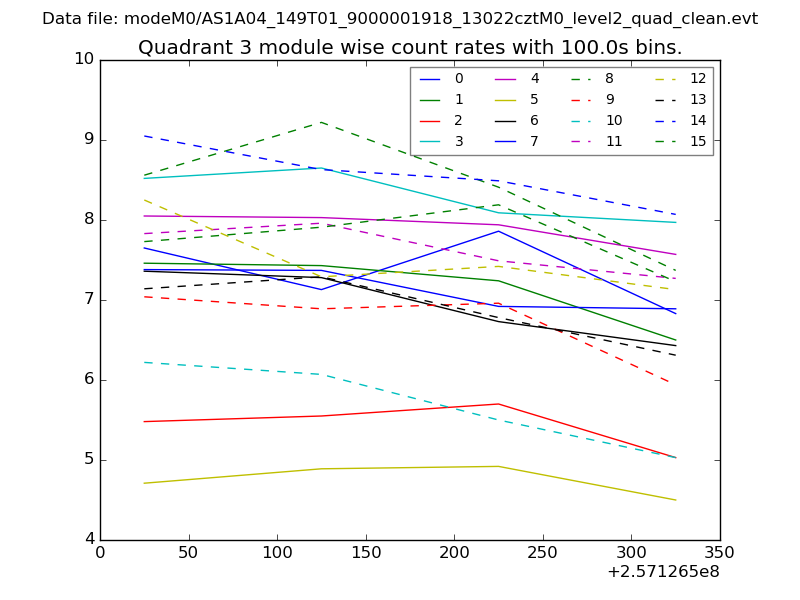
| Module-wise count rates for Quadrant C Data is divided into 100 sec bins |
 |
 |
| Module-wise count rates for Quadrant D Data is divided into 100 sec bins |
 |
 |
| Parameter | Plot |
|---|---|
| CZT HV Monitor | 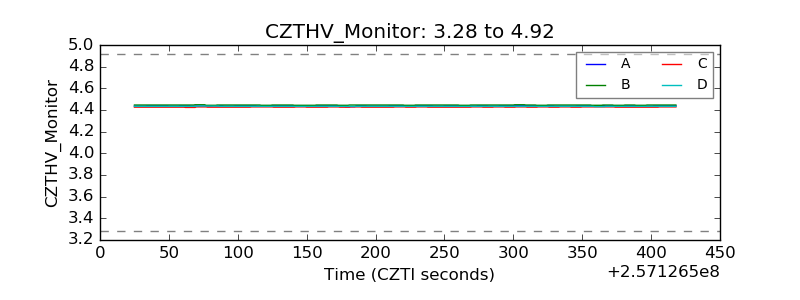 |
| D_VDD | 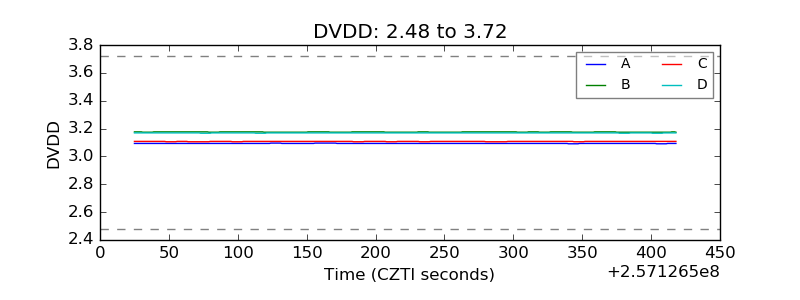 |
| Temperature 1 |  |
| Veto HV Monitor | 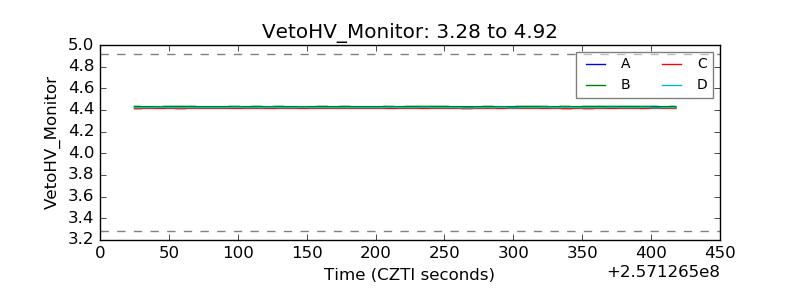 |
| Veto LLD | 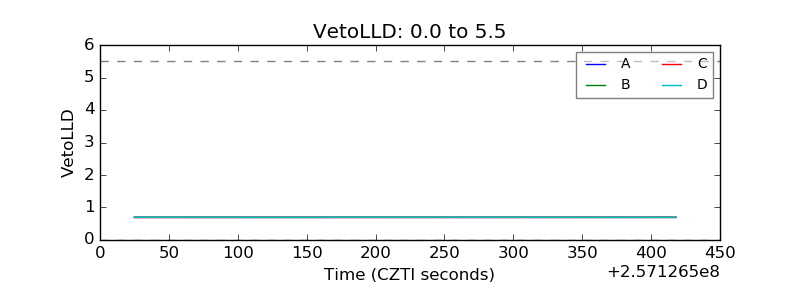 |
| Alpha Counter | 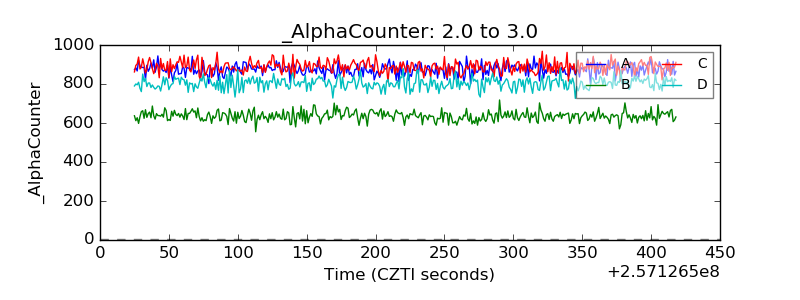 |
| _CPM_Rate | 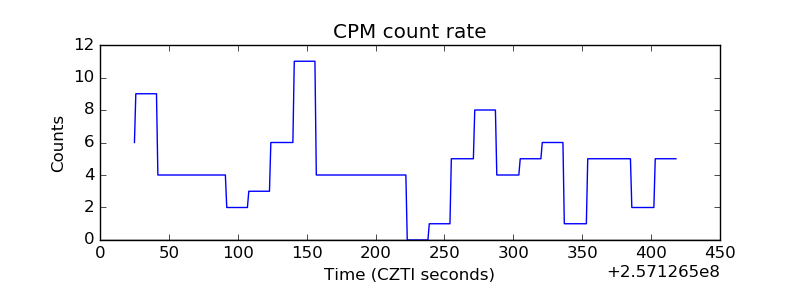 |
| CZT Counter | 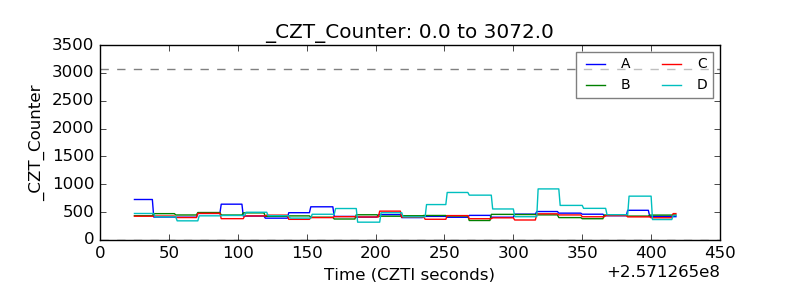 |
| +2.5 Volts monitor |  |
| +5 Volts monitor |  |
| _ROLL_ROT | 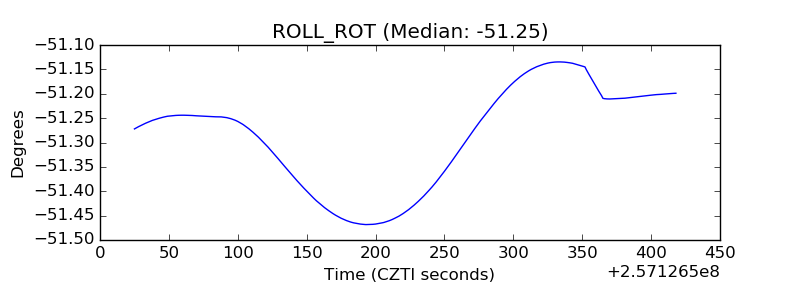 |
| _Roll_DEC |  |
| _Roll_RA | 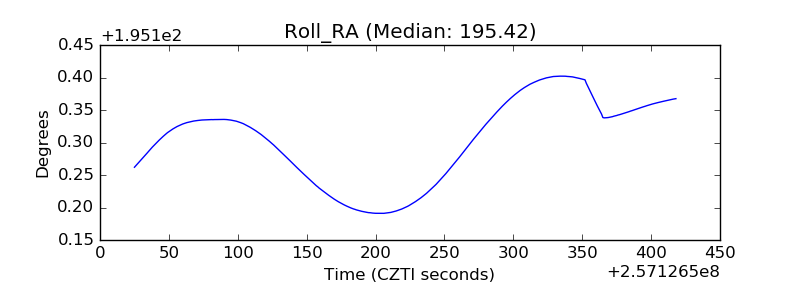 |
| Veto Counter | 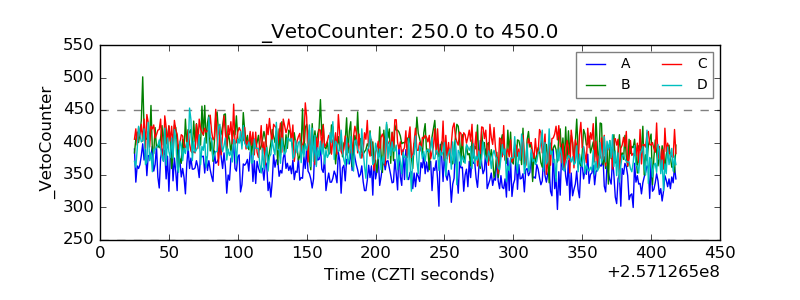 |