| Param | Original file | Final file |
|---|---|---|
| Filename | modeM0/AS1A04_149T01_9000001918_13024cztM0_level2.evt | modeM0/AS1A04_149T01_9000001918_13024cztM0_level2_quad_clean.evt |
| Size (bytes) | 477,734,400 | 77,987,520 |
| Size | 455.6 MB | 74.4 MB |
| Events in quadrant A | 2,711,246 | 513,758 |
| Events in quadrant B | 3,367,390 | 504,945 |
| Events in quadrant C | 2,512,983 | 517,597 |
| Events in quadrant D | 5,504,469 | 441,655 |
| Mode M9 | |||
|---|---|---|---|
| Quadrant | BADHDUFLAG | Total packets | Discarded packets |
| A | 0 | 11 | 0 |
| B | 0 | 11 | 0 |
| C | 0 | 11 | 0 |
| D | 0 | 11 | 0 |
| Mode M0 | |||
|---|---|---|---|
| Quadrant | BADHDUFLAG | Total packets | Discarded packets |
| A | 0 | 11561 | 2 |
| B | 0 | 13691 | 1 |
| C | 0 | 11142 | 1 |
| D | 0 | 20249 | 1 |
| Mode SS | |||
|---|---|---|---|
| Quadrant | BADHDUFLAG | Total packets | Discarded packets |
| A | 0 | 112 | 0 |
| B | 0 | 112 | 0 |
| C | 0 | 112 | 0 |
| D | 0 | 112 | 0 |
| Quadrant | Total seconds | Saturated seconds | Saturation percentage |
|---|---|---|---|
| A | 5476 | 11 | 0.200877% |
| B | 5476 | 430 | 7.852447% |
| C | 5476 | 11 | 0.200877% |
| D | 5476 | 692 | 12.636961% |
Noise dominated data is calculated using 1-second bins in cleaned event files. If a bin has >2000 counts, and if more than 50% of those come from <1% of pixels, then it is considered to be noise-dominated and hence unusable.
| Quadrant | # 1 sec bins | Bins with >0 counts | Bins with >2000 counts | High rate bins dominated by noise | Noise dominated (total time) | Noise dominated (detector-on time) | Marked lightcurve |
|---|---|---|---|---|---|---|---|
| A | 6637 | 5478 | 0 | 0 | 0.00% | 0.00% |  |
| B | 6637 | 5478 | 209 | 209 | 3.15% | 3.82% |  |
| C | 6637 | 5478 | 1 | 1 | 0.02% | 0.02% |  |
| D | 6637 | 5478 | 561 | 561 | 8.45% | 10.24% |  |
Top three noisy pixels from each quadrant. If the there are fewer than three noisy pixels in the level2.evt file, extra rows are filled as -1
| Pixel properties | Quadrant properties | ||||||
|---|---|---|---|---|---|---|---|
| Quadrant | DetID | PixID | Counts | Sigma | Mean | Median | Sigma |
| A | 12 | 189 | 153691 | 1176.13 | 643 | 630 | 130.1 |
| A | 1 | 162 | 23307 | 174.25 | 643 | 630 | 130.1 |
| A | 15 | 223 | 16851 | 124.64 | 643 | 630 | 130.1 |
| B | 4 | 239 | 842590 | 7193.07 | 615 | 599 | 117.1 |
| B | 3 | 64 | 37105 | 311.87 | 615 | 599 | 117.1 |
| B | 0 | 219 | 23734 | 197.64 | 615 | 599 | 117.1 |
| C | 14 | 234 | 6123 | 37.0 | 641 | 644 | 148.1 |
| C | 12 | 4 | 5629 | 33.66 | 641 | 644 | 148.1 |
| C | 13 | 61 | 4578 | 26.57 | 641 | 644 | 148.1 |
| D | 1 | 52 | 3185124 | 22546.93 | 590 | 575 | 141.2 |
| D | 8 | 195 | 87622 | 616.3 | 590 | 575 | 141.2 |
| D | 2 | 234 | 15857 | 108.2 | 590 | 575 | 141.2 |
Histogram calculated using DETX and DETY for each event in the final _common_clean file
| Quadrant A |  |
 |
Quadrant B |
|---|---|---|---|
| Quadrant D |  |
 |
Quadrant C |
| Plot type | Count rate plots | Images |
|---|---|---|
| Comparison with Poisson distribution Blue bars denote a histogram of data divided into 1 sec bins. Red curve is a Poisson curve with rate = median count rate of data. |
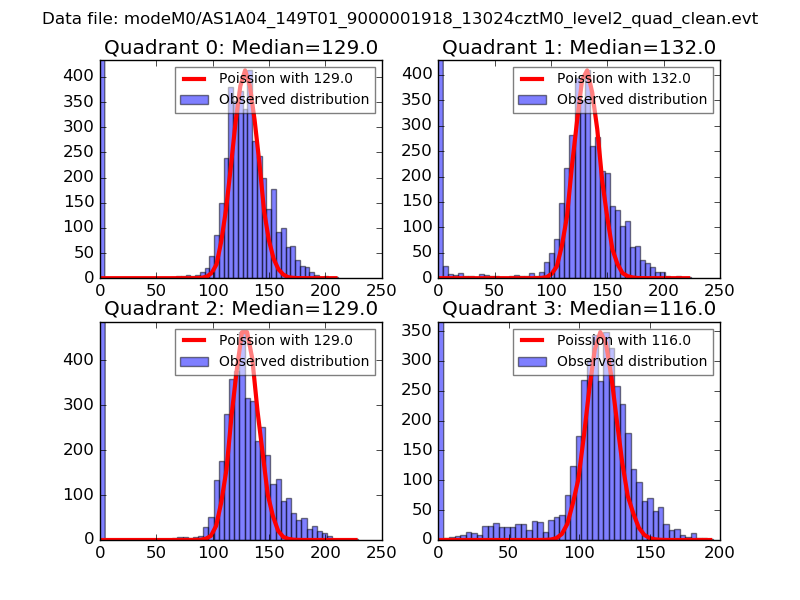 |
 |
| Quadrant-wise count rates Data is divided into 100 sec bins |
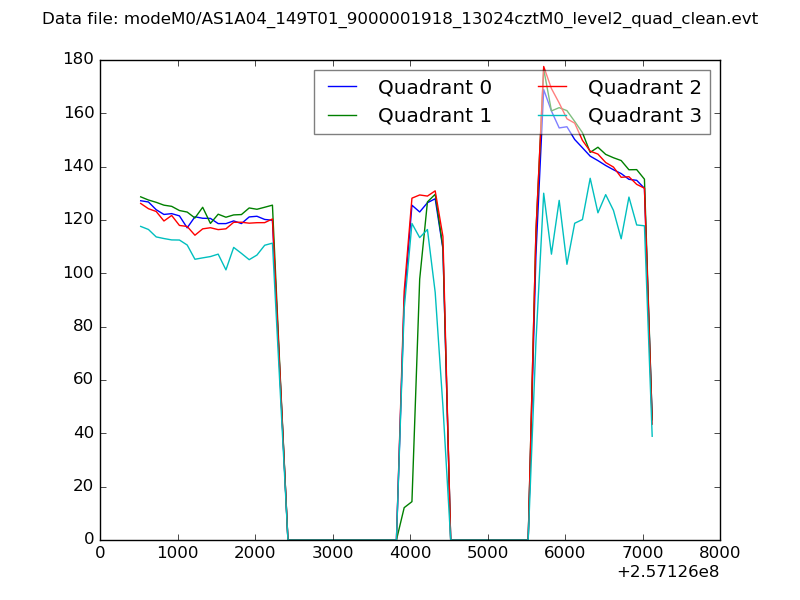 |
|
| Module-wise count rates for Quadrant A Data is divided into 100 sec bins |
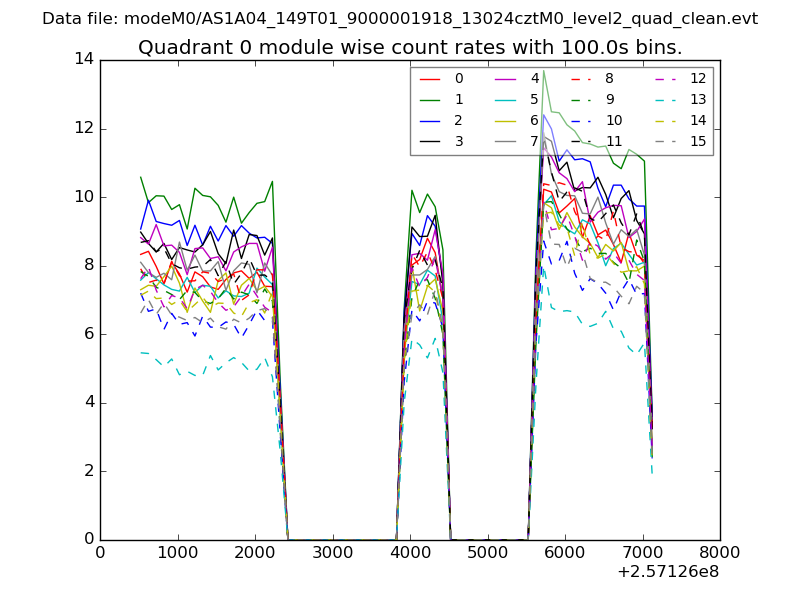 |
 |
| Module-wise count rates for Quadrant B Data is divided into 100 sec bins |
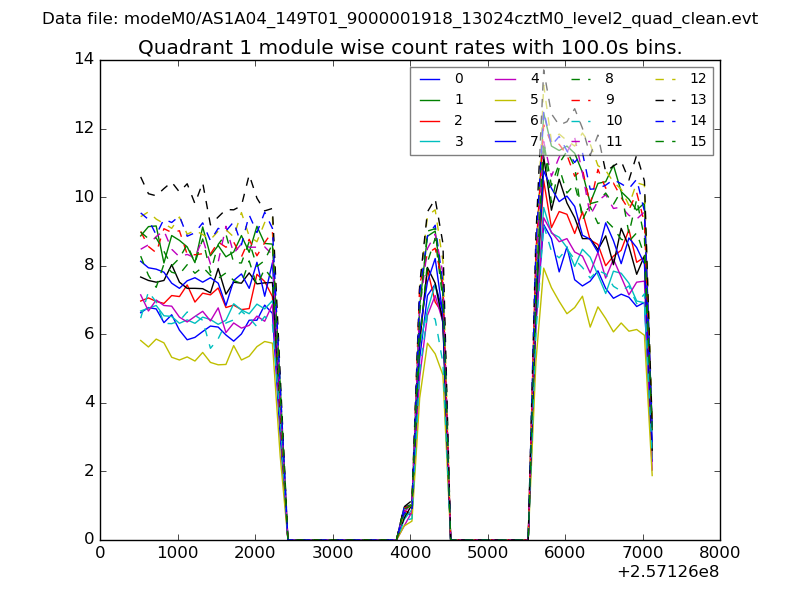 |
 |
| Module-wise count rates for Quadrant C Data is divided into 100 sec bins |
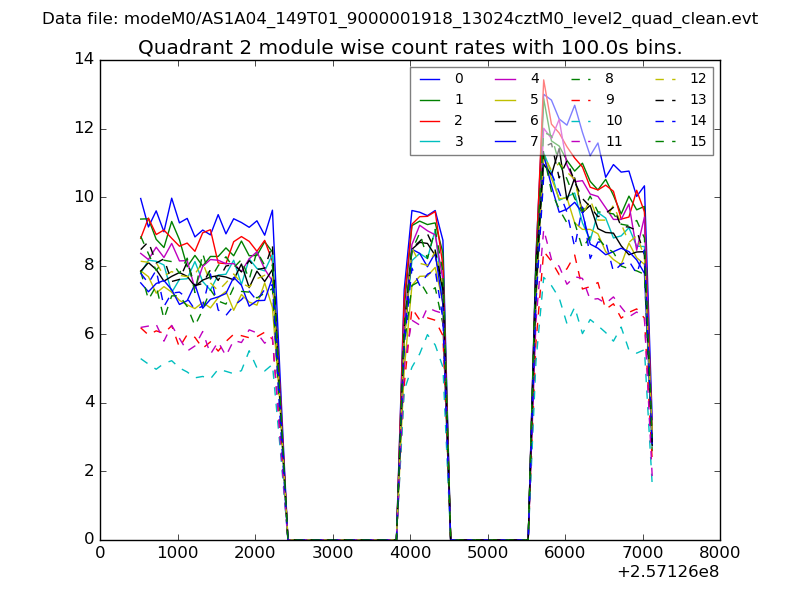 |
 |
| Module-wise count rates for Quadrant D Data is divided into 100 sec bins |
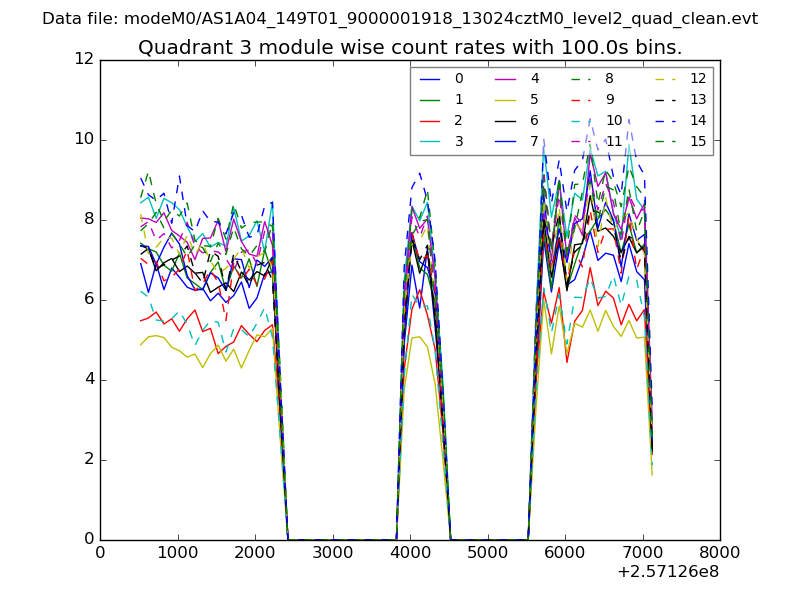 |
 |
| Parameter | Plot |
|---|---|
| CZT HV Monitor | 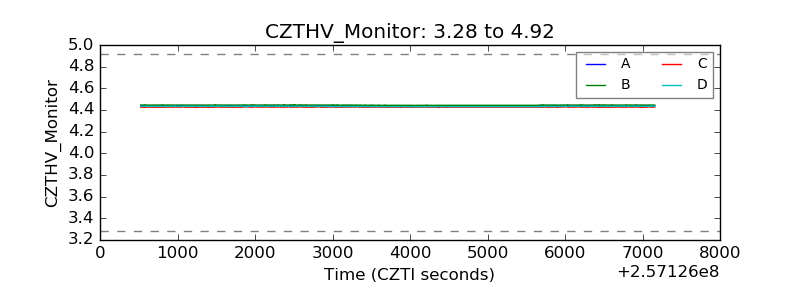 |
| D_VDD |  |
| Temperature 1 |  |
| Veto HV Monitor |  |
| Veto LLD |  |
| Alpha Counter | 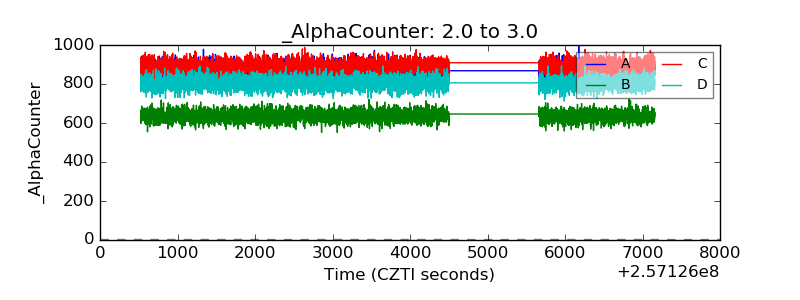 |
| _CPM_Rate | 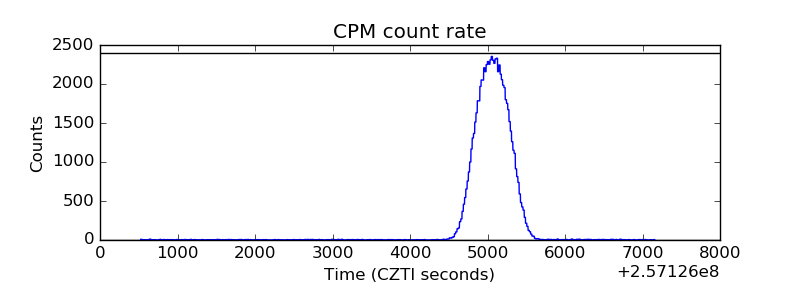 |
| CZT Counter |  |
| +2.5 Volts monitor |  |
| +5 Volts monitor |  |
| _ROLL_ROT | 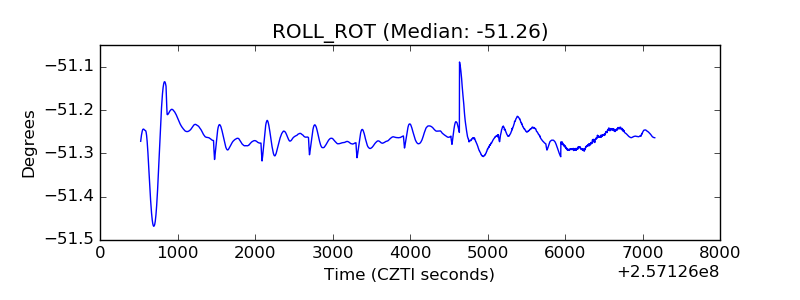 |
| _Roll_DEC | 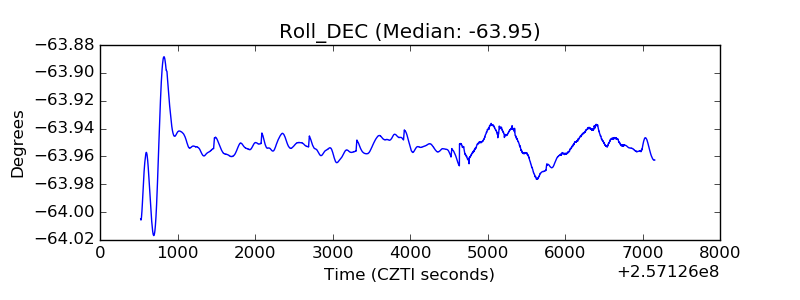 |
| _Roll_RA |  |
| Veto Counter | 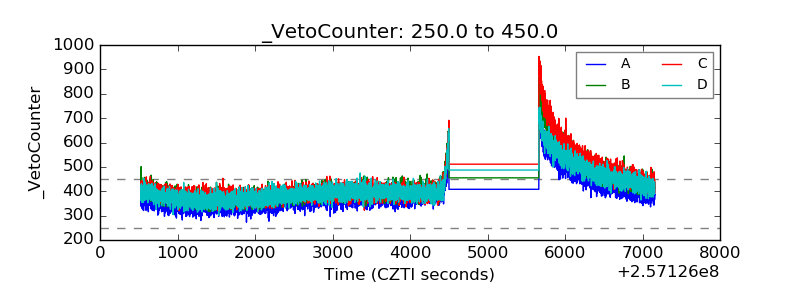 |