| Param | Original file | Final file |
|---|---|---|
| Filename | modeM0/AS1A04_149T01_9000001918_13026cztM0_level2.evt | modeM0/AS1A04_149T01_9000001918_13026cztM0_level2_quad_clean.evt |
| Size (bytes) | 514,566,720 | 101,350,080 |
| Size | 490.7 MB | 96.7 MB |
| Events in quadrant A | 3,207,625 | 680,588 |
| Events in quadrant B | 4,768,487 | 624,559 |
| Events in quadrant C | 3,086,887 | 698,381 |
| Events in quadrant D | 4,099,393 | 632,422 |
| Mode M9 | |||
|---|---|---|---|
| Quadrant | BADHDUFLAG | Total packets | Discarded packets |
| A | 0 | 19 | 0 |
| B | 0 | 19 | 0 |
| C | 0 | 19 | 0 |
| D | 0 | 20 | 0 |
| Mode M0 | |||
|---|---|---|---|
| Quadrant | BADHDUFLAG | Total packets | Discarded packets |
| A | 0 | 13266 | 3 |
| B | 0 | 18101 | 2 |
| C | 0 | 12940 | 2 |
| D | 0 | 16084 | 2 |
| Mode SS | |||
|---|---|---|---|
| Quadrant | BADHDUFLAG | Total packets | Discarded packets |
| A | 0 | 126 | 0 |
| B | 0 | 126 | 0 |
| C | 0 | 126 | 0 |
| D | 0 | 126 | 0 |
| Quadrant | Total seconds | Saturated seconds | Saturation percentage |
|---|---|---|---|
| A | 6204 | 30 | 0.483559% |
| B | 6204 | 905 | 14.587363% |
| C | 6204 | 26 | 0.419084% |
| D | 6204 | 314 | 5.061251% |
Noise dominated data is calculated using 1-second bins in cleaned event files. If a bin has >2000 counts, and if more than 50% of those come from <1% of pixels, then it is considered to be noise-dominated and hence unusable.
| Quadrant | # 1 sec bins | Bins with >0 counts | Bins with >2000 counts | High rate bins dominated by noise | Noise dominated (total time) | Noise dominated (detector-on time) | Marked lightcurve |
|---|---|---|---|---|---|---|---|
| A | 7520 | 6206 | 3 | 3 | 0.04% | 0.05% |  |
| B | 7520 | 6206 | 473 | 473 | 6.29% | 7.62% |  |
| C | 7520 | 6206 | 3 | 3 | 0.04% | 0.05% | 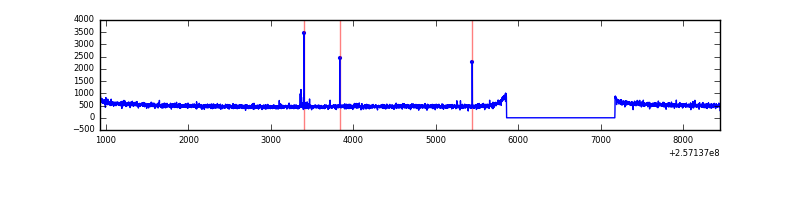 |
| D | 7520 | 6206 | 213 | 213 | 2.83% | 3.43% | 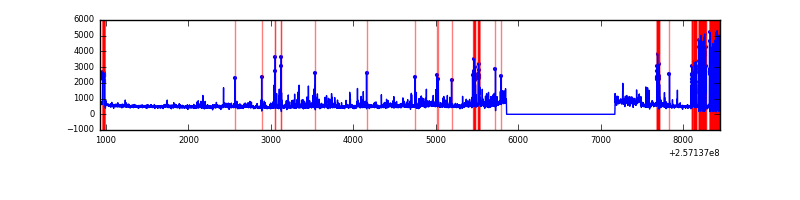 |
Top three noisy pixels from each quadrant. If the there are fewer than three noisy pixels in the level2.evt file, extra rows are filled as -1
| Pixel properties | Quadrant properties | ||||||
|---|---|---|---|---|---|---|---|
| Quadrant | DetID | PixID | Counts | Sigma | Mean | Median | Sigma |
| A | 12 | 189 | 69879 | 440.98 | 780 | 767 | 156.7 |
| A | 1 | 162 | 38197 | 238.83 | 780 | 767 | 156.7 |
| A | 15 | 223 | 35218 | 219.82 | 780 | 767 | 156.7 |
| B | 4 | 239 | 1768333 | 13575.84 | 712 | 693 | 130.2 |
| B | 3 | 64 | 143834 | 1099.35 | 712 | 693 | 130.2 |
| B | 0 | 230 | 24684 | 184.26 | 712 | 693 | 130.2 |
| C | 14 | 234 | 18569 | 99.18 | 785 | 789 | 179.3 |
| C | 13 | 61 | 5764 | 27.75 | 785 | 789 | 179.3 |
| C | 8 | 222 | 5096 | 24.02 | 785 | 789 | 179.3 |
| D | 1 | 52 | 920330 | 5214.19 | 751 | 733 | 176.4 |
| D | 8 | 195 | 287830 | 1627.86 | 751 | 733 | 176.4 |
| D | 14 | 34 | 22590 | 123.93 | 751 | 733 | 176.4 |
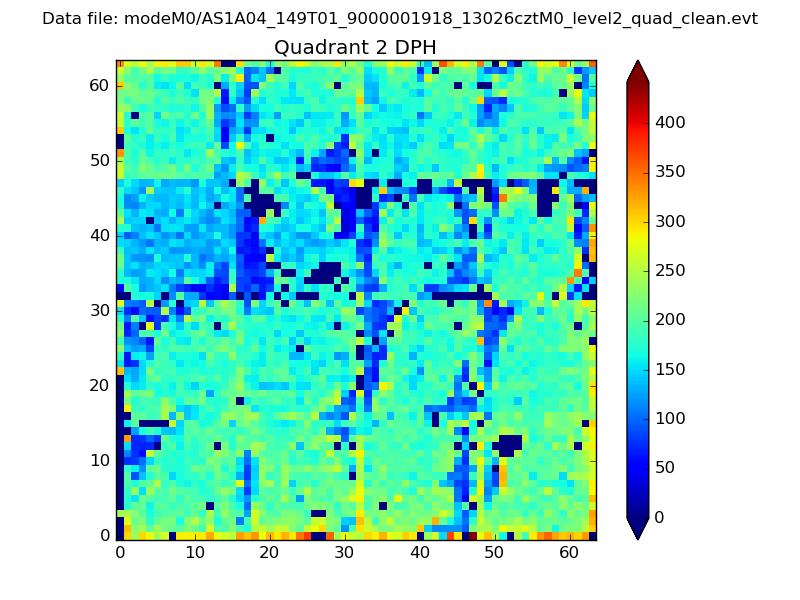
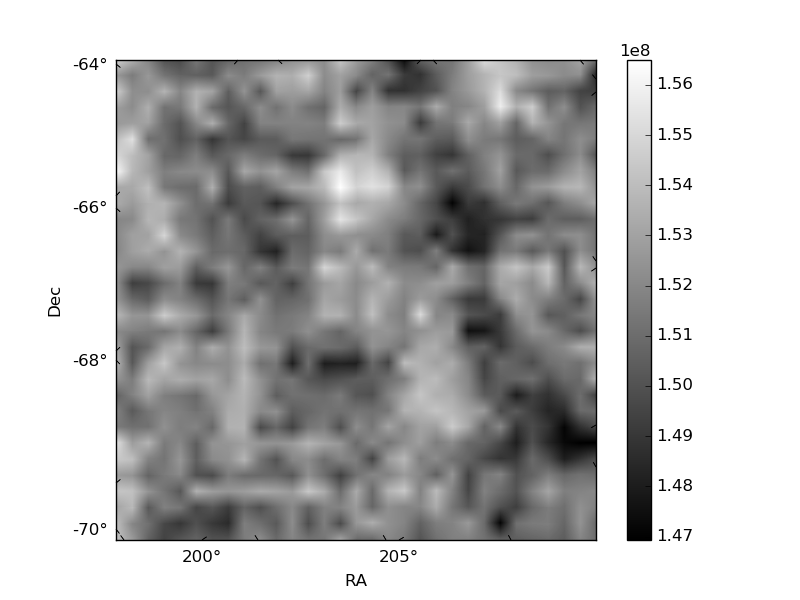
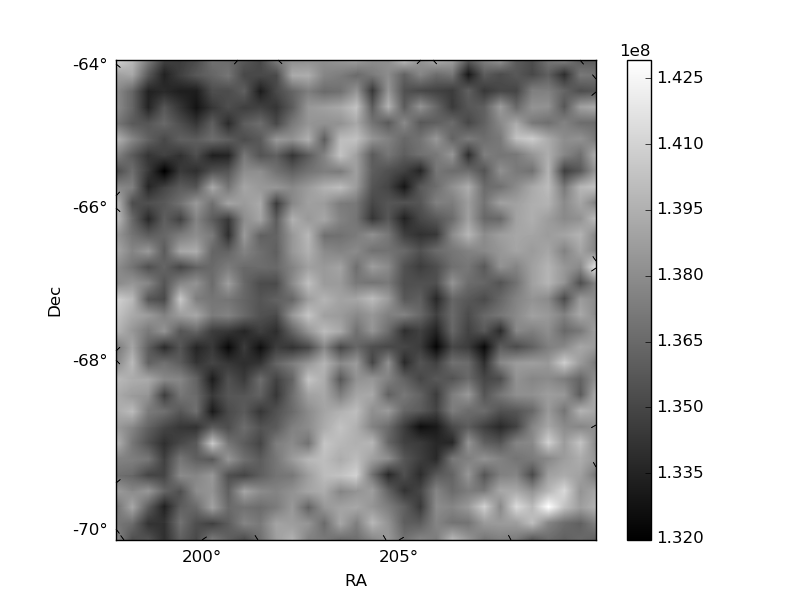
Histogram calculated using DETX and DETY for each event in the final _common_clean file
| Quadrant A | 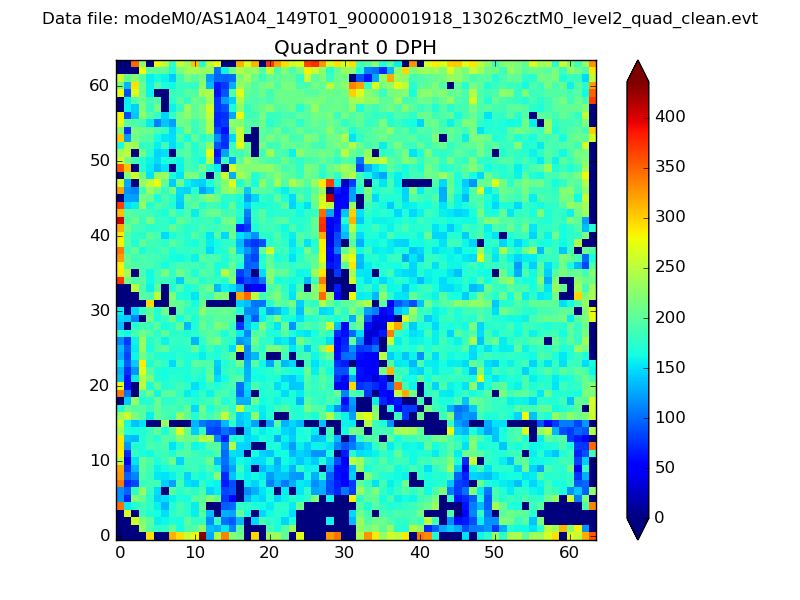 |
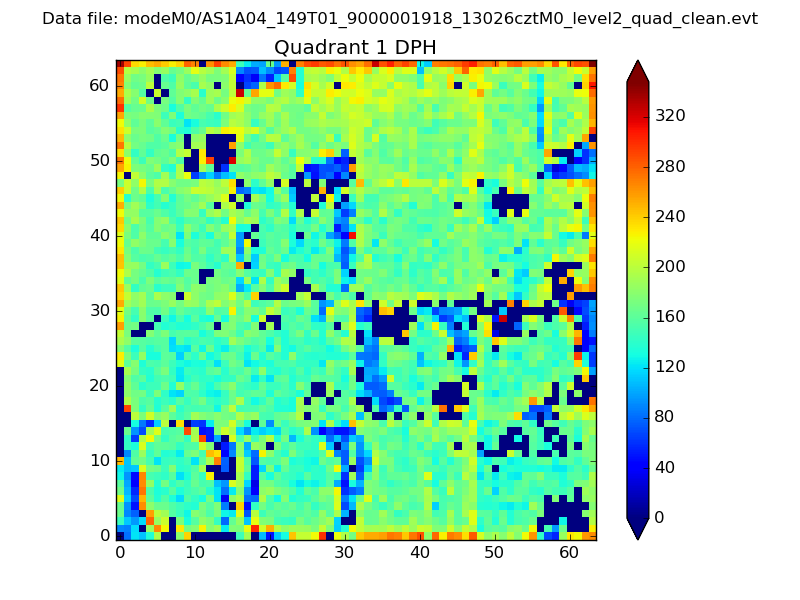 |
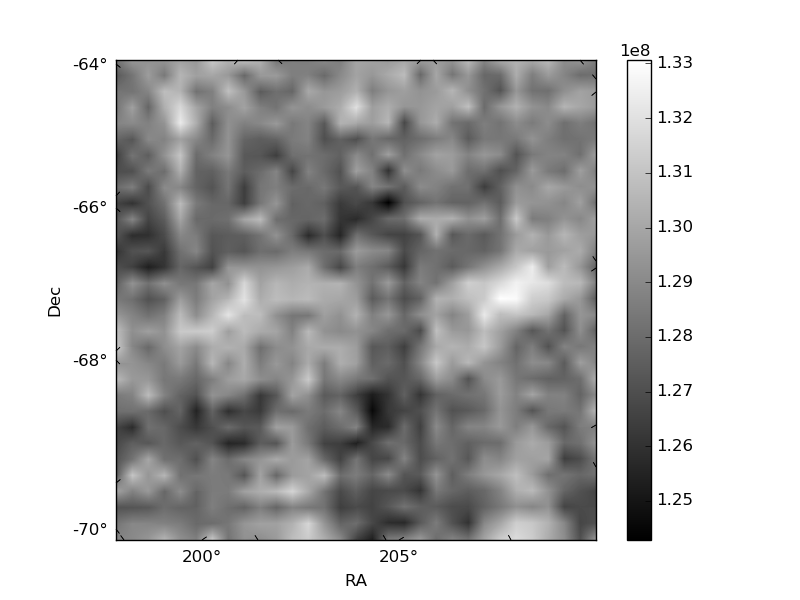
Quadrant B |
|---|---|---|---|
| Quadrant D | 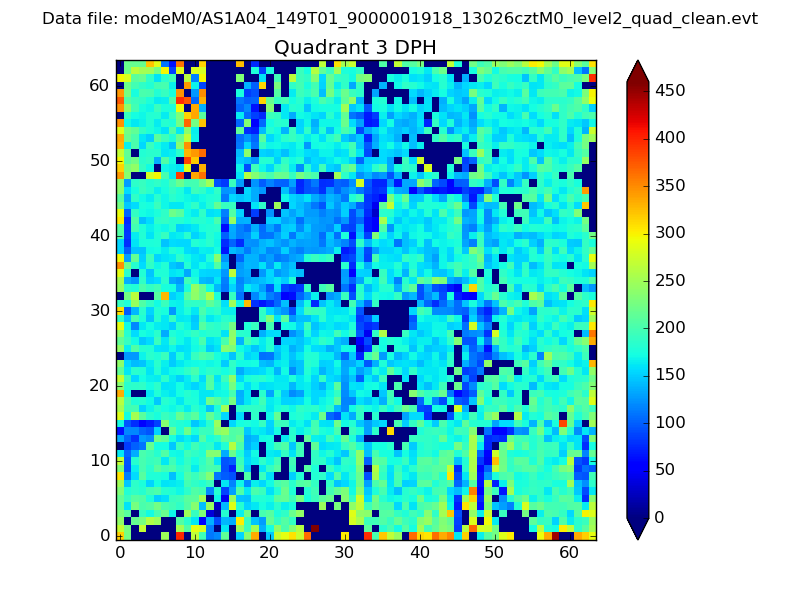 |
 |
Quadrant C |
| Plot type | Count rate plots | Images |
|---|---|---|
| Comparison with Poisson distribution Blue bars denote a histogram of data divided into 1 sec bins. Red curve is a Poisson curve with rate = median count rate of data. |
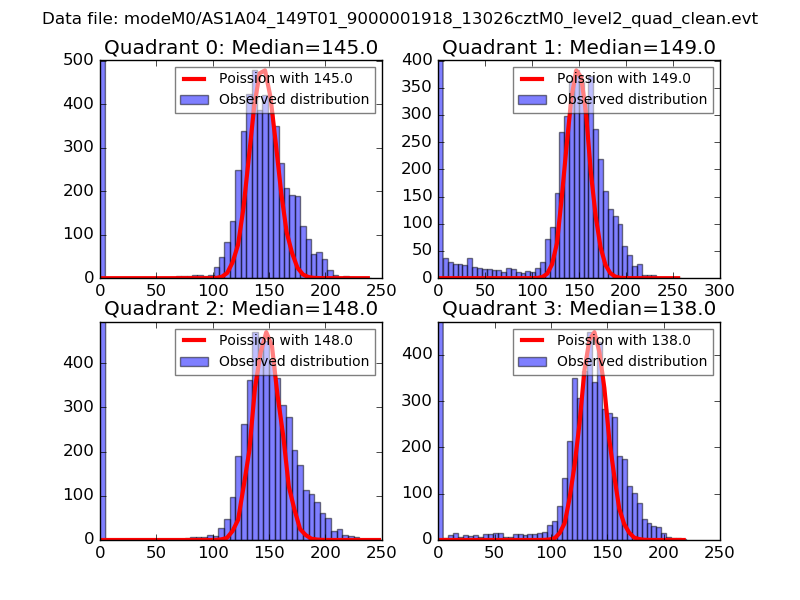 |
 |
| Quadrant-wise count rates Data is divided into 100 sec bins |
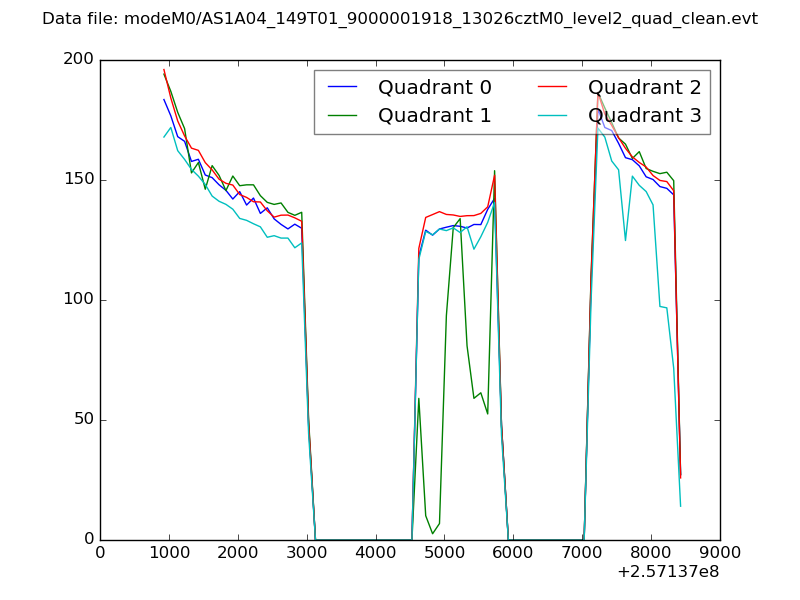 |
|
| Module-wise count rates for Quadrant A Data is divided into 100 sec bins |
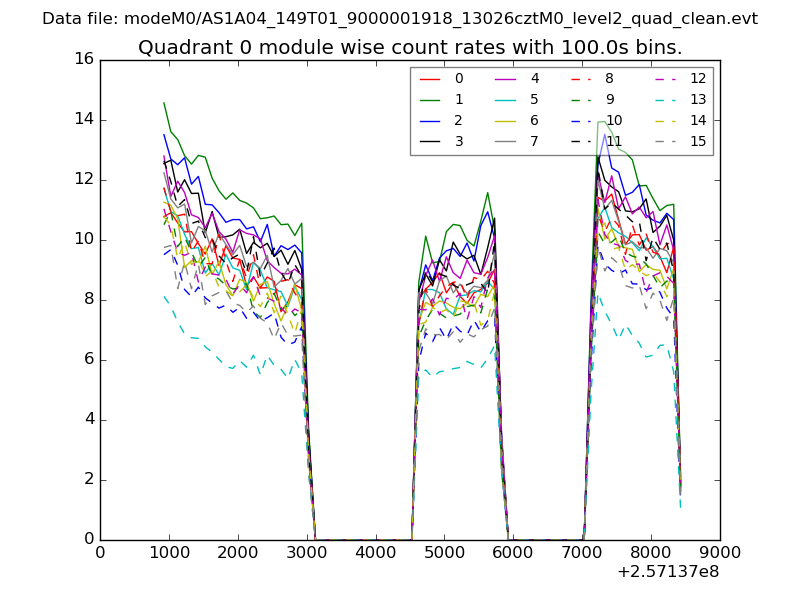 |
 |
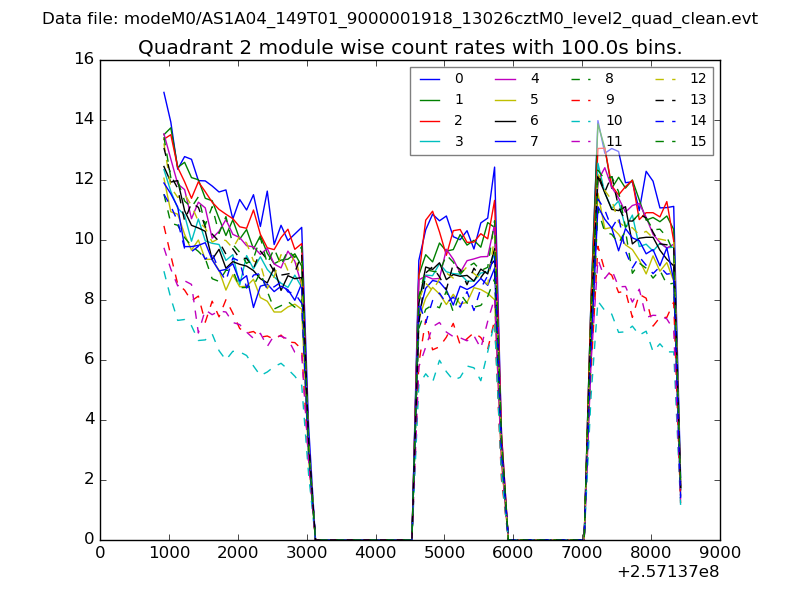
| Module-wise count rates for Quadrant B Data is divided into 100 sec bins |
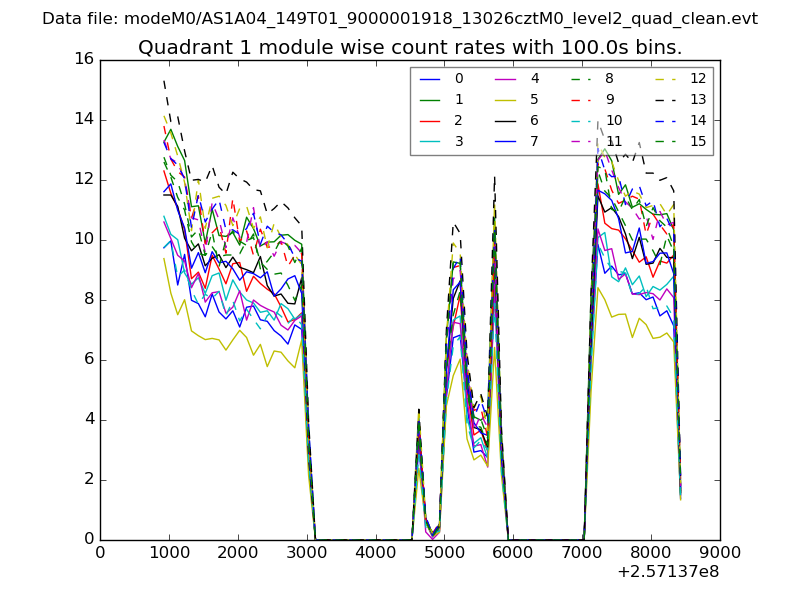 |
 |
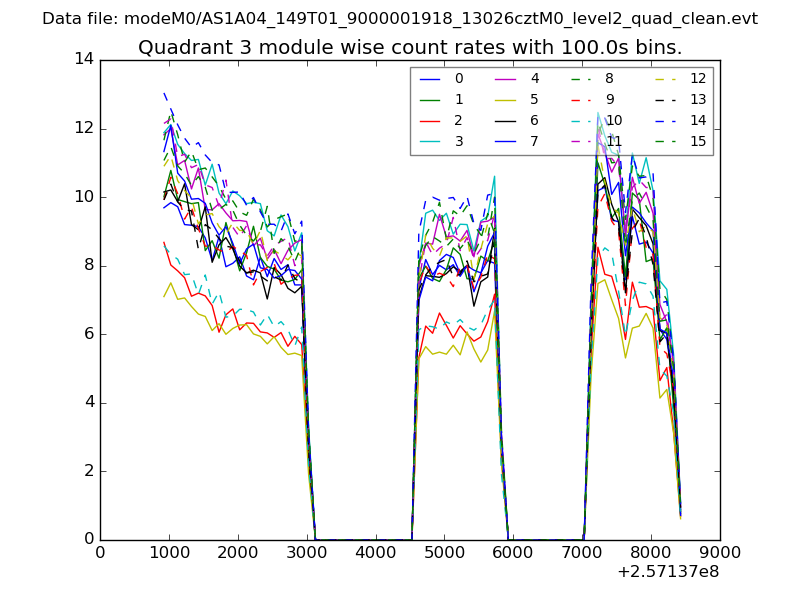
| Module-wise count rates for Quadrant C Data is divided into 100 sec bins |
 |
 |
| Module-wise count rates for Quadrant D Data is divided into 100 sec bins |
 |
 |
| Parameter | Plot |
|---|---|
| CZT HV Monitor | 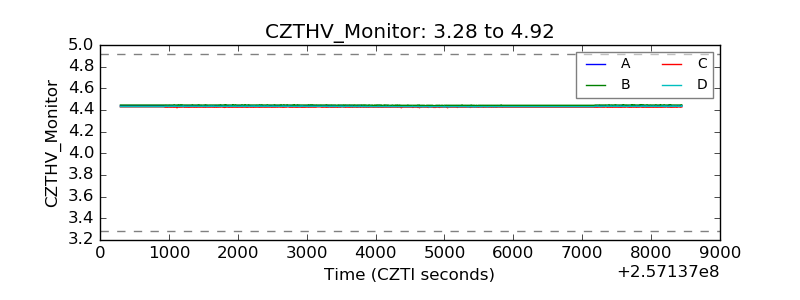 |
| D_VDD | 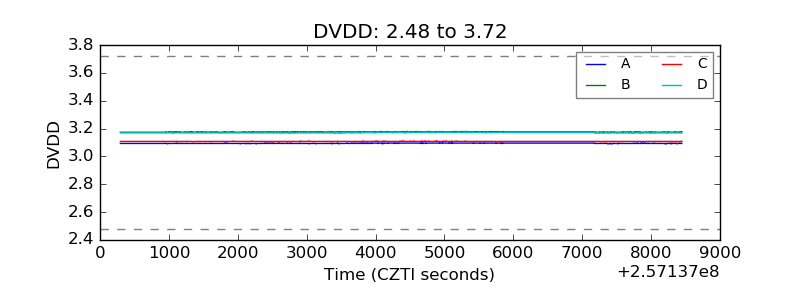 |
| Temperature 1 | 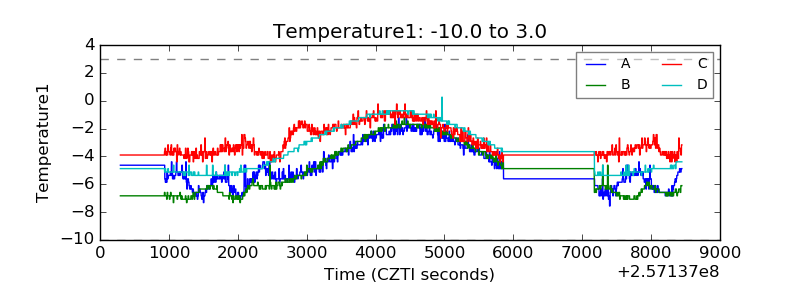 |
| Veto HV Monitor | 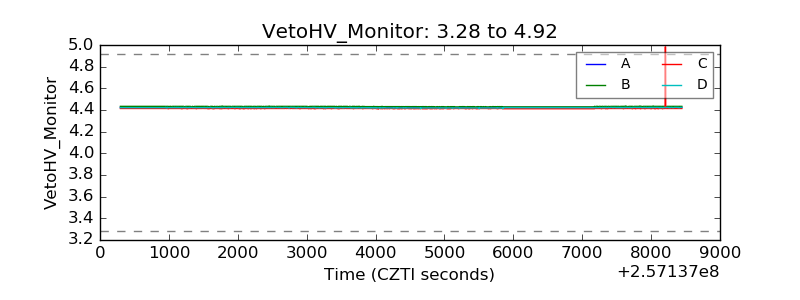 |
| Veto LLD | 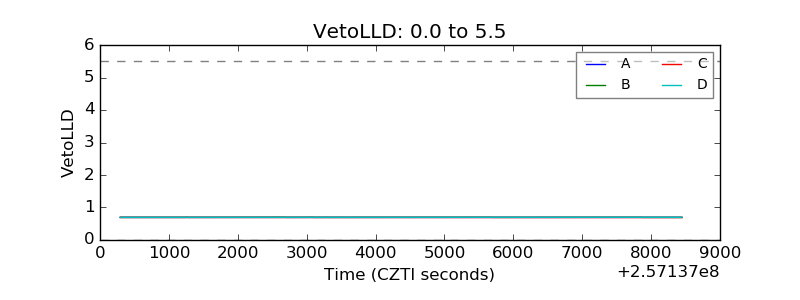 |
| Alpha Counter | 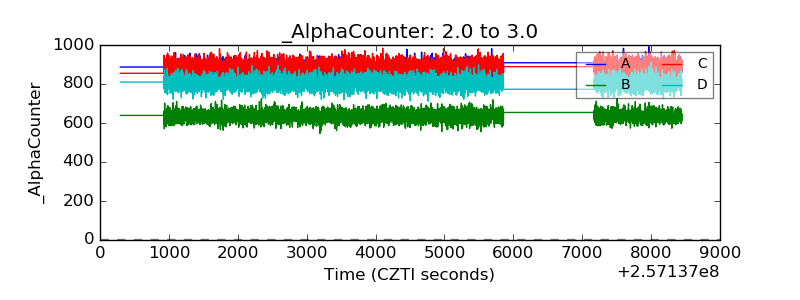 |
| _CPM_Rate | 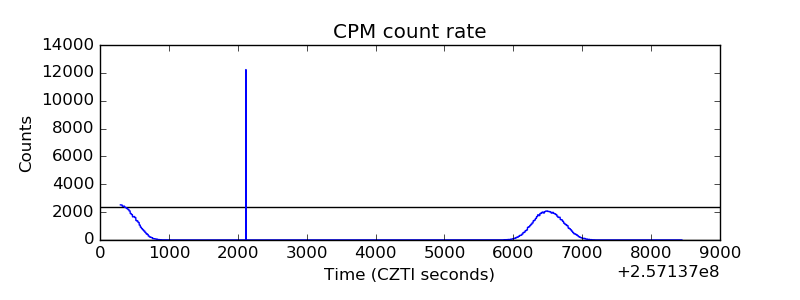 |
| CZT Counter | 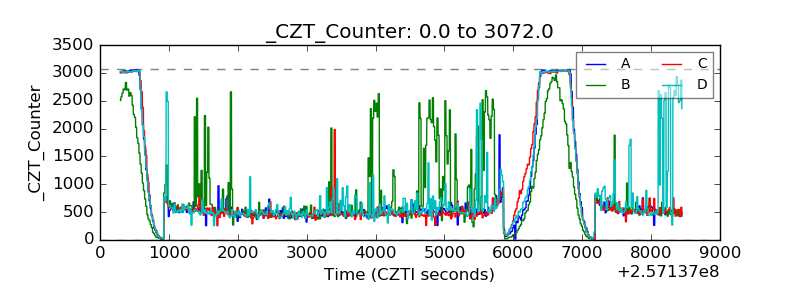 |
| +2.5 Volts monitor |  |
| +5 Volts monitor |  |
| _ROLL_ROT | 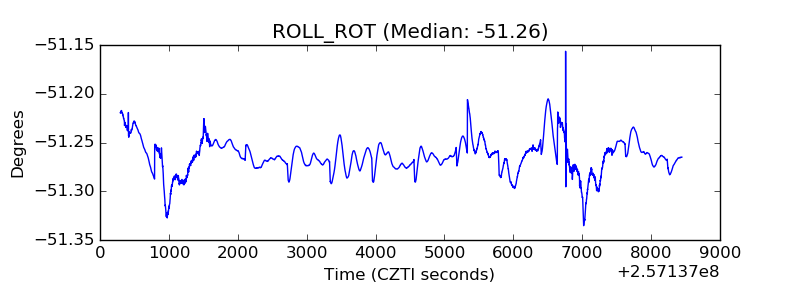 |
| _Roll_DEC | 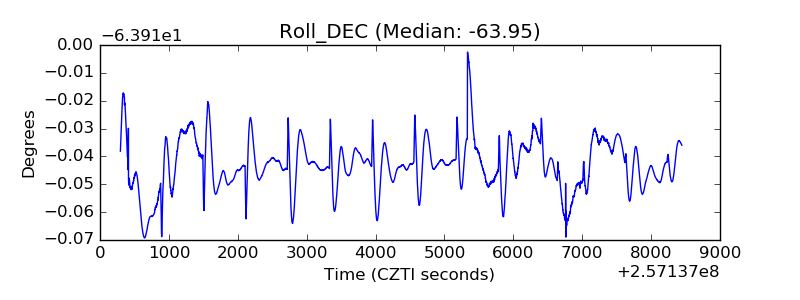 |
| _Roll_RA | 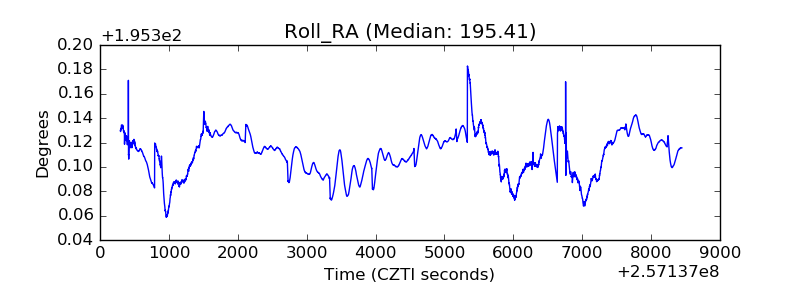 |
| Veto Counter | 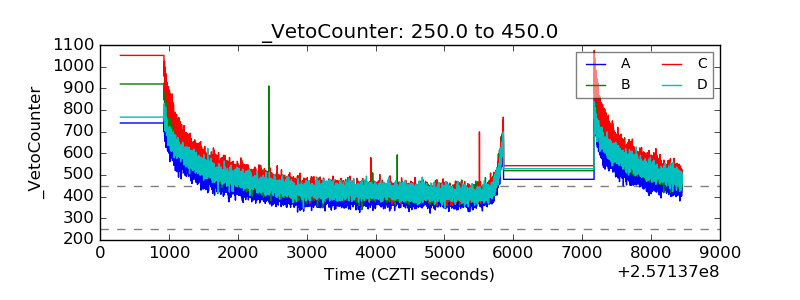 |