| Param | Original file | Final file |
|---|---|---|
| Filename | modeM0/AS1A04_149T01_9000001918_13036cztM0_level2.evt | modeM0/AS1A04_149T01_9000001918_13036cztM0_level2_quad_clean.evt |
| Size (bytes) | 556,076,160 | 93,124,800 |
| Size | 530.3 MB | 88.8 MB |
| Events in quadrant A | 3,424,404 | 636,073 |
| Events in quadrant B | 6,225,516 | 479,546 |
| Events in quadrant C | 2,989,704 | 633,483 |
| Events in quadrant D | 3,740,733 | 598,273 |
| Mode M9 | |||
|---|---|---|---|
| Quadrant | BADHDUFLAG | Total packets | Discarded packets |
| A | 0 | 19 | 0 |
| B | 0 | 19 | 0 |
| C | 0 | 19 | 0 |
| D | 0 | 19 | 0 |
| Mode M0 | |||
|---|---|---|---|
| Quadrant | BADHDUFLAG | Total packets | Discarded packets |
| A | 0 | 14644 | 3 |
| B | 0 | 23287 | 2 |
| C | 0 | 13716 | 2 |
| D | 0 | 15904 | 2 |
| Mode SS | |||
|---|---|---|---|
| Quadrant | BADHDUFLAG | Total packets | Discarded packets |
| A | 0 | 138 | 0 |
| B | 0 | 138 | 0 |
| C | 0 | 138 | 0 |
| D | 0 | 138 | 0 |
| Quadrant | Total seconds | Saturated seconds | Saturation percentage |
|---|---|---|---|
| A | 6779 | 41 | 0.604809% |
| B | 6779 | 2023 | 29.842160% |
| C | 6779 | 16 | 0.236023% |
| D | 6779 | 59 | 0.870335% |
Noise dominated data is calculated using 1-second bins in cleaned event files. If a bin has >2000 counts, and if more than 50% of those come from <1% of pixels, then it is considered to be noise-dominated and hence unusable.
| Quadrant | # 1 sec bins | Bins with >0 counts | Bins with >2000 counts | High rate bins dominated by noise | Noise dominated (total time) | Noise dominated (detector-on time) | Marked lightcurve |
|---|---|---|---|---|---|---|---|
| A | 8555 | 6782 | 5 | 5 | 0.06% | 0.07% | 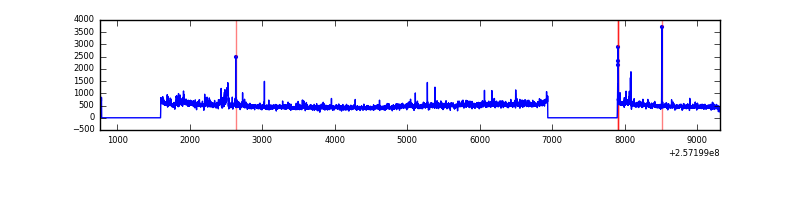 |
| B | 8555 | 6781 | 976 | 976 | 11.41% | 14.39% | 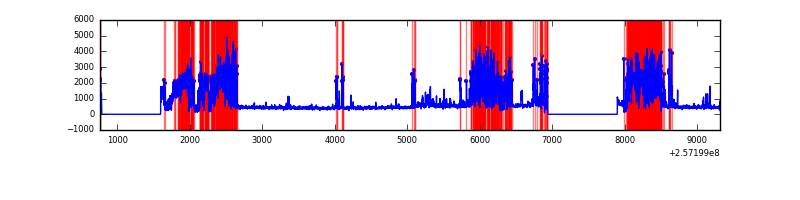 |
| C | 8555 | 6782 | 0 | 0 | 0.00% | 0.00% |  |
| D | 8555 | 6782 | 42 | 42 | 0.49% | 0.62% | 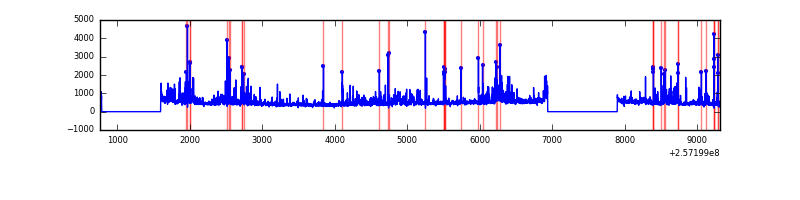 |
Top three noisy pixels from each quadrant. If the there are fewer than three noisy pixels in the level2.evt file, extra rows are filled as -1
| Pixel properties | Quadrant properties | ||||||
|---|---|---|---|---|---|---|---|
| Quadrant | DetID | PixID | Counts | Sigma | Mean | Median | Sigma |
| A | 12 | 189 | 89528 | 556.88 | 784 | 768 | 159.4 |
| A | 8 | 15 | 88762 | 552.07 | 784 | 768 | 159.4 |
| A | 1 | 162 | 73445 | 455.97 | 784 | 768 | 159.4 |
| B | 4 | 239 | 3684065 | 32851.21 | 591 | 576 | 112.1 |
| B | 3 | 64 | 131218 | 1165.13 | 591 | 576 | 112.1 |
| B | 3 | 209 | 29726 | 259.97 | 591 | 576 | 112.1 |
| C | 13 | 61 | 5445 | 26.52 | 765 | 769 | 176.3 |
| C | 8 | 222 | 2930 | 12.25 | 765 | 769 | 176.3 |
| C | 14 | 234 | 2721 | 11.07 | 765 | 769 | 176.3 |
| D | 1 | 52 | 711224 | 3913.21 | 753 | 730 | 181.6 |
| D | 8 | 195 | 119739 | 655.47 | 753 | 730 | 181.6 |
| D | 2 | 234 | 25680 | 137.42 | 753 | 730 | 181.6 |
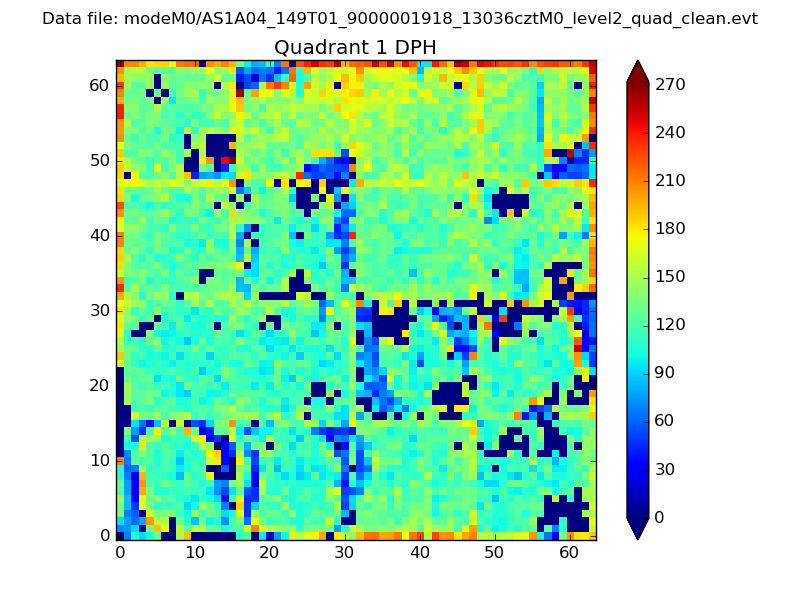
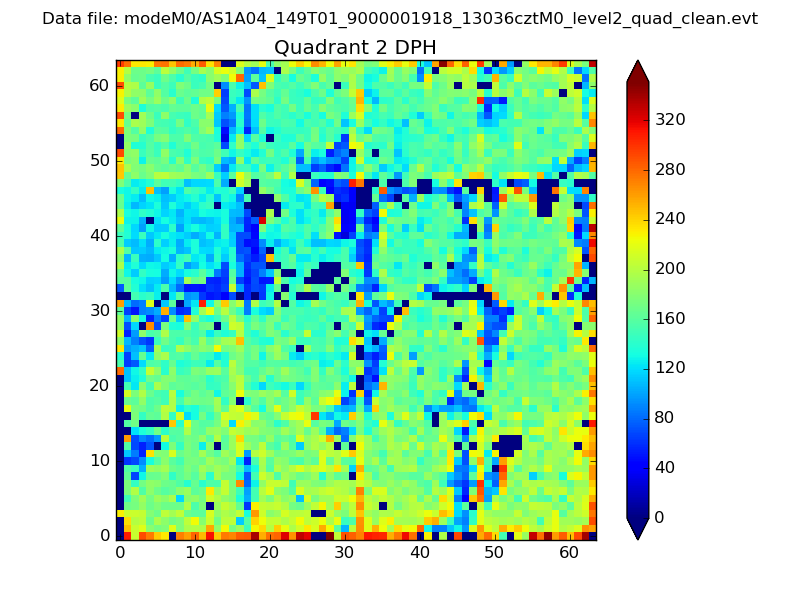
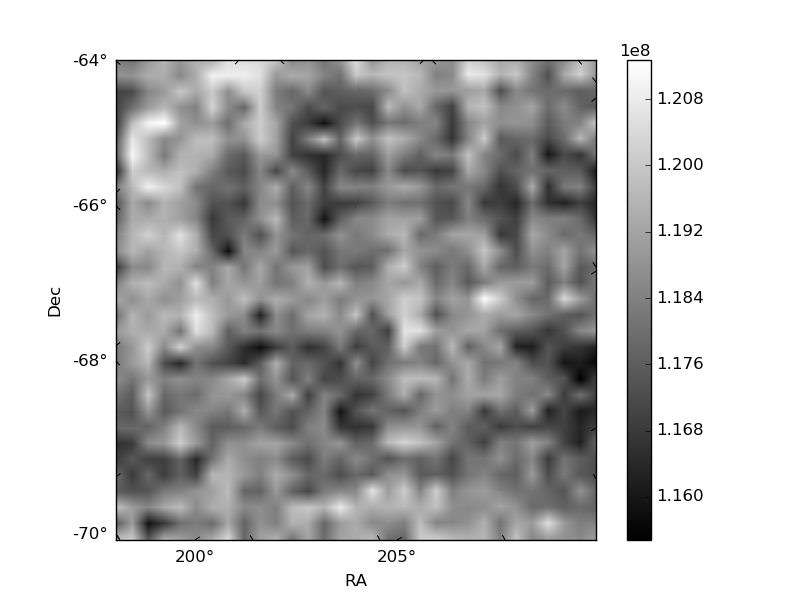
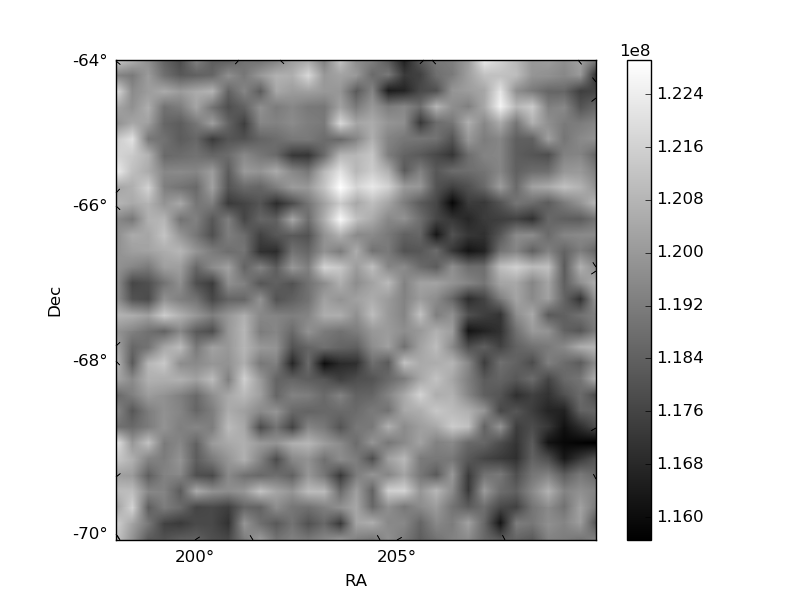
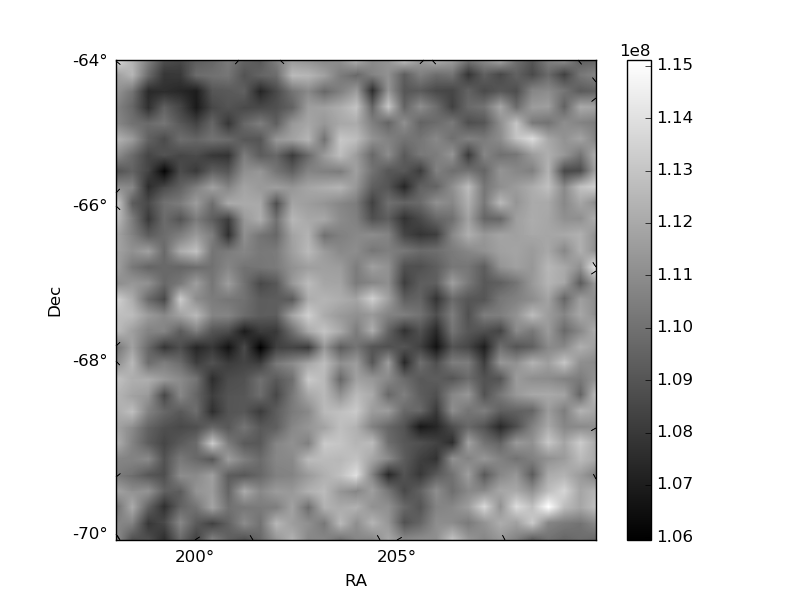
Histogram calculated using DETX and DETY for each event in the final _common_clean file
| Quadrant A | 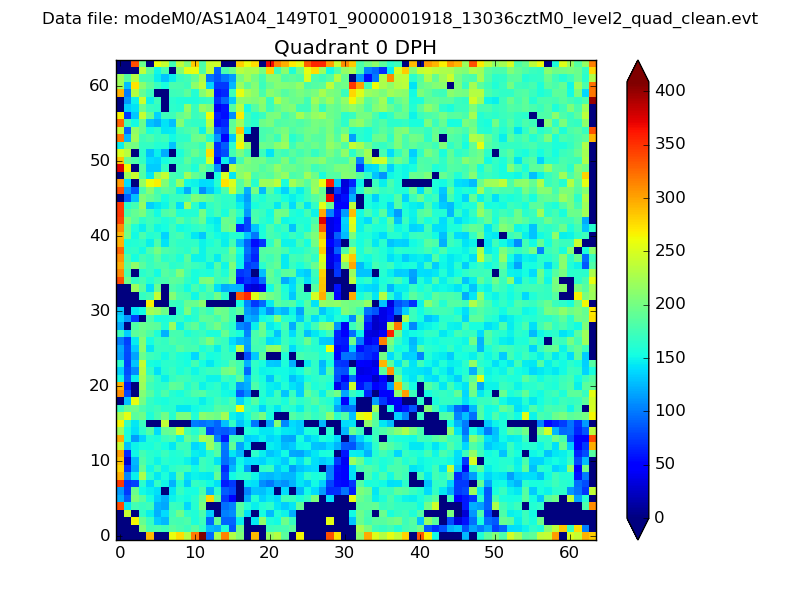 |
 |
Quadrant B |
|---|---|---|---|
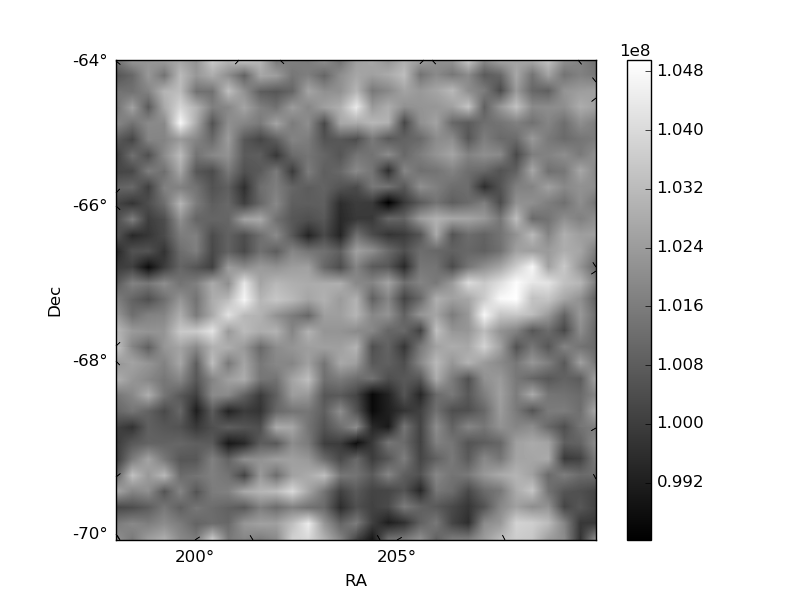
| Quadrant D | 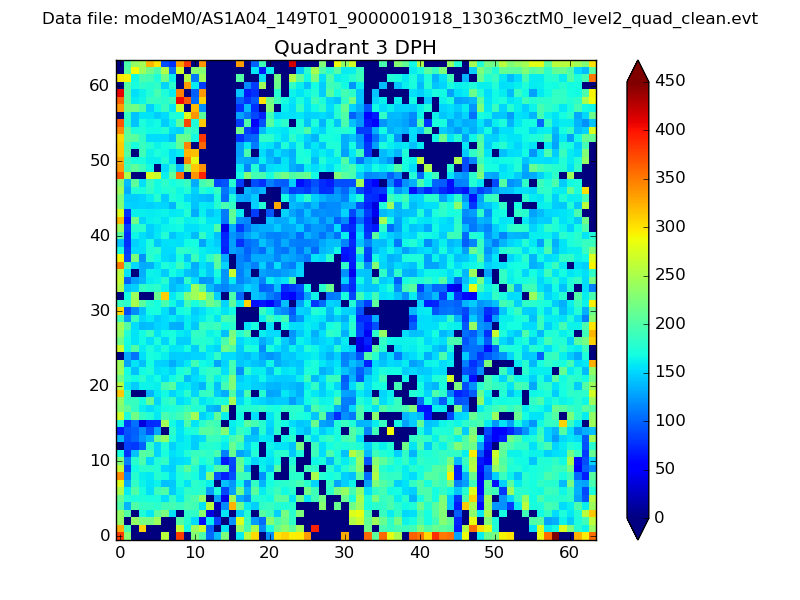 |
 |
Quadrant C |
| Plot type | Count rate plots | Images |
|---|---|---|
| Comparison with Poisson distribution Blue bars denote a histogram of data divided into 1 sec bins. Red curve is a Poisson curve with rate = median count rate of data. |
 |
 |
| Quadrant-wise count rates Data is divided into 100 sec bins |
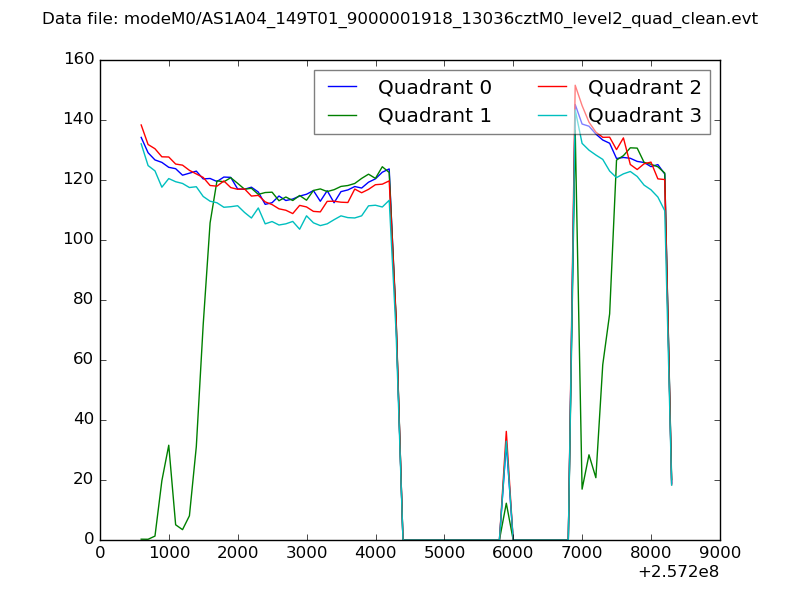 |
|
| Module-wise count rates for Quadrant A Data is divided into 100 sec bins |
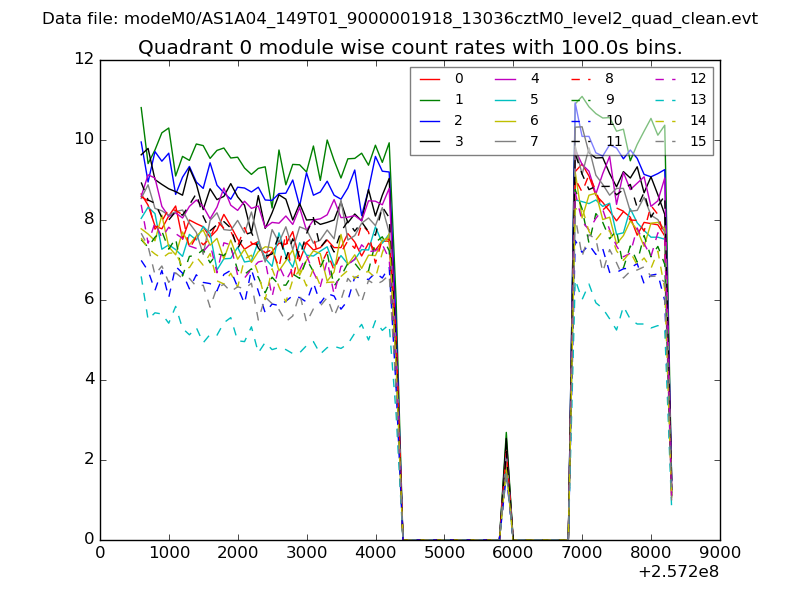 |
 |
| Module-wise count rates for Quadrant B Data is divided into 100 sec bins |
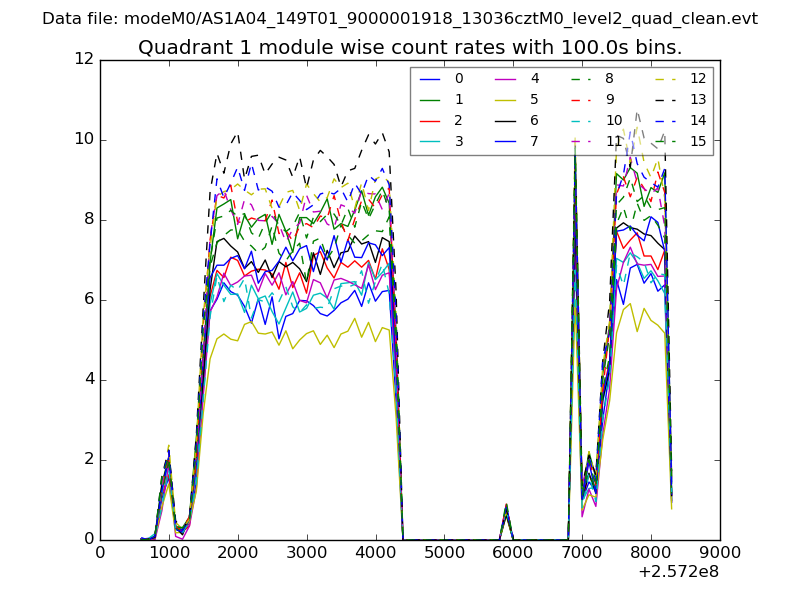 |
 |
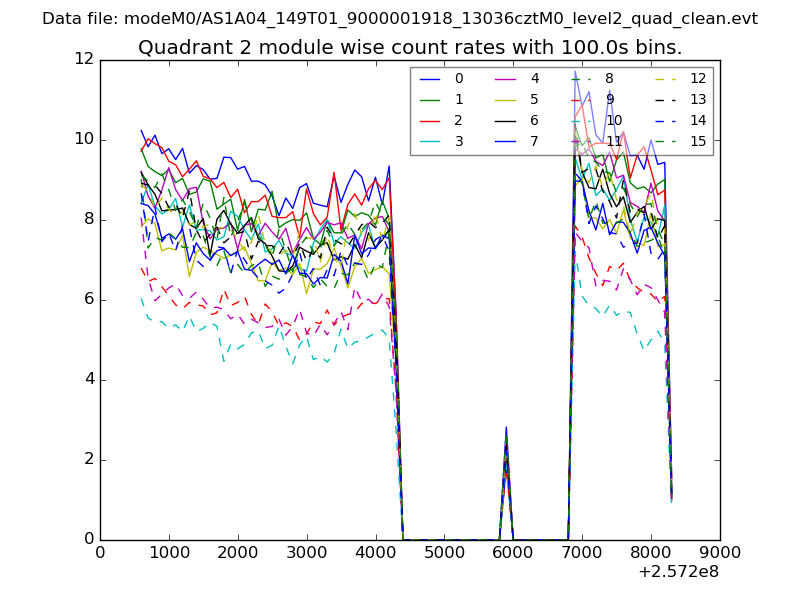
| Module-wise count rates for Quadrant C Data is divided into 100 sec bins |
 |
 |
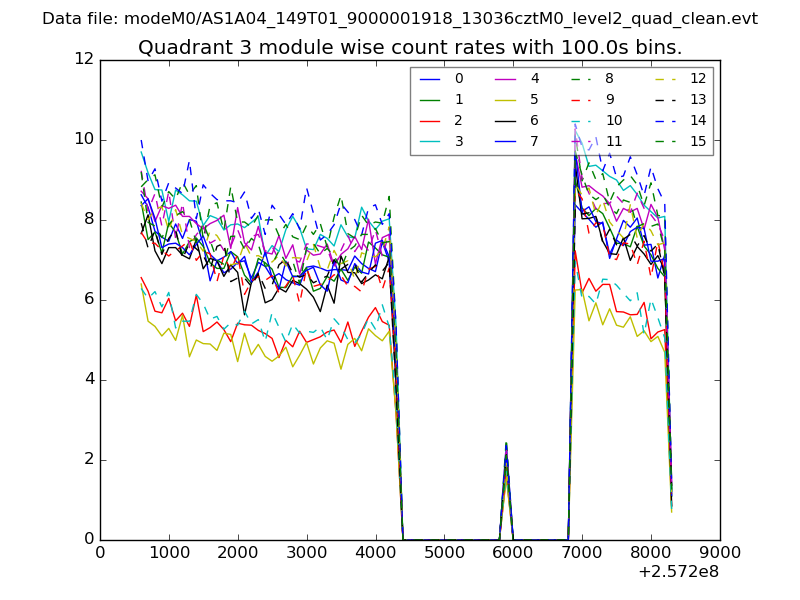
| Module-wise count rates for Quadrant D Data is divided into 100 sec bins |
 |
 |
| Parameter | Plot |
|---|---|
| CZT HV Monitor | 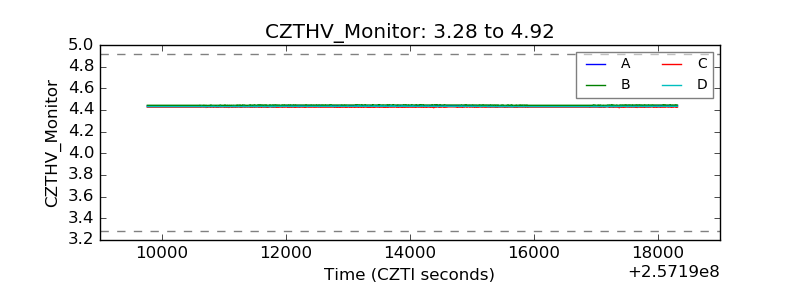 |
| D_VDD | 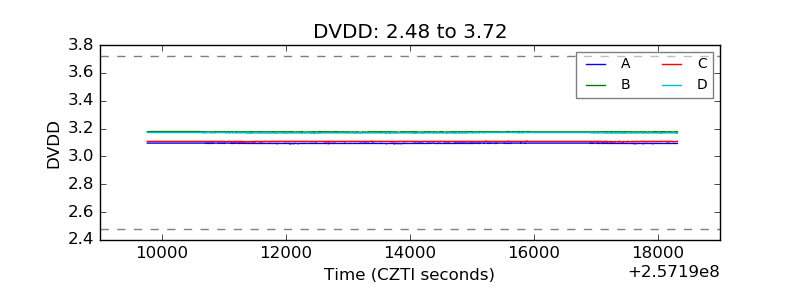 |
| Temperature 1 | 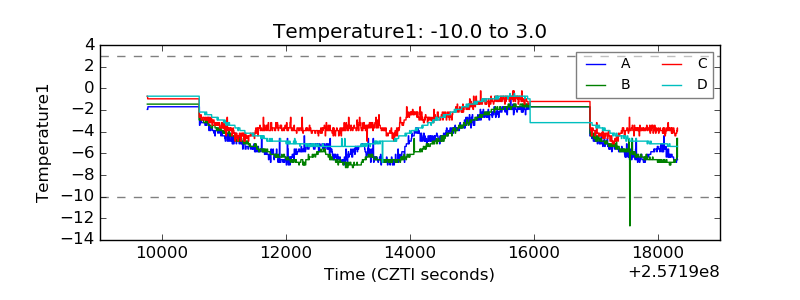 |
| Veto HV Monitor | 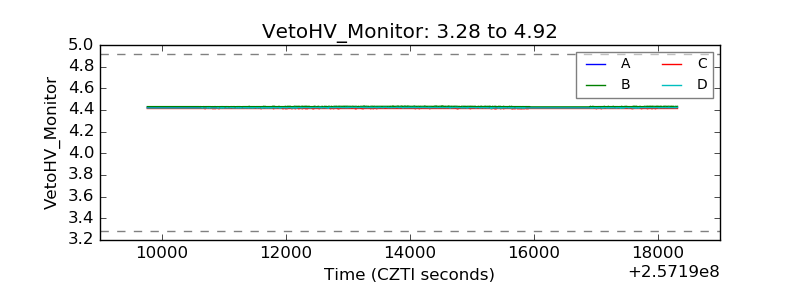 |
| Veto LLD | 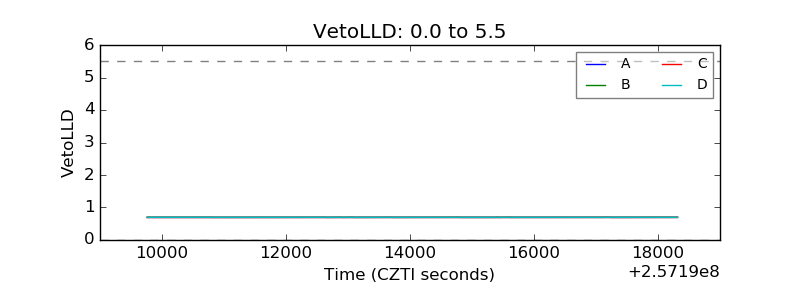 |
| Alpha Counter | 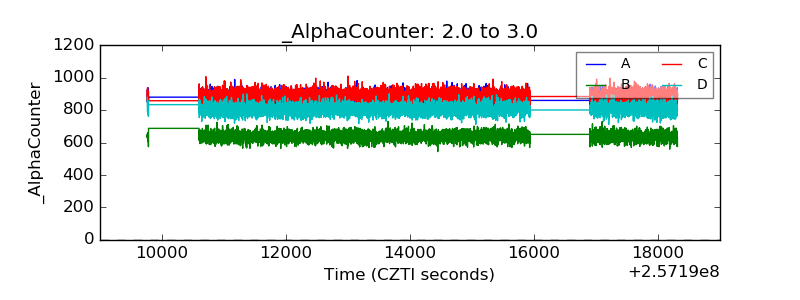 |
| _CPM_Rate | 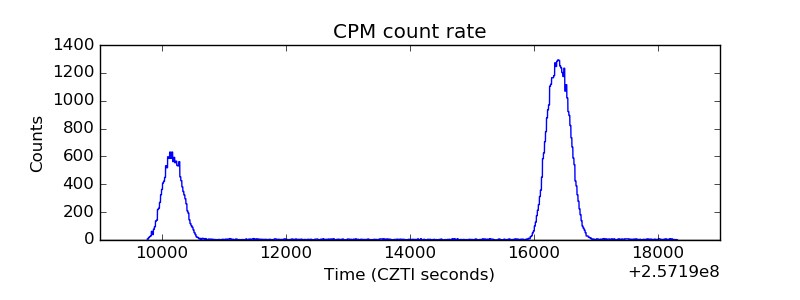 |
| CZT Counter | 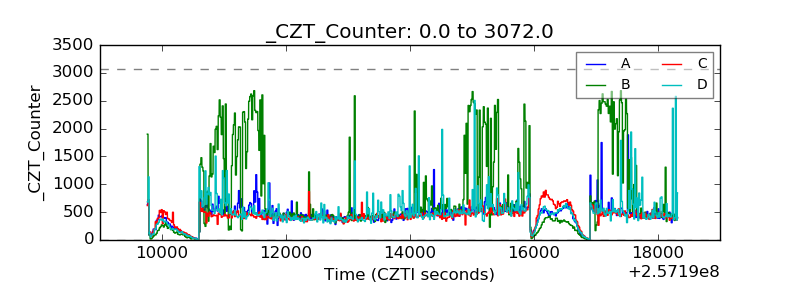 |
| +2.5 Volts monitor |  |
| +5 Volts monitor | 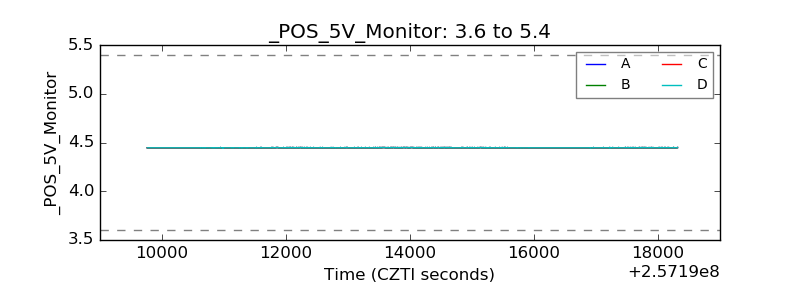 |
| _ROLL_ROT |  |
| _Roll_DEC | 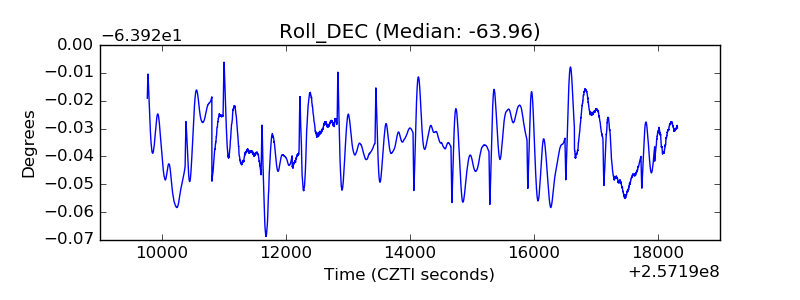 |
| _Roll_RA | 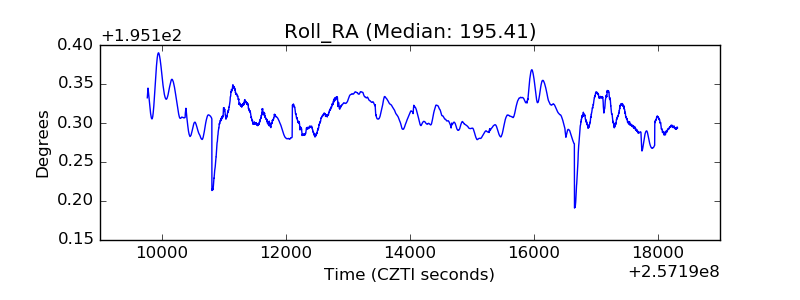 |
| Veto Counter | 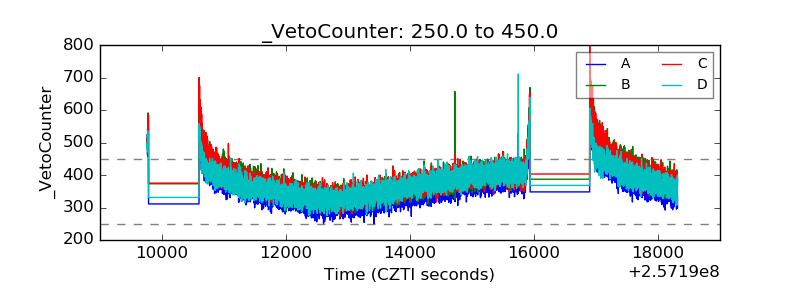 |