| Param | Original file | Final file |
|---|---|---|
| Filename | modeM0/AS1A04_149T01_9000001918_13043cztM0_level2.evt | modeM0/AS1A04_149T01_9000001918_13043cztM0_level2_quad_clean.evt |
| Size (bytes) | 506,669,760 | 93,124,800 |
| Size | 483.2 MB | 88.8 MB |
| Events in quadrant A | 3,254,338 | 614,541 |
| Events in quadrant B | 5,505,925 | 553,118 |
| Events in quadrant C | 3,037,610 | 616,892 |
| Events in quadrant D | 3,108,579 | 585,532 |
| Mode M9 | |||
|---|---|---|---|
| Quadrant | BADHDUFLAG | Total packets | Discarded packets |
| A | 0 | 11 | 0 |
| B | 0 | 11 | 0 |
| C | 0 | 11 | 0 |
| D | 0 | 12 | 0 |
| Mode M0 | |||
|---|---|---|---|
| Quadrant | BADHDUFLAG | Total packets | Discarded packets |
| A | 0 | 13652 | 3 |
| B | 0 | 20451 | 2 |
| C | 0 | 13261 | 2 |
| D | 0 | 13547 | 2 |
| Mode SS | |||
|---|---|---|---|
| Quadrant | BADHDUFLAG | Total packets | Discarded packets |
| A | 0 | 130 | 0 |
| B | 0 | 130 | 0 |
| C | 0 | 130 | 0 |
| D | 0 | 130 | 0 |
| Quadrant | Total seconds | Saturated seconds | Saturation percentage |
|---|---|---|---|
| A | 6449 | 128 | 1.984804% |
| B | 6449 | 1134 | 17.584122% |
| C | 6449 | 104 | 1.612653% |
| D | 6449 | 100 | 1.550628% |
Noise dominated data is calculated using 1-second bins in cleaned event files. If a bin has >2000 counts, and if more than 50% of those come from <1% of pixels, then it is considered to be noise-dominated and hence unusable.
| Quadrant | # 1 sec bins | Bins with >0 counts | Bins with >2000 counts | High rate bins dominated by noise | Noise dominated (total time) | Noise dominated (detector-on time) | Marked lightcurve |
|---|---|---|---|---|---|---|---|
| A | 7485 | 6451 | 0 | 0 | 0.00% | 0.00% | 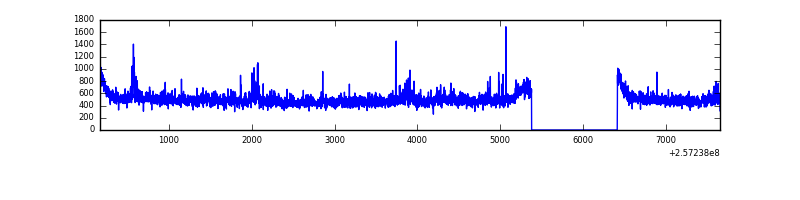 |
| B | 7485 | 6451 | 682 | 682 | 9.11% | 10.57% | 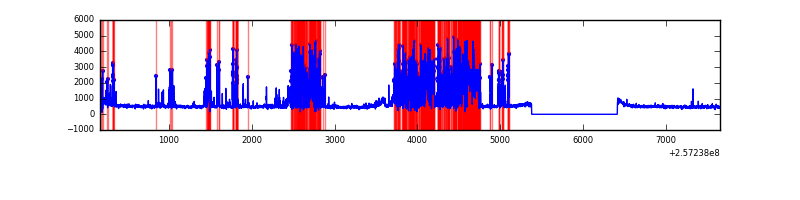 |
| C | 7485 | 6451 | 0 | 0 | 0.00% | 0.00% | 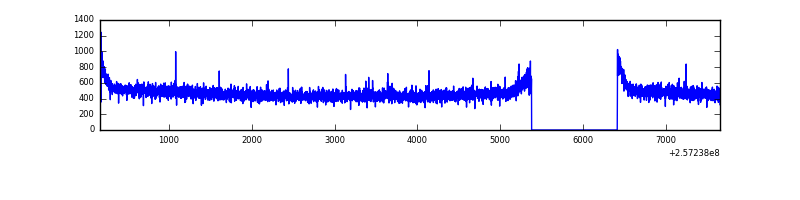 |
| D | 7485 | 6451 | 4 | 4 | 0.05% | 0.06% | 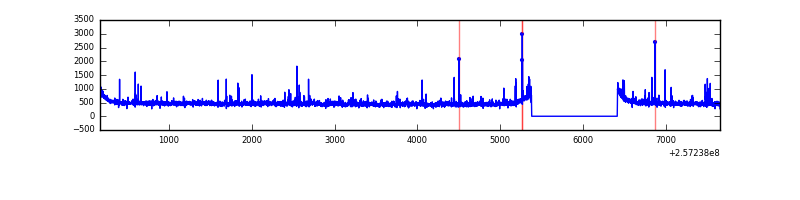 |
Top three noisy pixels from each quadrant. If the there are fewer than three noisy pixels in the level2.evt file, extra rows are filled as -1
| Pixel properties | Quadrant properties | ||||||
|---|---|---|---|---|---|---|---|
| Quadrant | DetID | PixID | Counts | Sigma | Mean | Median | Sigma |
| A | 12 | 189 | 87722 | 547.24 | 784 | 768 | 158.9 |
| A | 8 | 15 | 62808 | 390.45 | 784 | 768 | 158.9 |
| A | 1 | 162 | 46079 | 285.16 | 784 | 768 | 158.9 |
| B | 4 | 239 | 2546418 | 19312.52 | 710 | 692 | 131.8 |
| B | 0 | 219 | 114798 | 865.64 | 710 | 692 | 131.8 |
| B | 3 | 209 | 32806 | 243.62 | 710 | 692 | 131.8 |
| C | 13 | 61 | 5556 | 26.81 | 777 | 783 | 178.0 |
| C | 14 | 234 | 4215 | 19.28 | 777 | 783 | 178.0 |
| C | 12 | 4 | 3936 | 17.71 | 777 | 783 | 178.0 |
| D | 1 | 52 | 92945 | 503.88 | 768 | 747 | 183.0 |
| D | 8 | 195 | 75612 | 409.15 | 768 | 747 | 183.0 |
| D | 10 | 157 | 24070 | 127.46 | 768 | 747 | 183.0 |
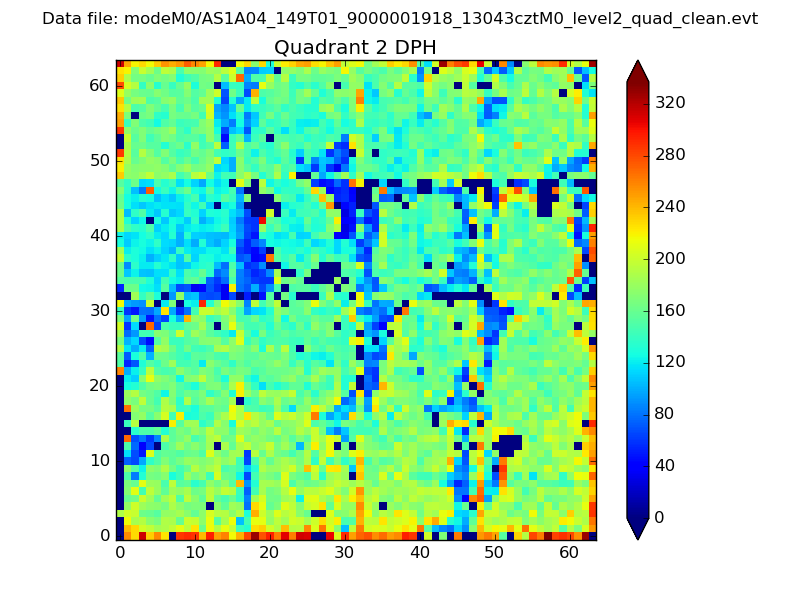
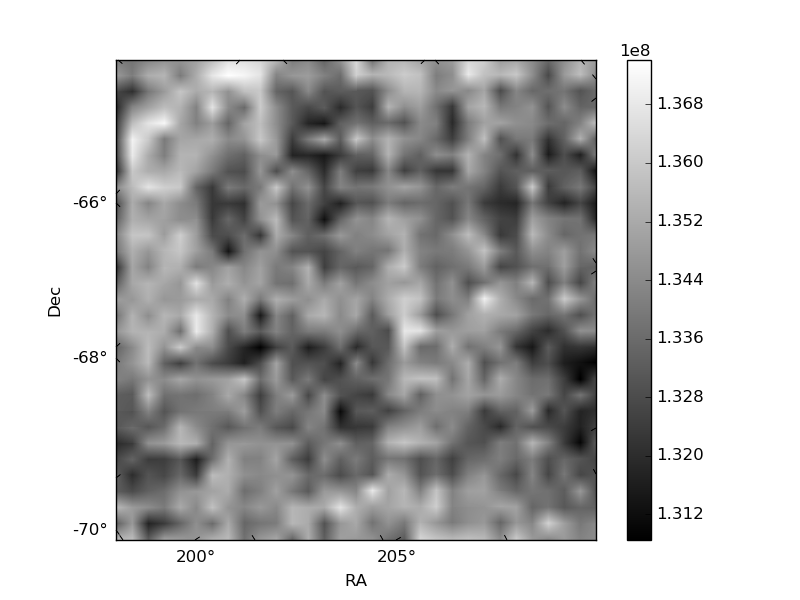
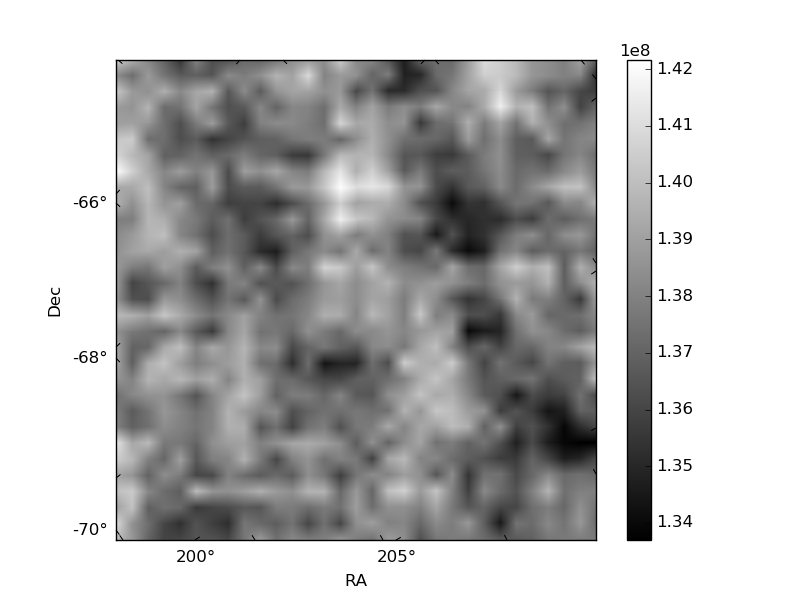
Histogram calculated using DETX and DETY for each event in the final _common_clean file
| Quadrant A | 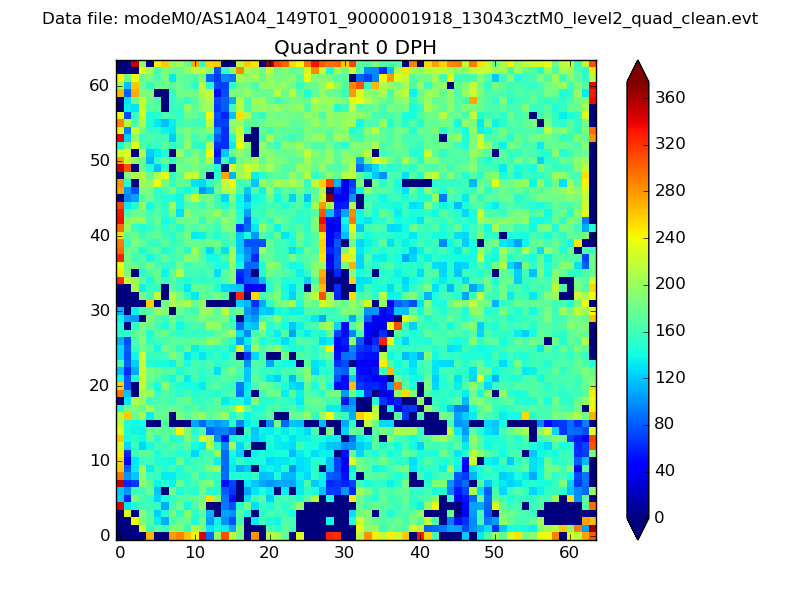 |
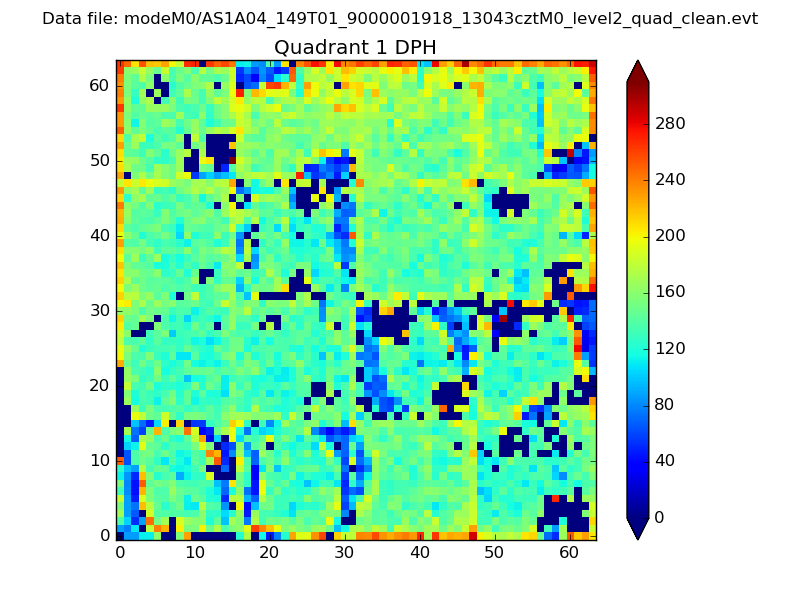 |
Quadrant B |
|---|---|---|---|
| Quadrant D | 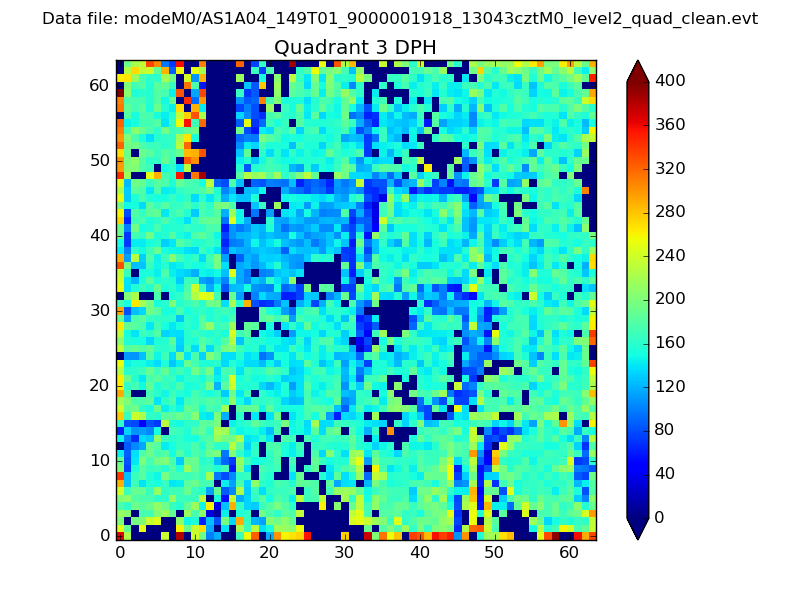 |
 |
Quadrant C |
| Plot type | Count rate plots | Images |
|---|---|---|
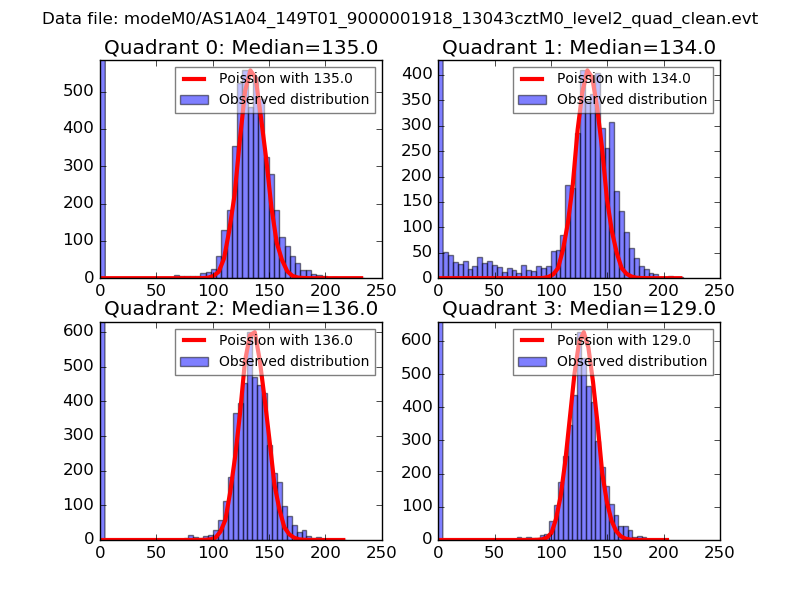
| Comparison with Poisson distribution Blue bars denote a histogram of data divided into 1 sec bins. Red curve is a Poisson curve with rate = median count rate of data. |
 |
 |
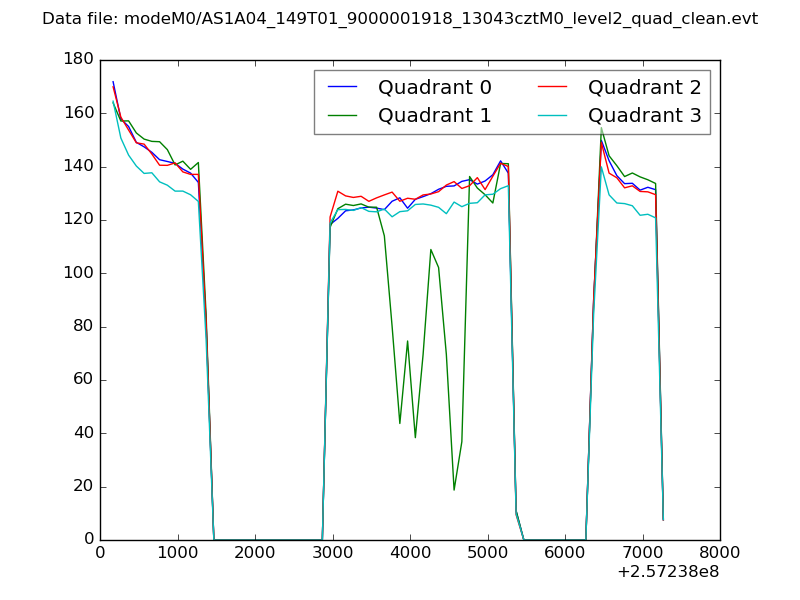
| Quadrant-wise count rates Data is divided into 100 sec bins |
 |
|
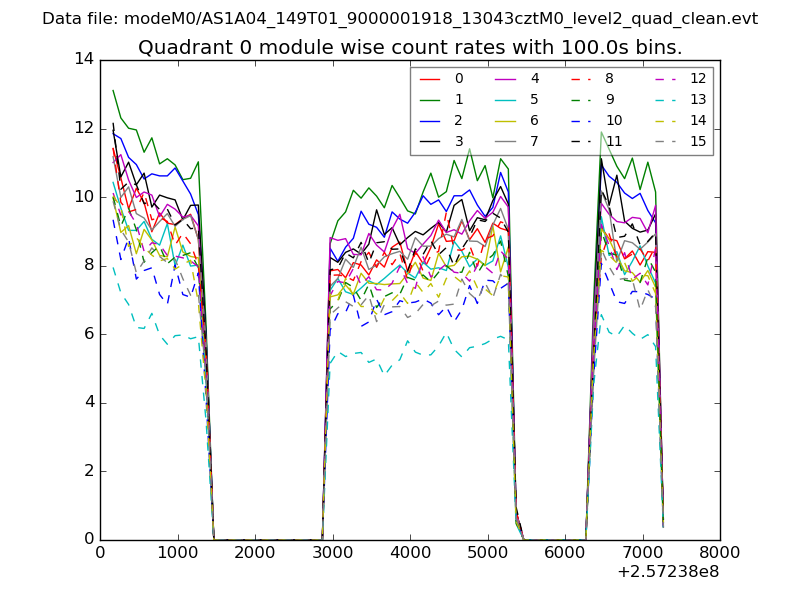
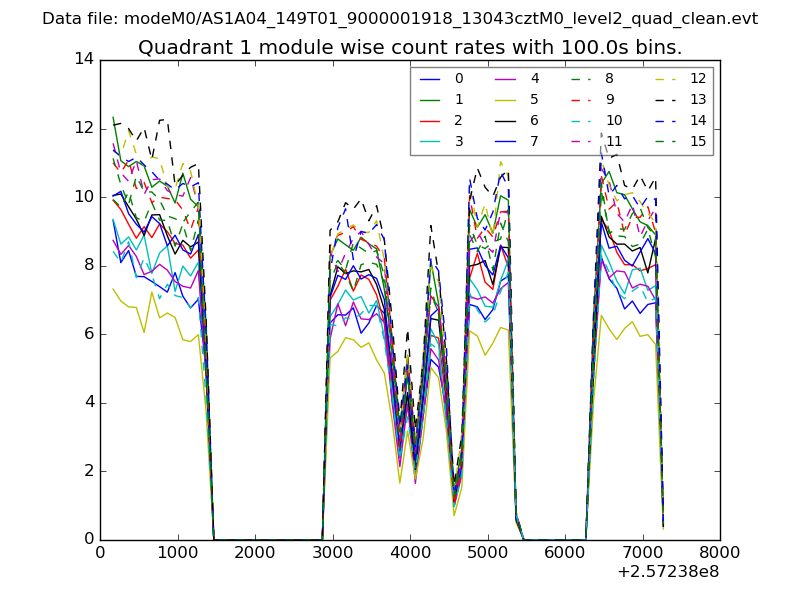
| Module-wise count rates for Quadrant A Data is divided into 100 sec bins |
 |
 |
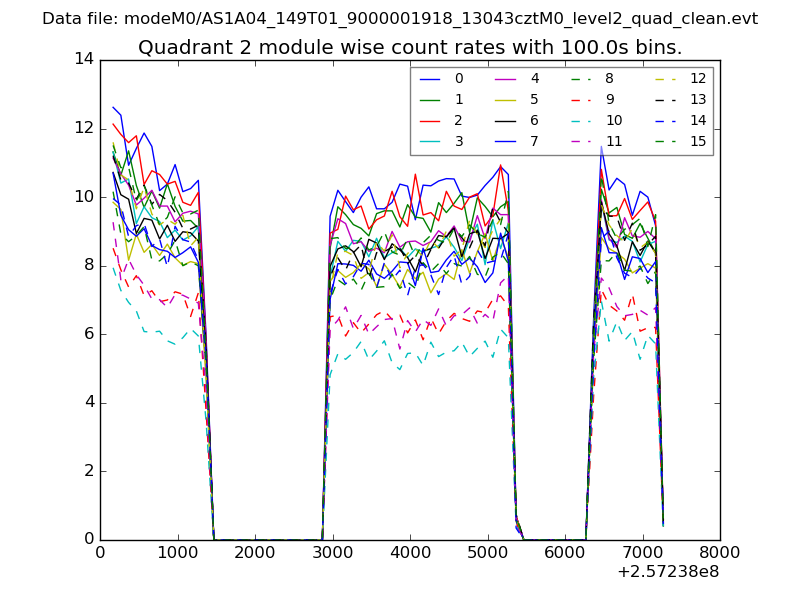
| Module-wise count rates for Quadrant B Data is divided into 100 sec bins |
 |
 |
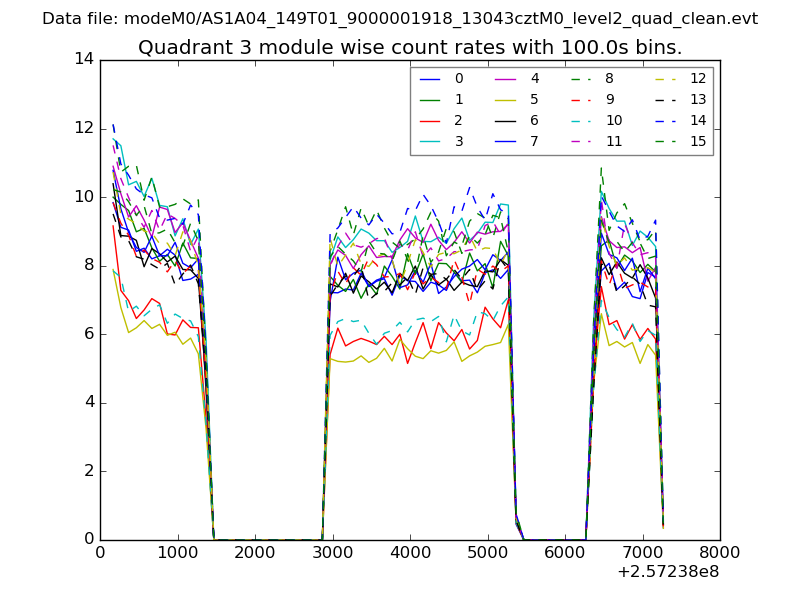
| Module-wise count rates for Quadrant C Data is divided into 100 sec bins |
 |
 |
| Module-wise count rates for Quadrant D Data is divided into 100 sec bins |
 |
 |
| Parameter | Plot |
|---|---|
| CZT HV Monitor | 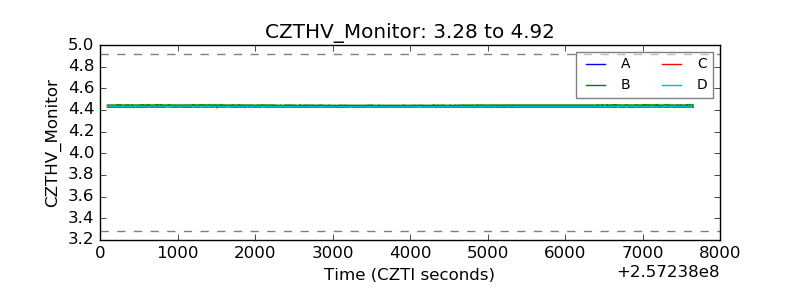 |
| D_VDD | 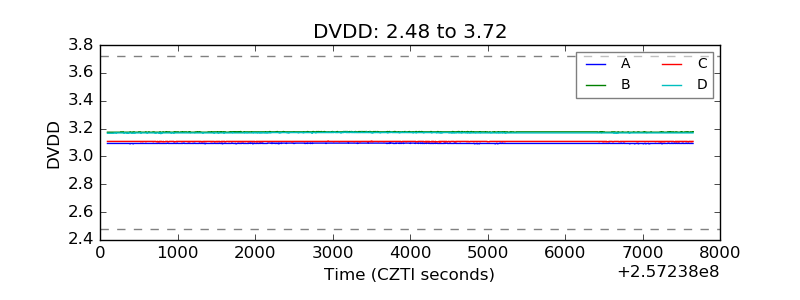 |
| Temperature 1 | 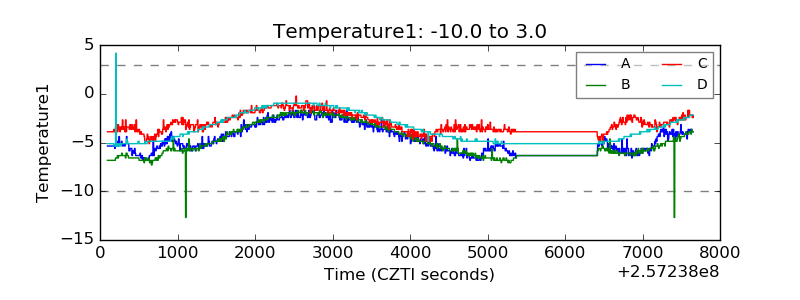 |
| Veto HV Monitor | 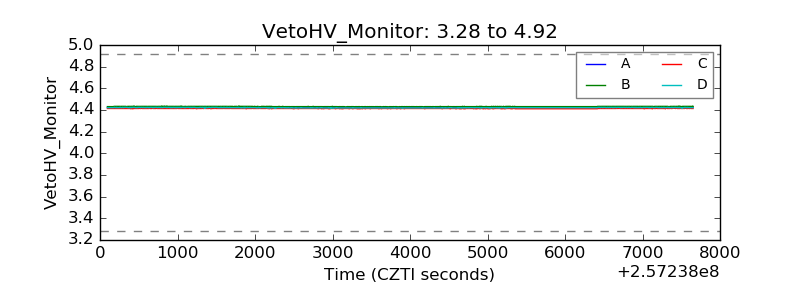 |
| Veto LLD | 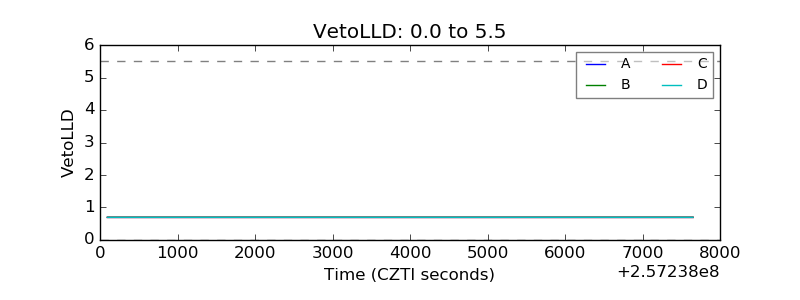 |
| Alpha Counter | 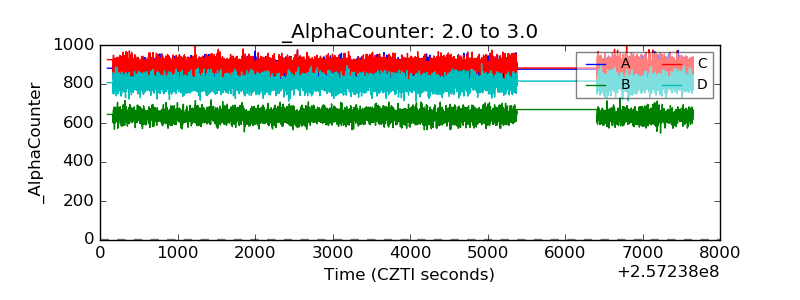 |
| _CPM_Rate | 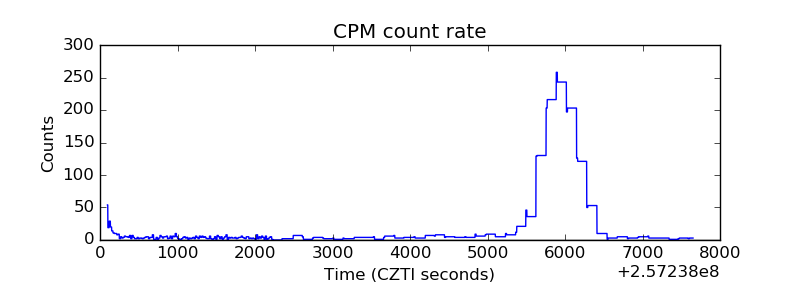 |
| CZT Counter |  |
| +2.5 Volts monitor |  |
| +5 Volts monitor |  |
| _ROLL_ROT | 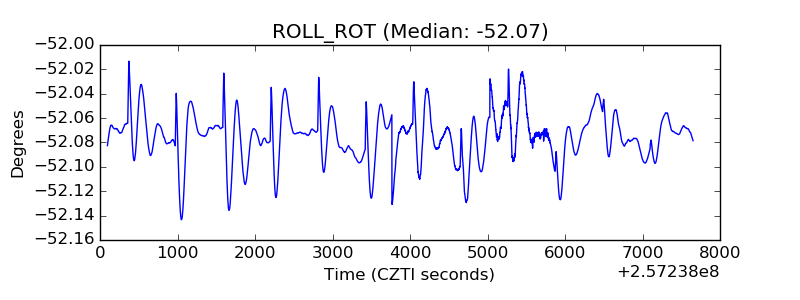 |
| _Roll_DEC | 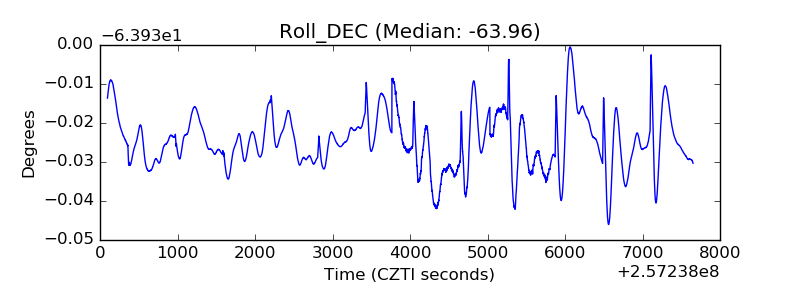 |
| _Roll_RA | 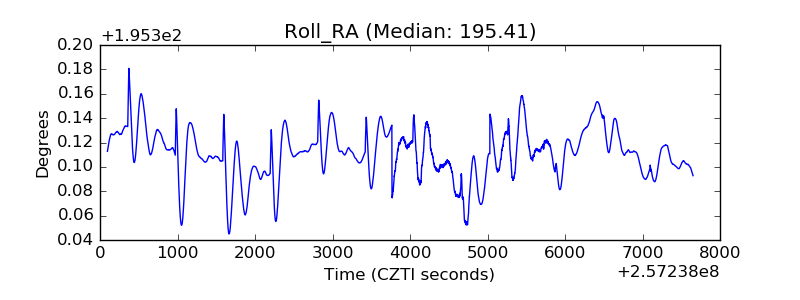 |
| Veto Counter | 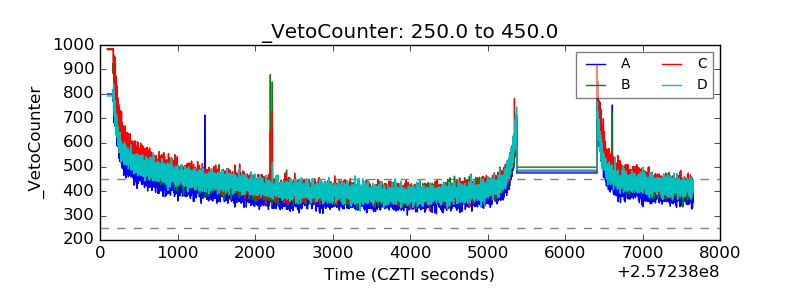 |