| Param | Original file | Final file |
|---|---|---|
| Filename | modeM0/AS1A04_149T01_9000001918_13047cztM0_level2.evt | modeM0/AS1A04_149T01_9000001918_13047cztM0_level2_quad_clean.evt |
| Size (bytes) | 637,536,960 | 94,161,600 |
| Size | 608.0 MB | 89.8 MB |
| Events in quadrant A | 3,827,017 | 598,678 |
| Events in quadrant B | 7,451,236 | 527,924 |
| Events in quadrant C | 3,549,329 | 602,668 |
| Events in quadrant D | 3,949,195 | 577,780 |
| Mode M9 | |||
|---|---|---|---|
| Quadrant | BADHDUFLAG | Total packets | Discarded packets |
| A | 0 | 1 | 0 |
| B | 0 | 1 | 0 |
| C | 0 | 1 | 0 |
| D | 0 | 1 | 0 |
| Mode M0 | |||
|---|---|---|---|
| Quadrant | BADHDUFLAG | Total packets | Discarded packets |
| A | 0 | 16507 | 3 |
| B | 0 | 27340 | 3 |
| C | 0 | 16114 | 3 |
| D | 0 | 17156 | 3 |
| Mode SS | |||
|---|---|---|---|
| Quadrant | BADHDUFLAG | Total packets | Discarded packets |
| A | 0 | 162 | 0 |
| B | 0 | 162 | 0 |
| C | 0 | 162 | 0 |
| D | 0 | 162 | 0 |
| Quadrant | Total seconds | Saturated seconds | Saturation percentage |
|---|---|---|---|
| A | 7812 | 186 | 2.380952% |
| B | 7812 | 1812 | 23.195084% |
| C | 7812 | 118 | 1.510497% |
| D | 7812 | 139 | 1.779314% |
Noise dominated data is calculated using 1-second bins in cleaned event files. If a bin has >2000 counts, and if more than 50% of those come from <1% of pixels, then it is considered to be noise-dominated and hence unusable.
| Quadrant | # 1 sec bins | Bins with >0 counts | Bins with >2000 counts | High rate bins dominated by noise | Noise dominated (total time) | Noise dominated (detector-on time) | Marked lightcurve |
|---|---|---|---|---|---|---|---|
| A | 8048 | 7815 | 2 | 2 | 0.02% | 0.03% | 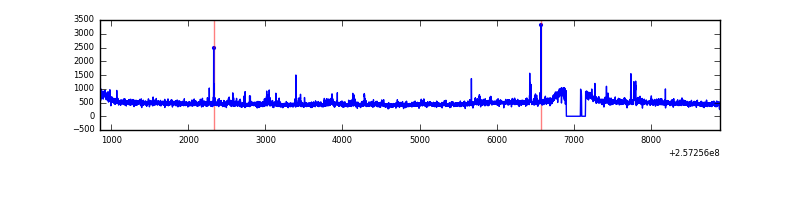 |
| B | 8048 | 7815 | 1006 | 1006 | 12.50% | 12.87% | 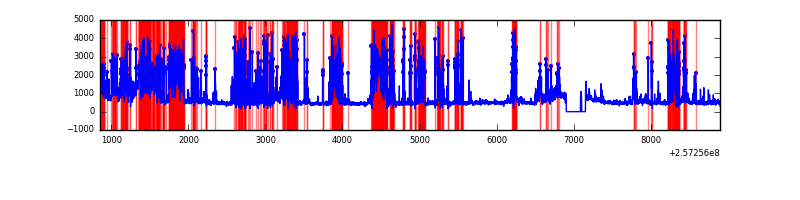 |
| C | 8048 | 7815 | 0 | 0 | 0.00% | 0.00% | 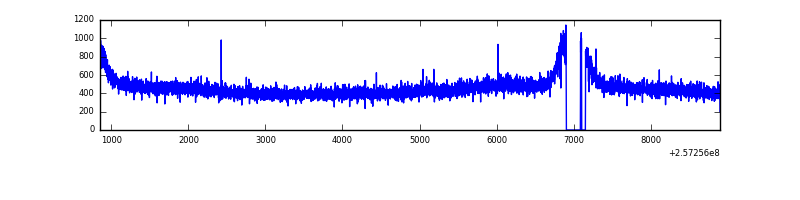 |
| D | 8048 | 7815 | 23 | 23 | 0.29% | 0.29% | 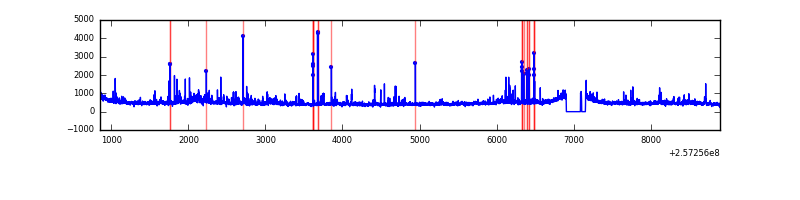 |
Top three noisy pixels from each quadrant. If the there are fewer than three noisy pixels in the level2.evt file, extra rows are filled as -1
| Pixel properties | Quadrant properties | ||||||
|---|---|---|---|---|---|---|---|
| Quadrant | DetID | PixID | Counts | Sigma | Mean | Median | Sigma |
| A | 12 | 189 | 112948 | 594.34 | 924 | 900 | 188.5 |
| A | 8 | 15 | 55692 | 290.64 | 924 | 900 | 188.5 |
| A | 0 | 23 | 31390 | 161.73 | 924 | 900 | 188.5 |
| B | 4 | 239 | 2912141 | 18735.07 | 810 | 788 | 155.4 |
| B | 0 | 85 | 1039699 | 6685.57 | 810 | 788 | 155.4 |
| B | 0 | 219 | 125960 | 805.5 | 810 | 788 | 155.4 |
| C | 8 | 128 | 11520 | 50.68 | 905 | 907 | 209.4 |
| C | 13 | 61 | 6552 | 26.96 | 905 | 907 | 209.4 |
| C | 8 | 112 | 6250 | 25.52 | 905 | 907 | 209.4 |
| D | 8 | 195 | 236359 | 1089.83 | 902 | 874 | 216.1 |
| D | 1 | 52 | 191871 | 883.94 | 902 | 874 | 216.1 |
| D | 2 | 69 | 46389 | 210.64 | 902 | 874 | 216.1 |
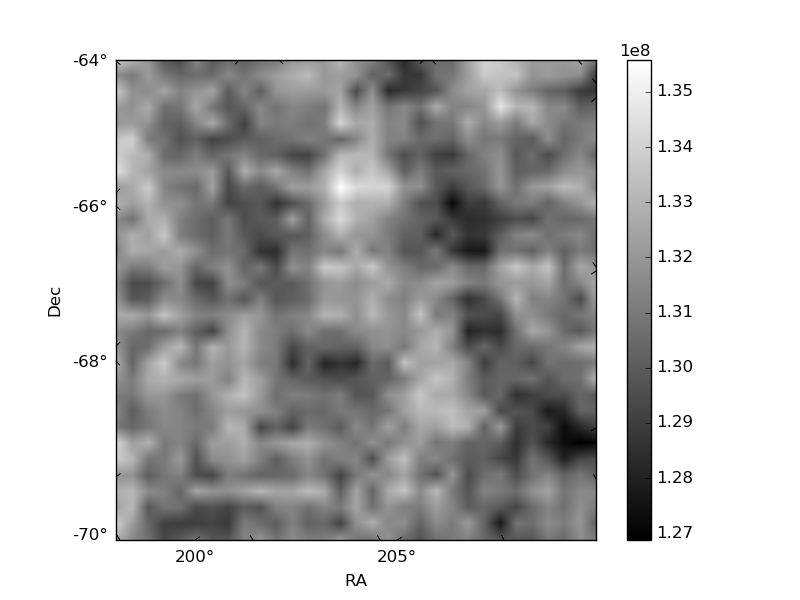
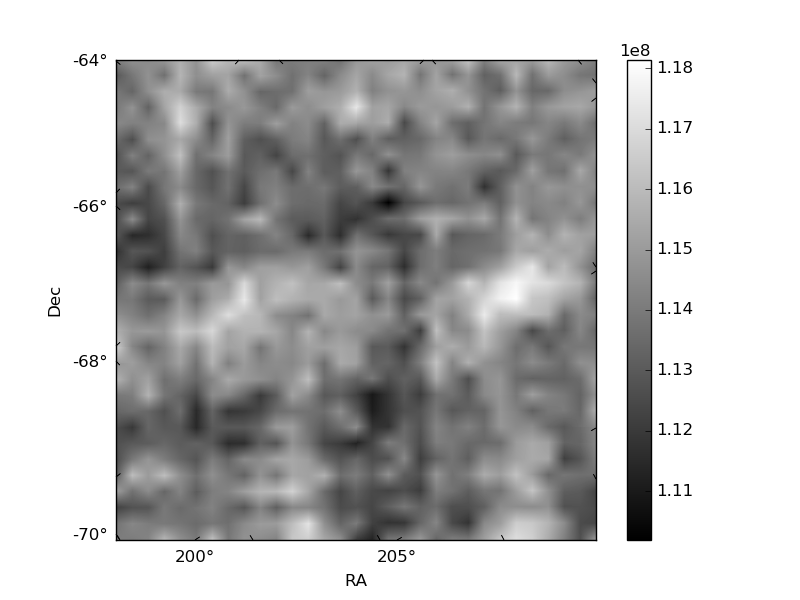
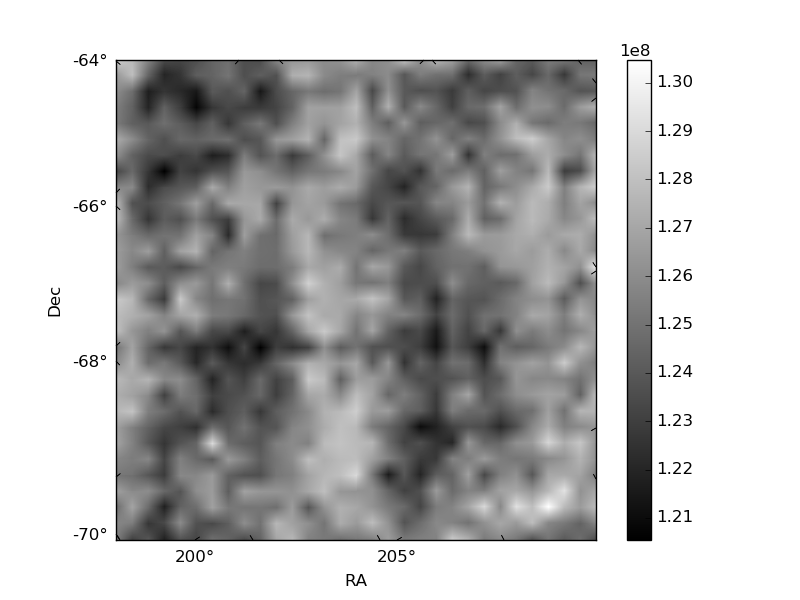
Histogram calculated using DETX and DETY for each event in the final _common_clean file
| Quadrant A | 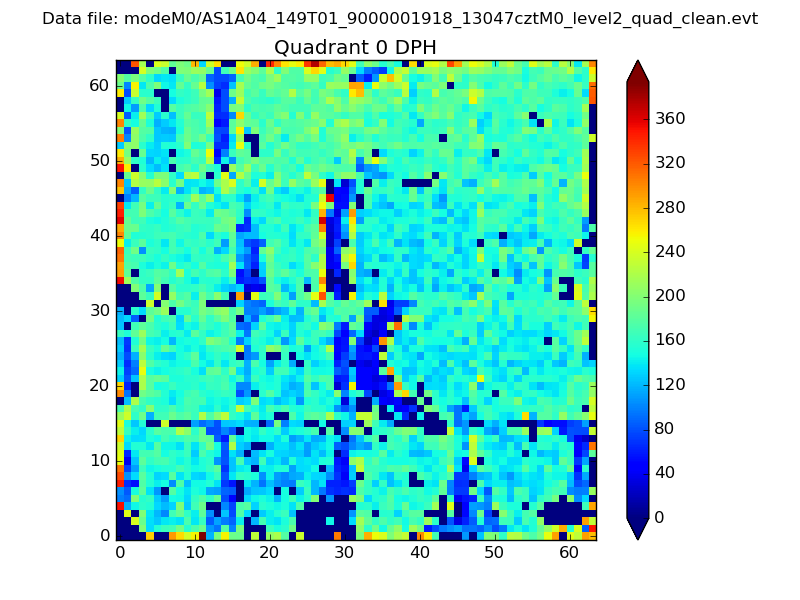 |
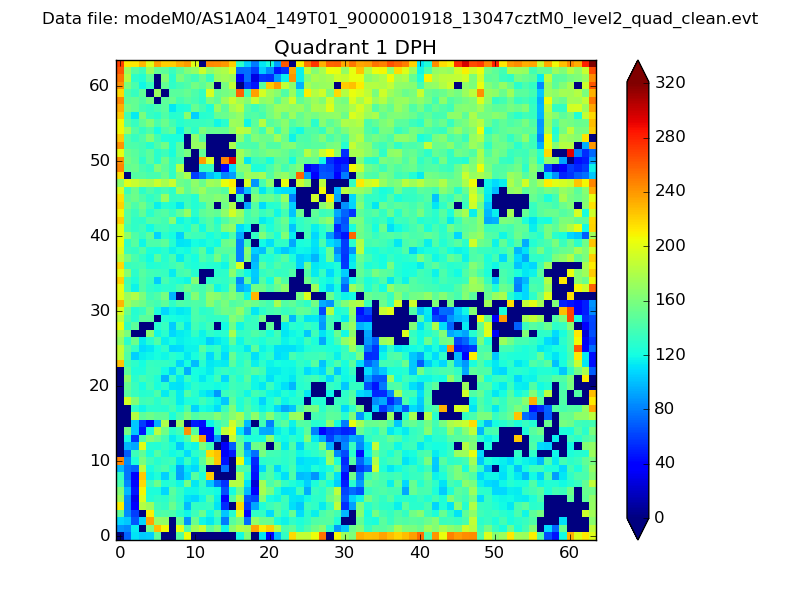 |
Quadrant B |
|---|---|---|---|
| Quadrant D | 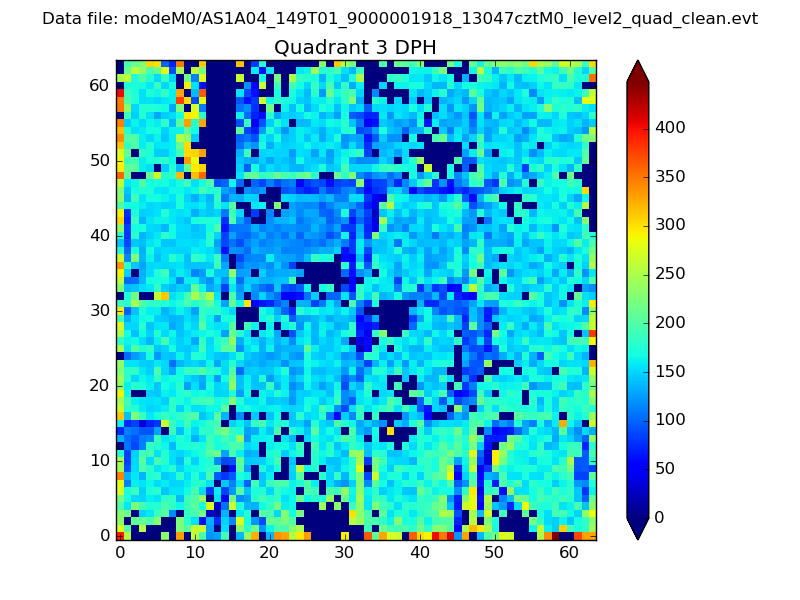 |
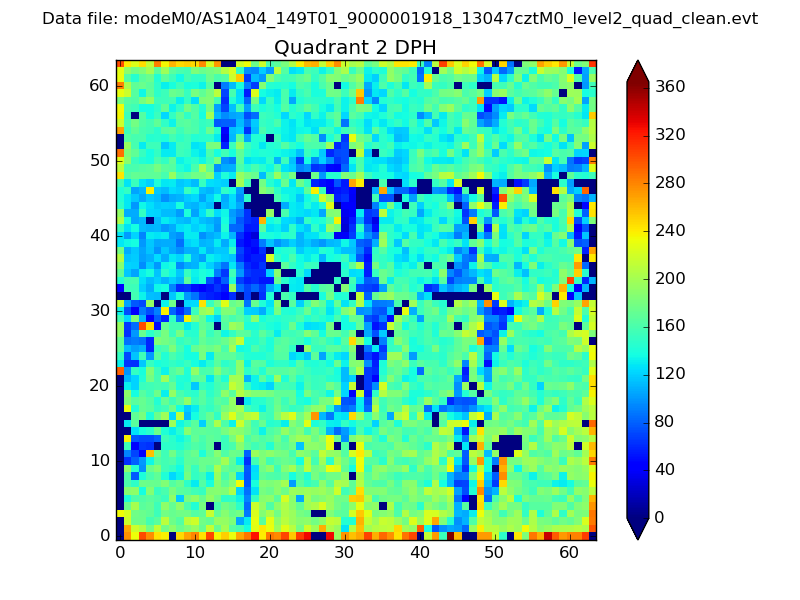 |
Quadrant C |
| Plot type | Count rate plots | Images |
|---|---|---|
| Comparison with Poisson distribution Blue bars denote a histogram of data divided into 1 sec bins. Red curve is a Poisson curve with rate = median count rate of data. |
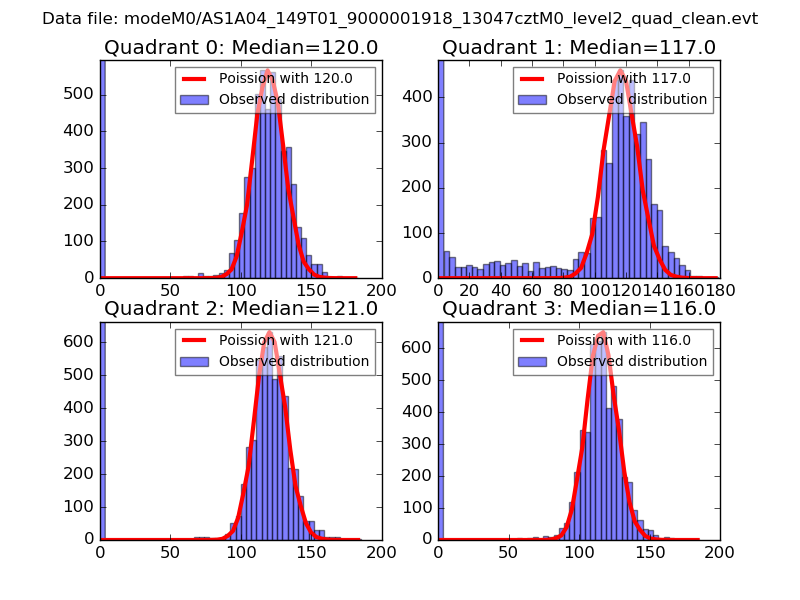 |
 |
| Quadrant-wise count rates Data is divided into 100 sec bins |
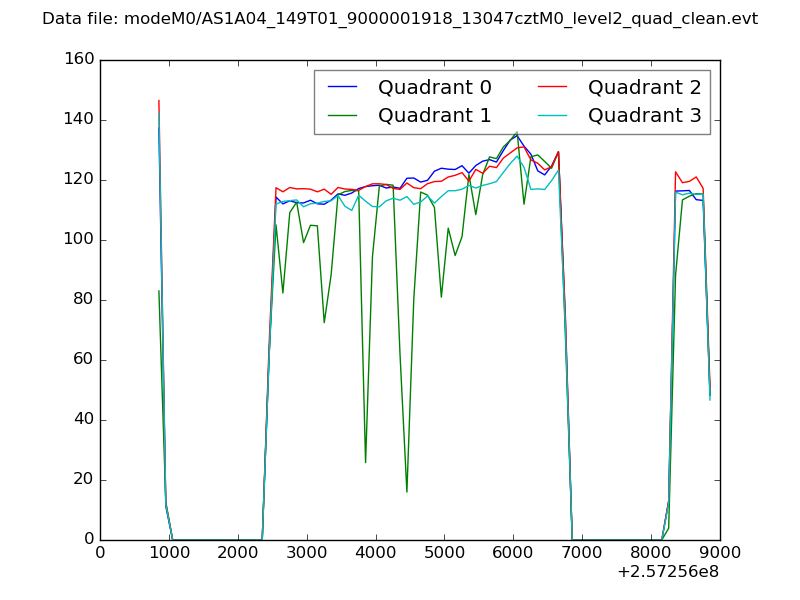 |
|
| Module-wise count rates for Quadrant A Data is divided into 100 sec bins |
 |
 |
| Module-wise count rates for Quadrant B Data is divided into 100 sec bins |
 |
 |
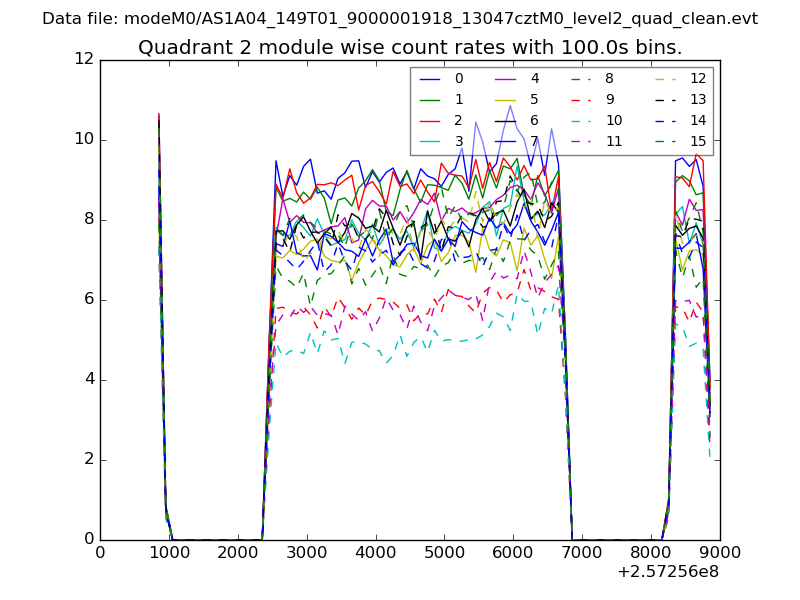
| Module-wise count rates for Quadrant C Data is divided into 100 sec bins |
 |
 |
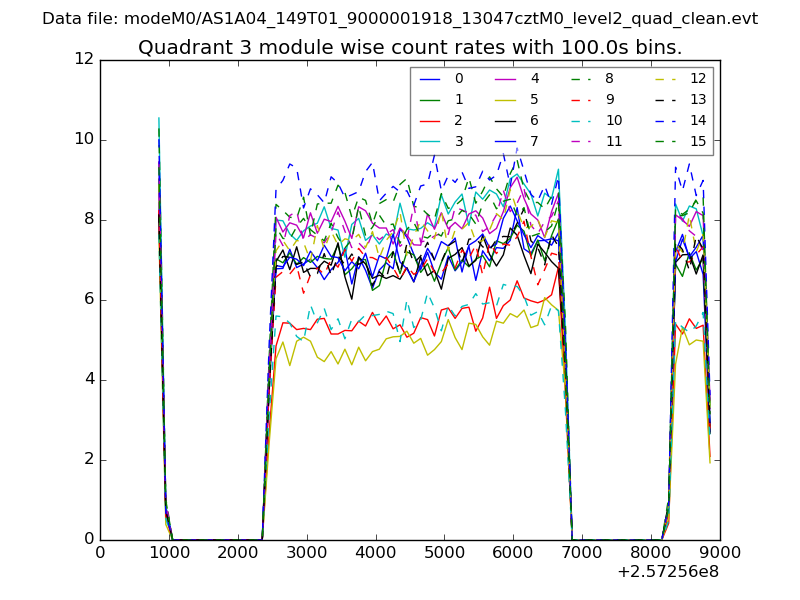
| Module-wise count rates for Quadrant D Data is divided into 100 sec bins |
 |
 |
| Parameter | Plot |
|---|---|
| CZT HV Monitor | 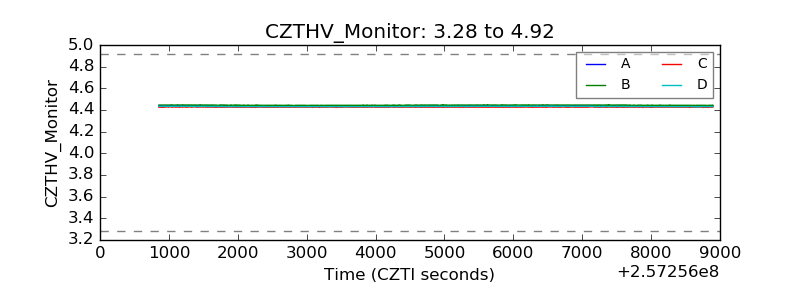 |
| D_VDD | 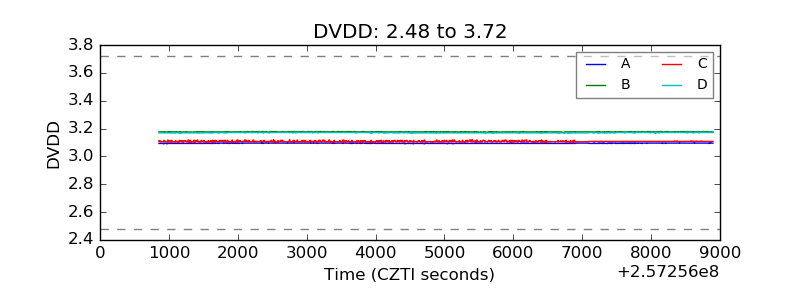 |
| Temperature 1 |  |
| Veto HV Monitor | 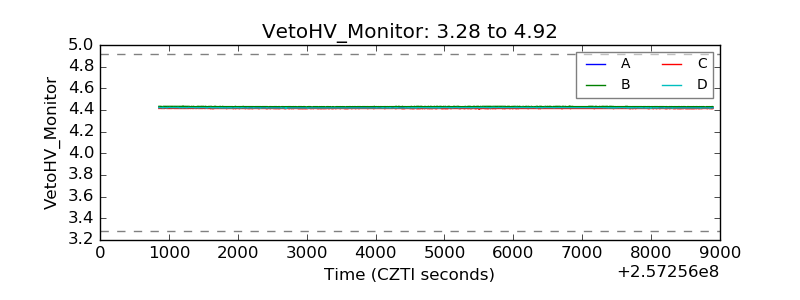 |
| Veto LLD | 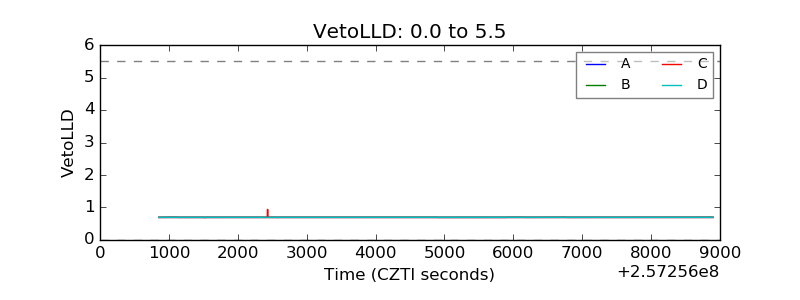 |
| Alpha Counter | 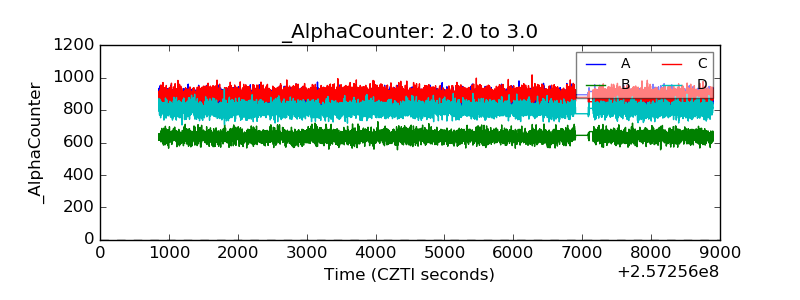 |
| _CPM_Rate | 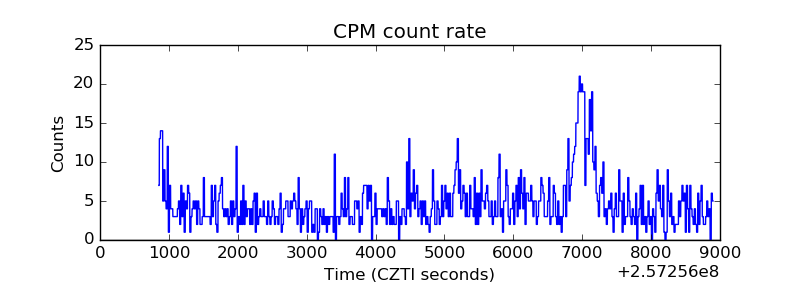 |
| CZT Counter | 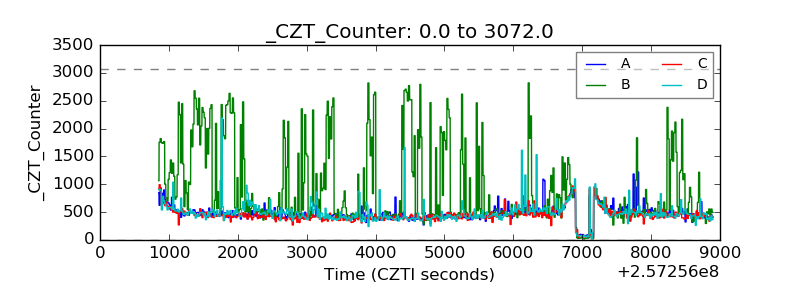 |
| +2.5 Volts monitor |  |
| +5 Volts monitor |  |
| _ROLL_ROT | 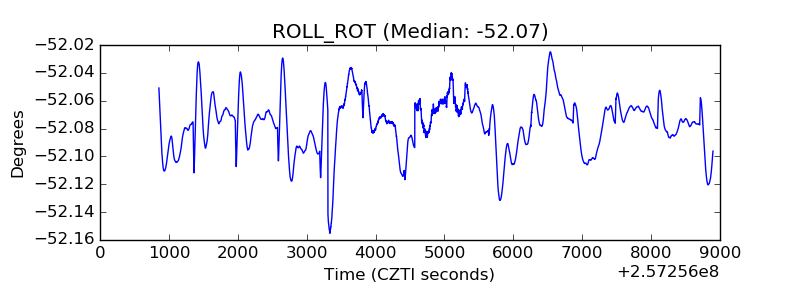 |
| _Roll_DEC | 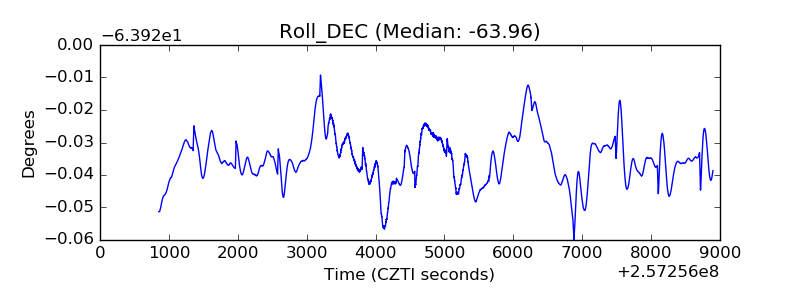 |
| _Roll_RA | 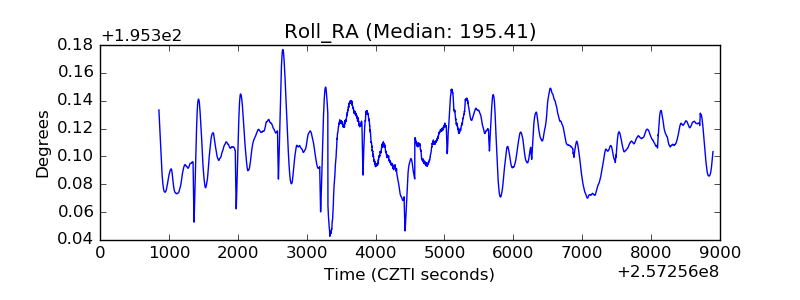 |
| Veto Counter |  |