| Param | Original file | Final file |
|---|---|---|
| Filename | modeM0/AS1G08_045T01_9000001920cztM0_level2.fits | modeM0/AS1G08_045T01_9000001920cztM0_level2_quad_clean.evt |
| Size (bytes) | 611,781,120 | 598,826,880 |
| Size | 583.4 MB | 571.1 MB |
| Events in quadrant A | 3,798,068 | 3,651,651 |
| Events in quadrant B | 3,068,734 | 3,187,221 |
| Events in quadrant C | 3,826,858 | 3,533,443 |
| Events in quadrant D | 3,247,758 | 3,184,420 |
| Mode SS | |||
|---|---|---|---|
| Quadrant | BADHDUFLAG | Total packets | Discarded packets |
| A | 0 | 1356 | 0 |
| B | 0 | 1356 | 0 |
| C | 0 | 1356 | 0 |
| D | 0 | 1356 | 0 |
| Mode M0 | |||
|---|---|---|---|
| Quadrant | BADHDUFLAG | Total packets | Discarded packets |
| A | 0 | 147753 | 0 |
| B | 0 | 235588 | 0 |
| C | 0 | 136774 | 0 |
| D | 0 | 172559 | 0 |
| Mode M9 | |||
|---|---|---|---|
| Quadrant | BADHDUFLAG | Total packets | Discarded packets |
| A | 0 | 113 | 0 |
| B | 0 | 113 | 0 |
| C | 0 | 113 | 0 |
| D | 0 | 113 | 0 |
| Quadrant | Total seconds | Saturated seconds | Saturation percentage |
|---|---|---|---|
| A | 66774 | 977 | 1.463144% |
| B | 66764 | 15368 | 23.018393% |
| C | 66766 | 467 | 0.699458% |
| D | 66776 | 2680 | 4.013418% |
Noise dominated data is calculated using 1-second bins in cleaned event files. If a bin has >2000 counts, and if more than 50% of those come from <1% of pixels, then it is considered to be noise-dominated and hence unusable.
| Quadrant | # 1 sec bins | Bins with >0 counts | Bins with >2000 counts | High rate bins dominated by noise | Noise dominated (total time) | Noise dominated (detector-on time) | Marked lightcurve |
|---|---|---|---|---|---|---|---|
| A | 77978 | 66798 | 0 | 0 | 0.00% | 0.00% |  |
| B | 77978 | 63473 | 0 | 0 | 0.00% | 0.00% | 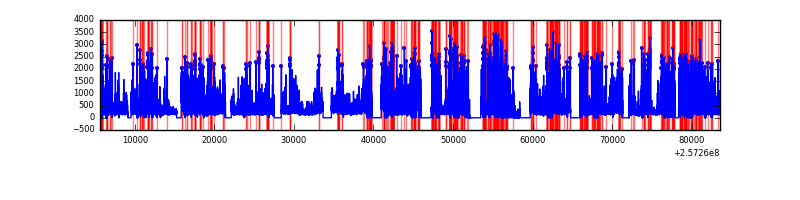 |
| C | 77978 | 66800 | 0 | 0 | 0.00% | 0.00% |  |
| D | 77978 | 66616 | 0 | 0 | 0.00% | 0.00% | 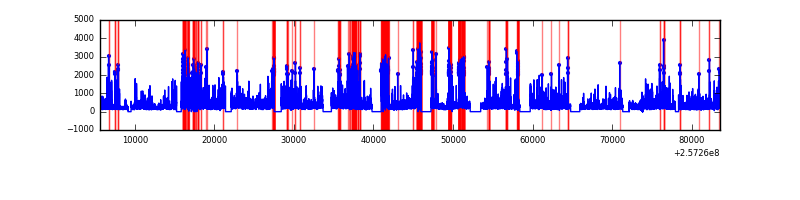 |
Top three noisy pixels from each quadrant. If the there are fewer than three noisy pixels in the level2.evt file, extra rows are filled as -1
| Pixel properties | Quadrant properties | ||||||
|---|---|---|---|---|---|---|---|
| Quadrant | DetID | PixID | Counts | Sigma | Mean | Median | Sigma |
| A | 0 | 29 | 3780 | 11.53 | 990 | 924 | 247.6 |
| A | 7 | 110 | 3102 | 8.8 | 990 | 924 | 247.6 |
| A | 9 | 19 | 2888 | 7.93 | 990 | 924 | 247.6 |
| B | 2 | 9 | 2695 | 11.94 | 808 | 767 | 161.4 |
| B | 3 | 17 | 2011 | 7.71 | 808 | 767 | 161.4 |
| B | 2 | 8 | 2006 | 7.68 | 808 | 767 | 161.4 |
| C | 12 | 241 | 2774 | 6.99 | 1011 | 942 | 262.3 |
| C | 3 | 126 | 2625 | 6.42 | 1011 | 942 | 262.3 |
| C | 2 | 191 | 2554 | 6.15 | 1011 | 942 | 262.3 |
| D | 6 | 231 | 2462 | 6.57 | 926 | 845 | 245.9 |
| D | 10 | 189 | 2354 | 6.14 | 926 | 845 | 245.9 |
| D | 3 | 14 | 2333 | 6.05 | 926 | 845 | 245.9 |
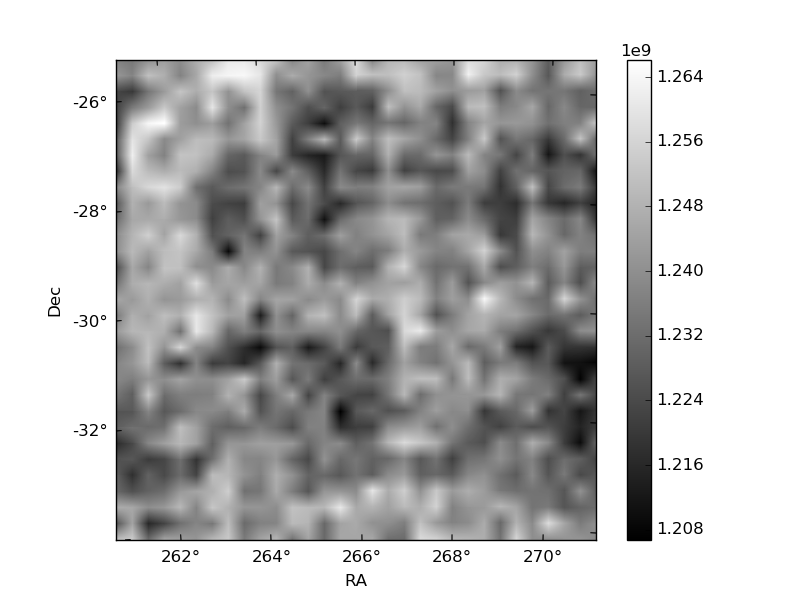
Histogram calculated using DETX and DETY for each event in the final _common_clean file
| Quadrant A | 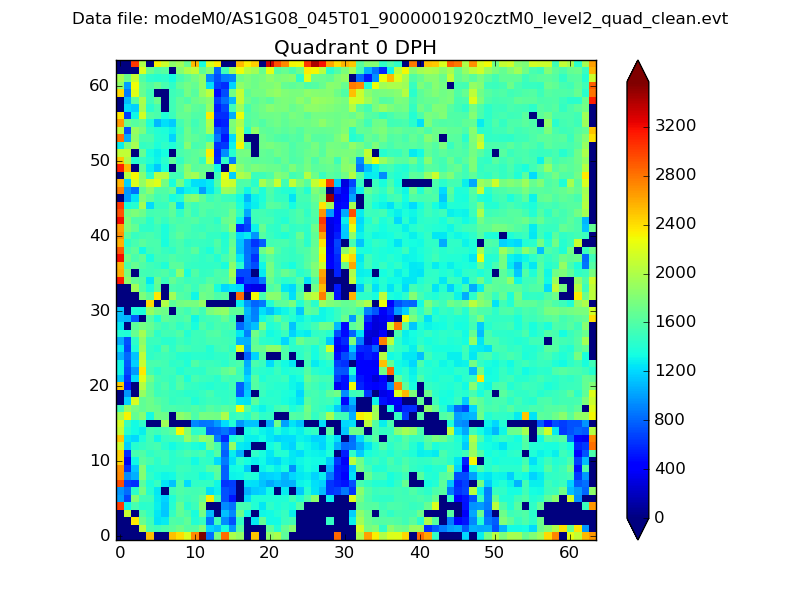 |
 |
Quadrant B |
|---|---|---|---|
| Quadrant D |  |
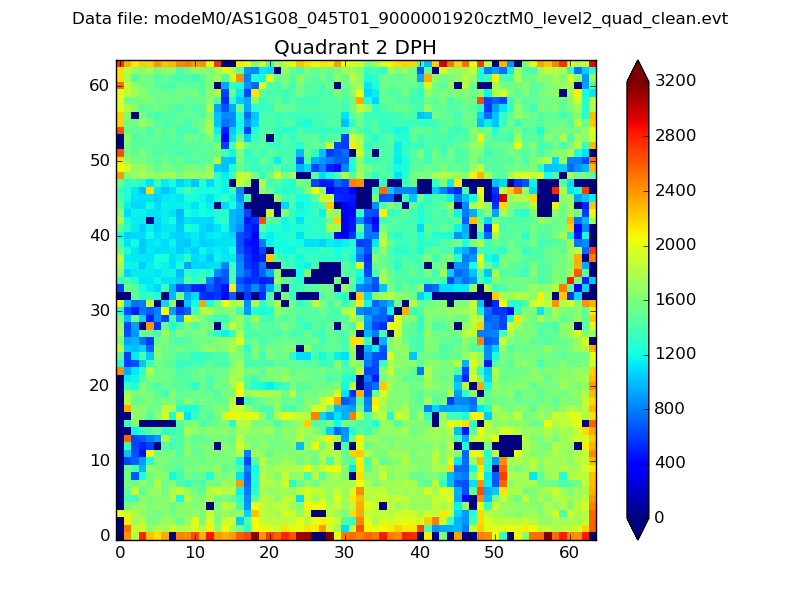 |
Quadrant C |
| Plot type | Count rate plots | Images |
|---|---|---|
| Comparison with Poisson distribution Blue bars denote a histogram of data divided into 1 sec bins. Red curve is a Poisson curve with rate = median count rate of data. |
 |
 |
| Quadrant-wise count rates Data is divided into 100 sec bins |
 |
|
| Module-wise count rates for Quadrant A Data is divided into 100 sec bins |
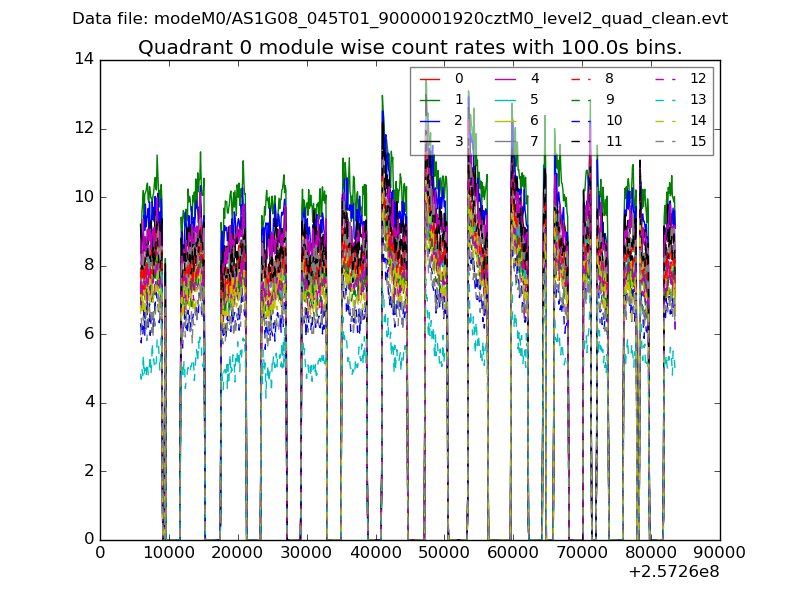 |
 |
| Module-wise count rates for Quadrant B Data is divided into 100 sec bins |
 |
 |
| Module-wise count rates for Quadrant C Data is divided into 100 sec bins |
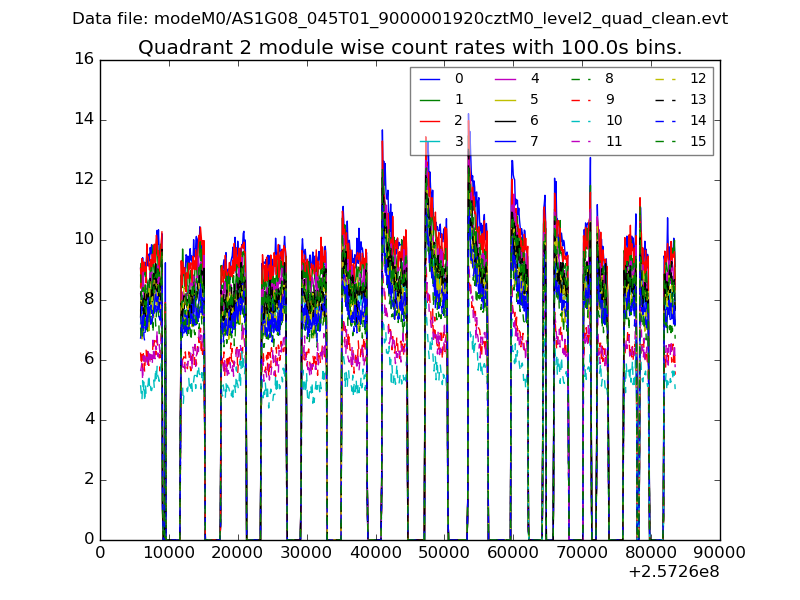 |
 |
| Module-wise count rates for Quadrant D Data is divided into 100 sec bins |
 |
 |
| Parameter | Plot |
|---|---|
| CZT HV Monitor |  |
| D_VDD | 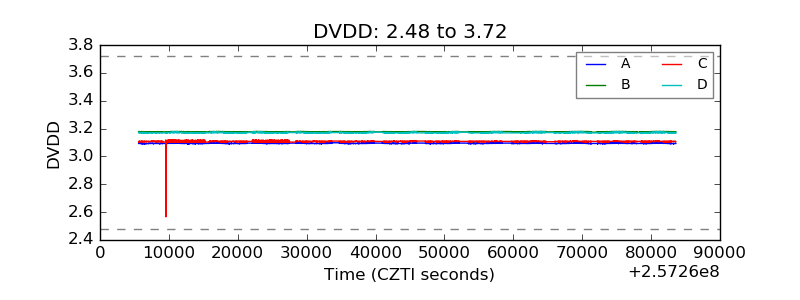 |
| Temperature 1 | 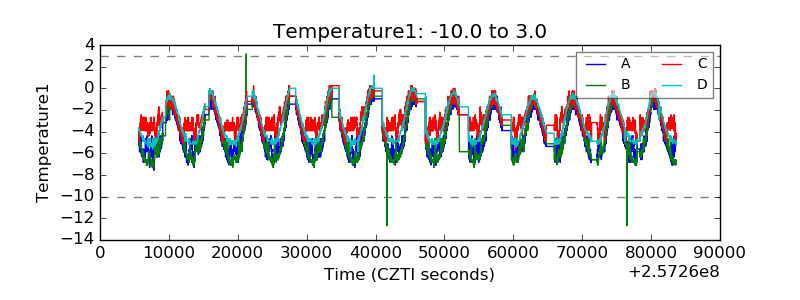 |
| Veto HV Monitor | 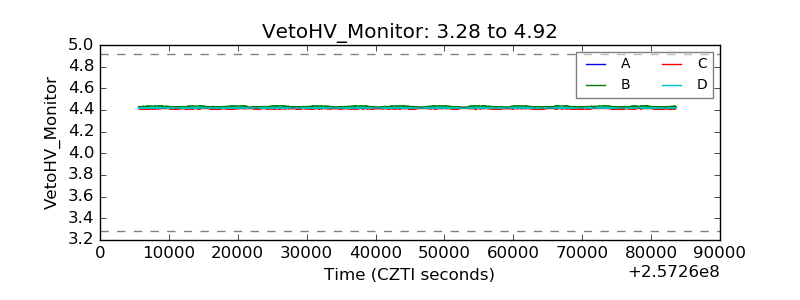 |
| Veto LLD | 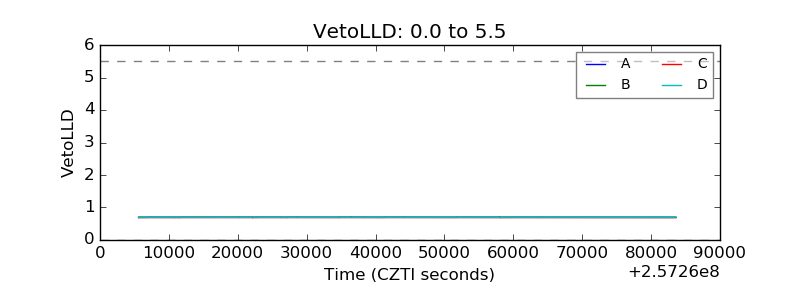 |
| Alpha Counter |  |
| _CPM_Rate |  |
| CZT Counter |  |
| +2.5 Volts monitor | 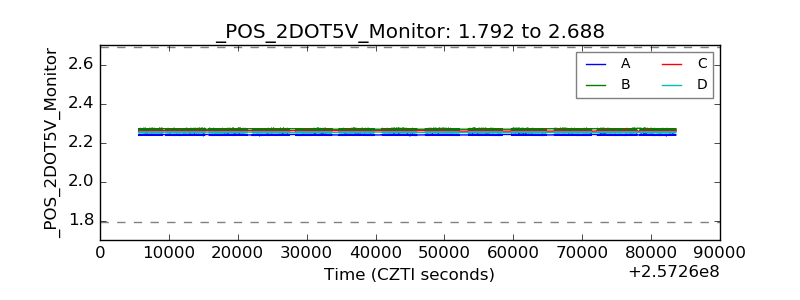 |
| +5 Volts monitor | 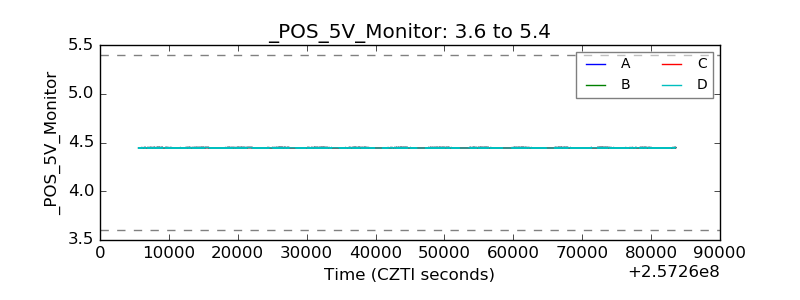 |
| _ROLL_ROT |  |
| _Roll_DEC | 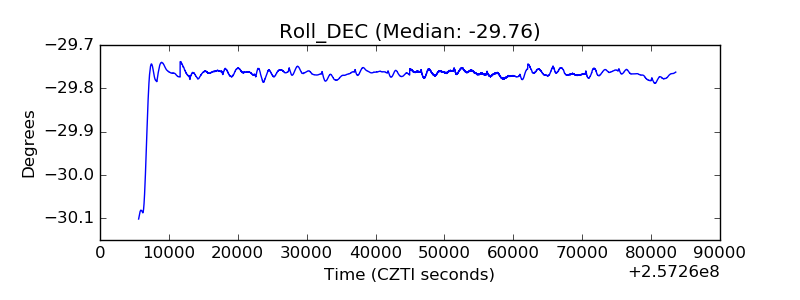 |
| _Roll_RA | 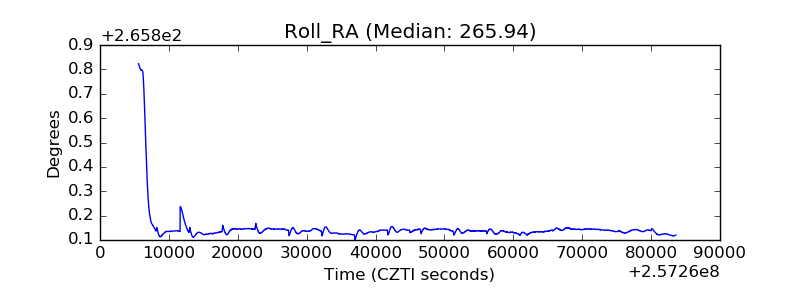 |
| Veto Counter |  |