| Param | Original file | Final file |
|---|---|---|
| Filename | modeM0/AS1G08_045T01_9000001920_13047cztM0_level2.evt | modeM0/AS1G08_045T01_9000001920_13047cztM0_level2_quad_clean.evt |
| Size (bytes) | 203,492,160 | 43,456,320 |
| Size | 194.1 MB | 41.4 MB |
| Events in quadrant A | 1,243,334 | 292,036 |
| Events in quadrant B | 2,143,215 | 263,185 |
| Events in quadrant C | 1,146,294 | 292,017 |
| Events in quadrant D | 1,448,550 | 279,317 |
| Mode SS | |||
|---|---|---|---|
| Quadrant | BADHDUFLAG | Total packets | Discarded packets |
| A | 0 | 52 | 0 |
| B | 0 | 52 | 0 |
| C | 0 | 52 | 0 |
| D | 0 | 52 | 0 |
| Mode M0 | |||
|---|---|---|---|
| Quadrant | BADHDUFLAG | Total packets | Discarded packets |
| A | 0 | 5468 | 1 |
| B | 0 | 8087 | 0 |
| C | 0 | 5289 | 0 |
| D | 0 | 6180 | 0 |
| Quadrant | Total seconds | Saturated seconds | Saturation percentage |
|---|---|---|---|
| A | 2640 | 2 | 0.075758% |
| B | 2640 | 435 | 16.477273% |
| C | 2640 | 1 | 0.037879% |
| D | 2640 | 34 | 1.287879% |
Noise dominated data is calculated using 1-second bins in cleaned event files. If a bin has >2000 counts, and if more than 50% of those come from <1% of pixels, then it is considered to be noise-dominated and hence unusable.
| Quadrant | # 1 sec bins | Bins with >0 counts | Bins with >2000 counts | High rate bins dominated by noise | Noise dominated (total time) | Noise dominated (detector-on time) | Marked lightcurve |
|---|---|---|---|---|---|---|---|
| A | 2641 | 2641 | 1 | 1 | 0.04% | 0.04% | 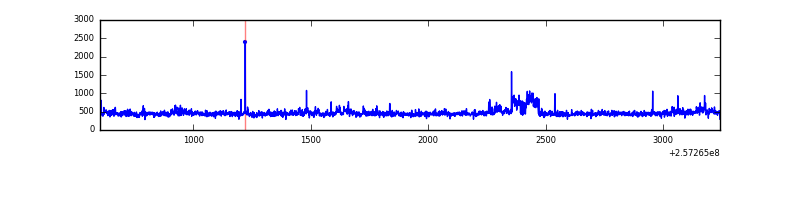 |
| B | 2641 | 2641 | 264 | 264 | 10.00% | 10.00% | 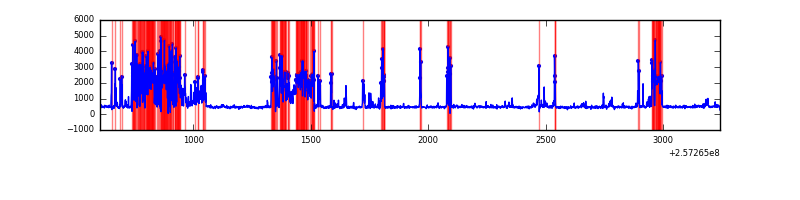 |
| C | 2641 | 2641 | 0 | 0 | 0.00% | 0.00% | 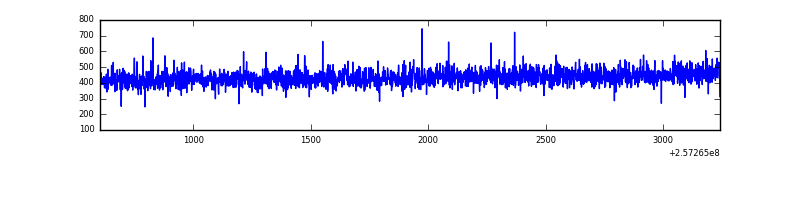 |
| D | 2641 | 2641 | 33 | 33 | 1.25% | 1.25% | 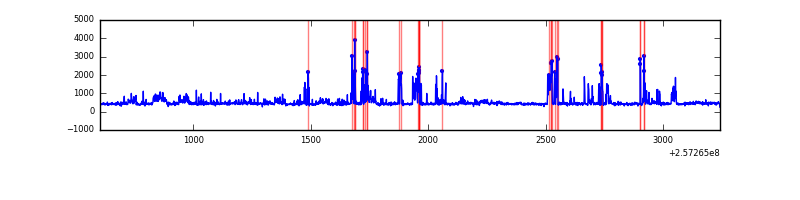 |
Top three noisy pixels from each quadrant. If the there are fewer than three noisy pixels in the level2.evt file, extra rows are filled as -1
| Pixel properties | Quadrant properties | ||||||
|---|---|---|---|---|---|---|---|
| Quadrant | DetID | PixID | Counts | Sigma | Mean | Median | Sigma |
| A | 12 | 189 | 90637 | 1453.45 | 294 | 287 | 62.2 |
| A | 1 | 162 | 5681 | 86.77 | 294 | 287 | 62.2 |
| A | 0 | 23 | 4194 | 62.85 | 294 | 287 | 62.2 |
| B | 4 | 239 | 1032883 | 19904.31 | 265 | 259 | 51.9 |
| B | 3 | 64 | 48591 | 931.62 | 265 | 259 | 51.9 |
| B | 0 | 219 | 9275 | 173.79 | 265 | 259 | 51.9 |
| C | 13 | 61 | 2134 | 26.21 | 293 | 294 | 70.2 |
| C | 8 | 222 | 1460 | 16.61 | 293 | 294 | 70.2 |
| C | 3 | 202 | 730 | 6.21 | 293 | 294 | 70.2 |
| D | 1 | 52 | 259996 | 3739.92 | 284 | 275 | 69.4 |
| D | 8 | 195 | 107047 | 1537.49 | 284 | 275 | 69.4 |
| D | 2 | 234 | 10497 | 147.19 | 284 | 275 | 69.4 |
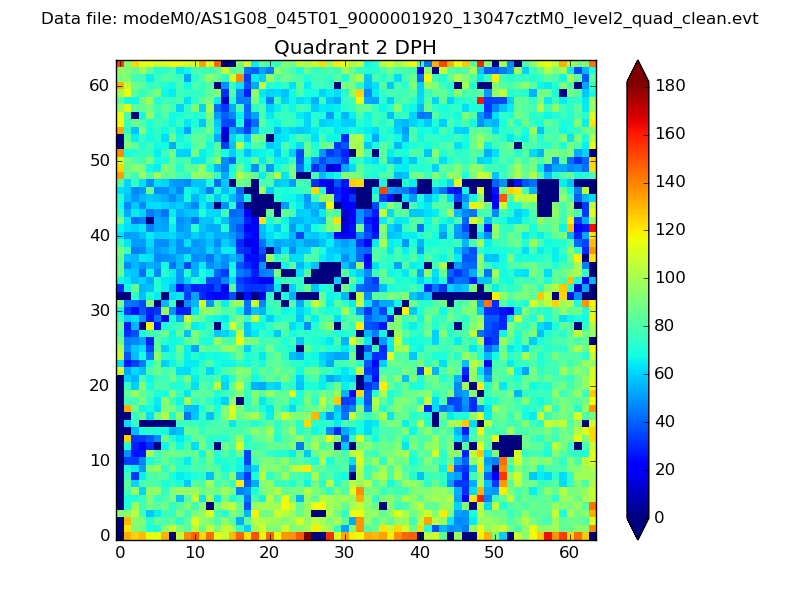
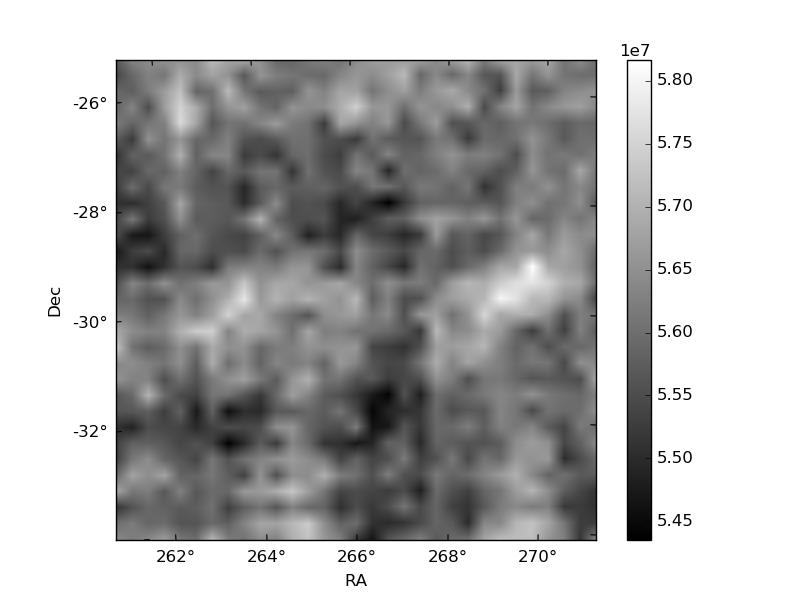
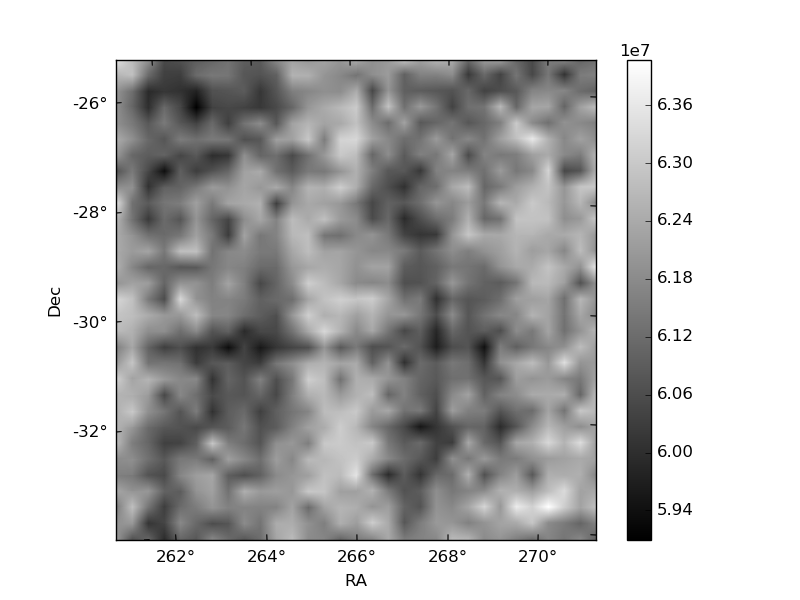
Histogram calculated using DETX and DETY for each event in the final _common_clean file
| Quadrant A | 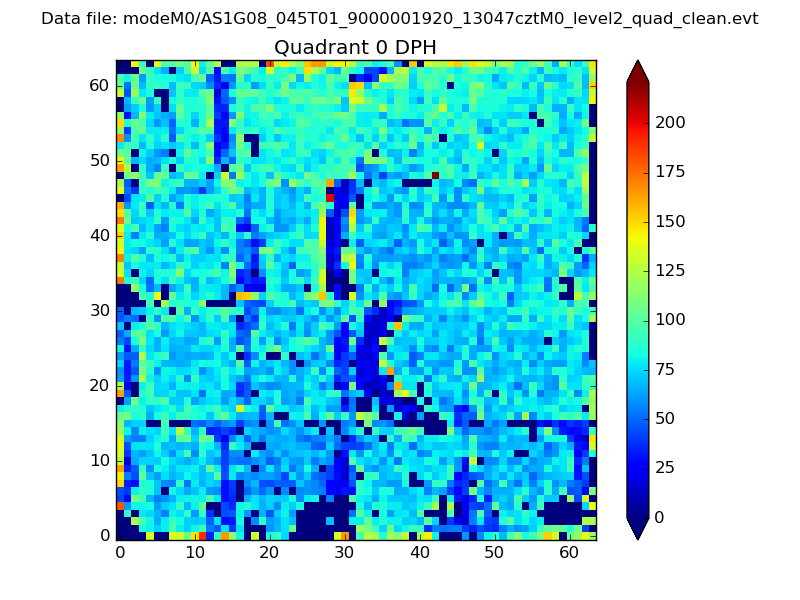 |
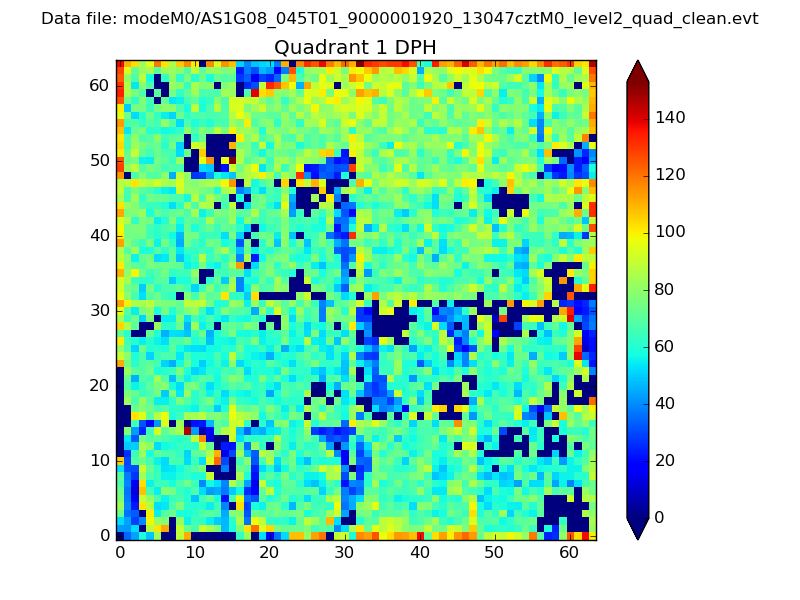 |
Quadrant B |
|---|---|---|---|
| Quadrant D | 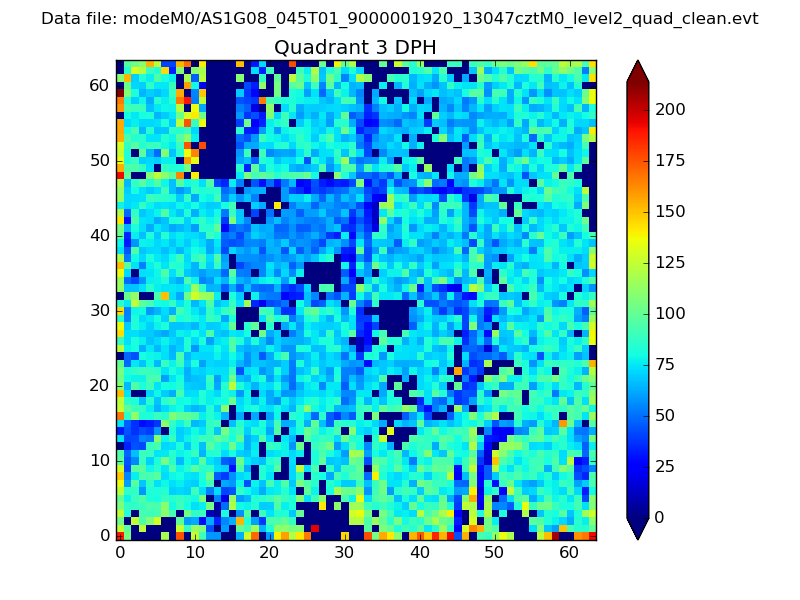 |
 |
Quadrant C |
| Plot type | Count rate plots | Images |
|---|---|---|
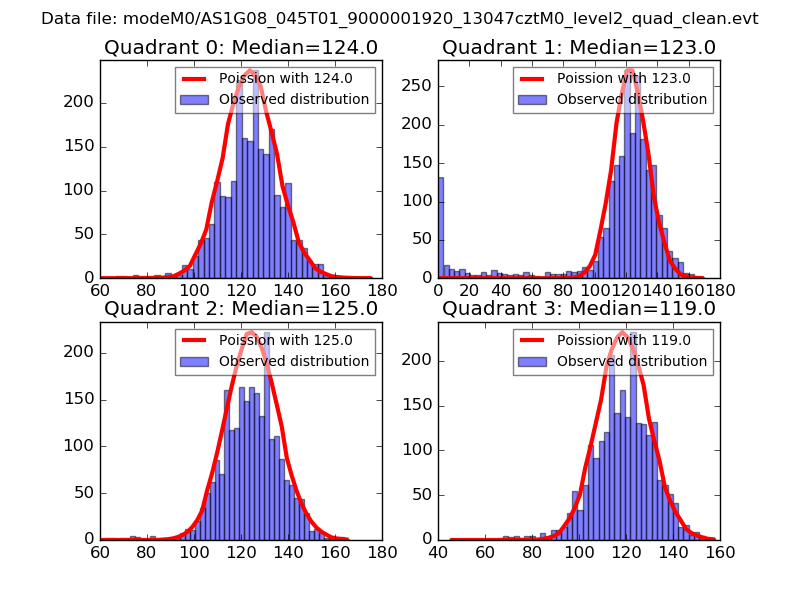
| Comparison with Poisson distribution Blue bars denote a histogram of data divided into 1 sec bins. Red curve is a Poisson curve with rate = median count rate of data. |
 |
 |
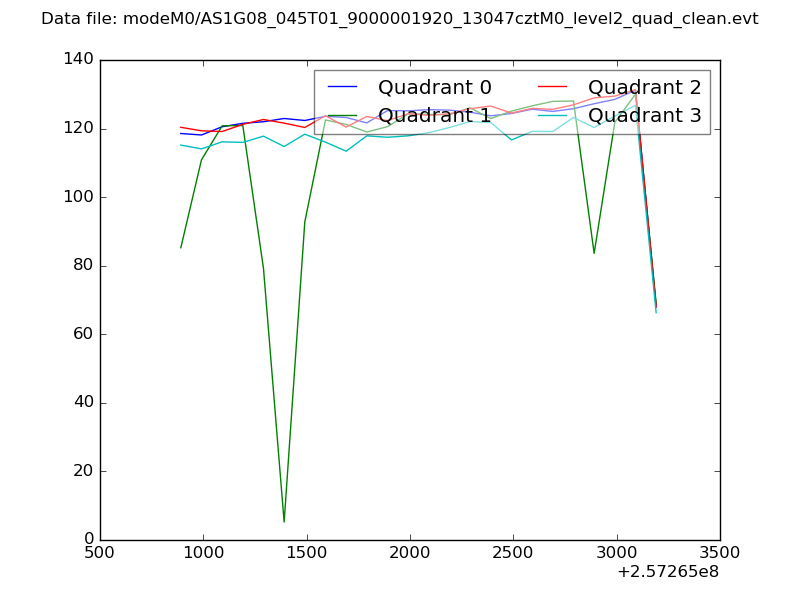
| Quadrant-wise count rates Data is divided into 100 sec bins |
 |
|
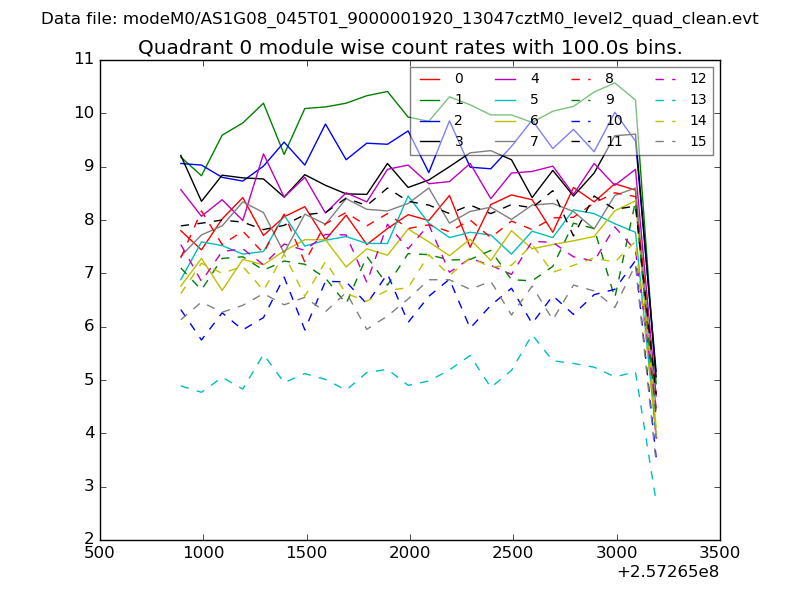
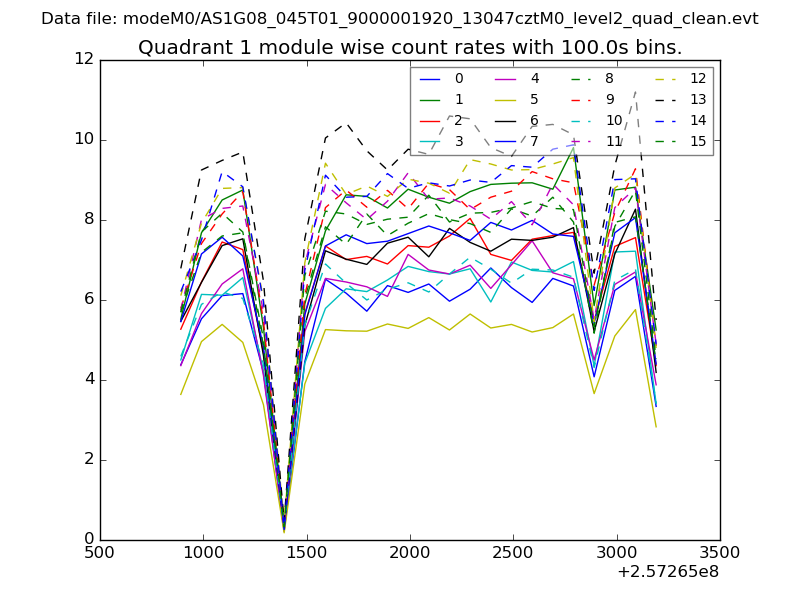
| Module-wise count rates for Quadrant A Data is divided into 100 sec bins |
 |
 |
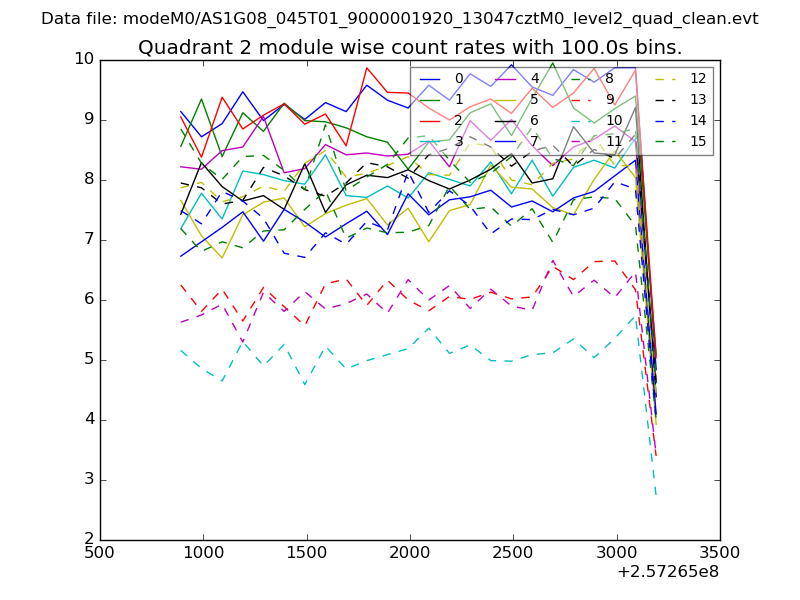
| Module-wise count rates for Quadrant B Data is divided into 100 sec bins |
 |
 |
| Module-wise count rates for Quadrant C Data is divided into 100 sec bins |
 |
 |
| Module-wise count rates for Quadrant D Data is divided into 100 sec bins |
 |
 |
| Parameter | Plot |
|---|---|
| CZT HV Monitor | 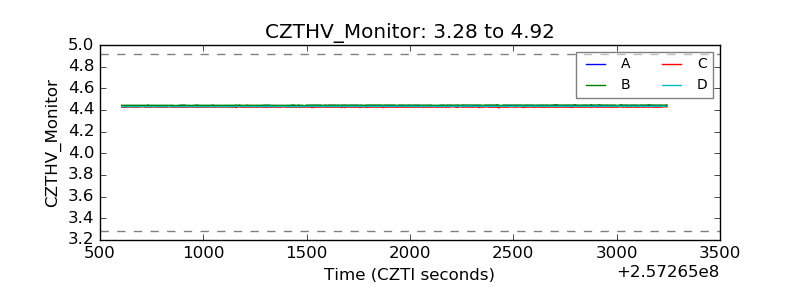 |
| D_VDD | 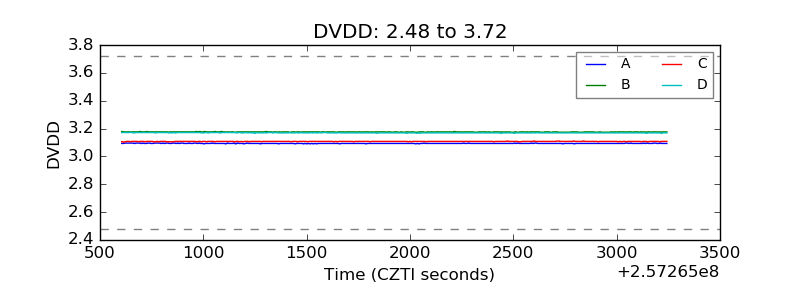 |
| Temperature 1 | 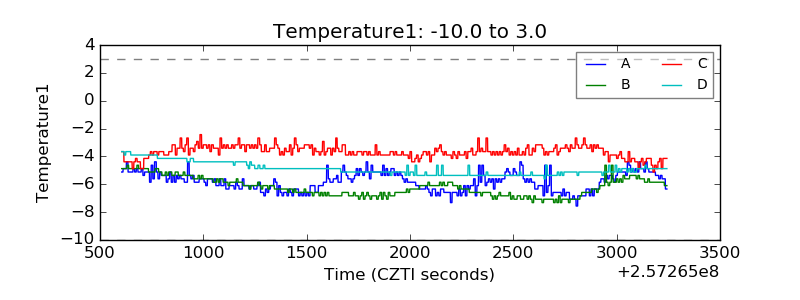 |
| Veto HV Monitor | 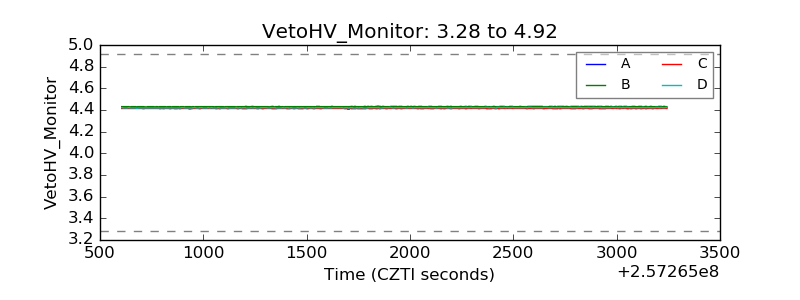 |
| Veto LLD |  |
| Alpha Counter | 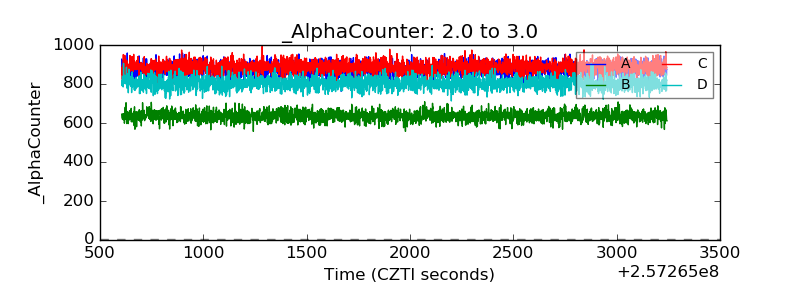 |
| _CPM_Rate | 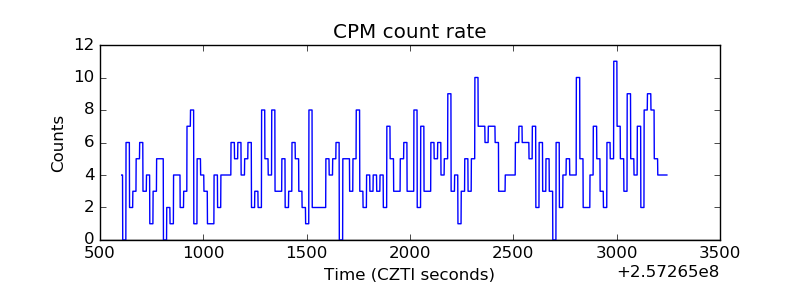 |
| CZT Counter | 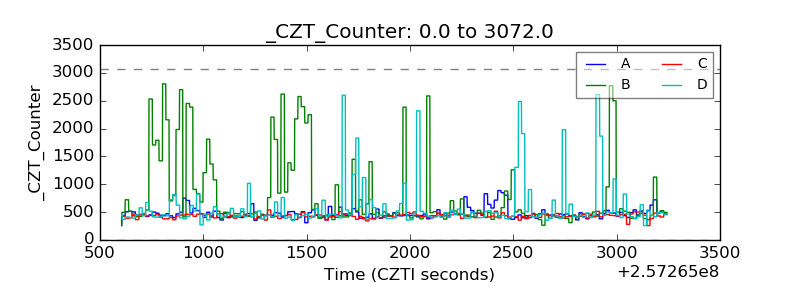 |
| +2.5 Volts monitor |  |
| +5 Volts monitor | 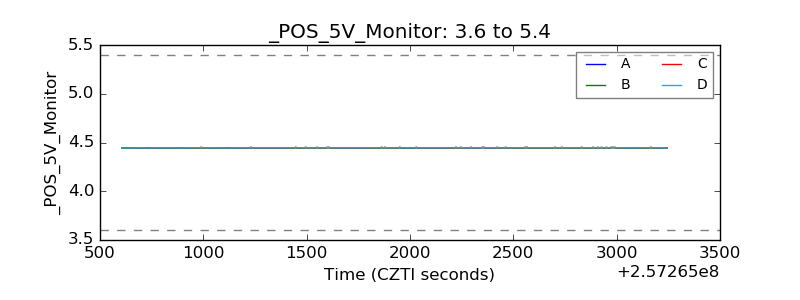 |
| _ROLL_ROT | 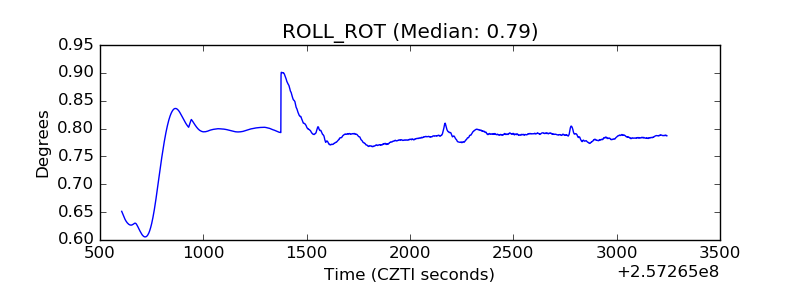 |
| _Roll_DEC |  |
| _Roll_RA | 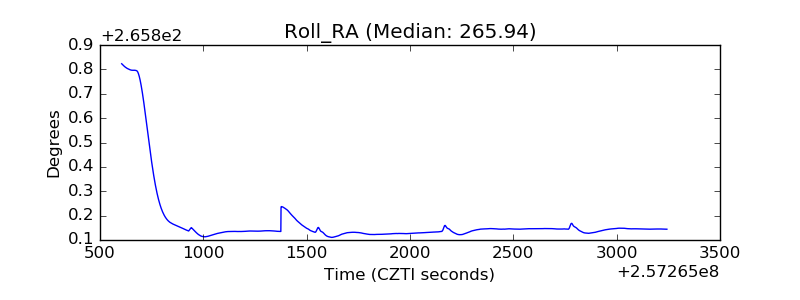 |
| Veto Counter | 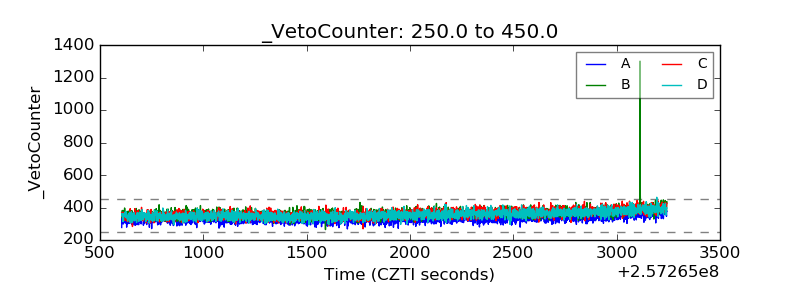 |