| Param | Original file | Final file |
|---|---|---|
| Filename | modeM0/AS1G08_045T01_9000001920_13049cztM0_level2.evt | modeM0/AS1G08_045T01_9000001920_13049cztM0_level2_quad_clean.evt |
| Size (bytes) | 1,166,382,720 | 163,463,040 |
| Size | 1.1 GB | 155.9 MB |
| Events in quadrant A | 7,625,501 | 1,025,468 |
| Events in quadrant B | 11,434,812 | 975,386 |
| Events in quadrant C | 6,244,868 | 1,034,572 |
| Events in quadrant D | 9,098,323 | 973,434 |
| Mode SS | |||
|---|---|---|---|
| Quadrant | BADHDUFLAG | Total packets | Discarded packets |
| A | 0 | 276 | 0 |
| B | 0 | 276 | 0 |
| C | 0 | 276 | 0 |
| D | 0 | 276 | 0 |
| Mode M0 | |||
|---|---|---|---|
| Quadrant | BADHDUFLAG | Total packets | Discarded packets |
| A | 0 | 31325 | 4 |
| B | 0 | 42806 | 3 |
| C | 0 | 27889 | 3 |
| D | 0 | 36228 | 3 |
| Mode M9 | |||
|---|---|---|---|
| Quadrant | BADHDUFLAG | Total packets | Discarded packets |
| A | 0 | 18 | 0 |
| B | 0 | 18 | 0 |
| C | 0 | 18 | 0 |
| D | 0 | 18 | 0 |
| Quadrant | Total seconds | Saturated seconds | Saturation percentage |
|---|---|---|---|
| A | 13636 | 279 | 2.046055% |
| B | 13636 | 2142 | 15.708419% |
| C | 13636 | 129 | 0.946025% |
| D | 13636 | 748 | 5.485480% |
Noise dominated data is calculated using 1-second bins in cleaned event files. If a bin has >2000 counts, and if more than 50% of those come from <1% of pixels, then it is considered to be noise-dominated and hence unusable.
| Quadrant | # 1 sec bins | Bins with >0 counts | Bins with >2000 counts | High rate bins dominated by noise | Noise dominated (total time) | Noise dominated (detector-on time) | Marked lightcurve |
|---|---|---|---|---|---|---|---|
| A | 15352 | 13640 | 44 | 44 | 0.29% | 0.32% | 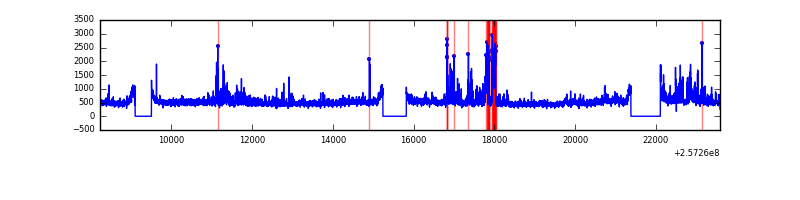 |
| B | 15352 | 13639 | 1129 | 1129 | 7.35% | 8.28% | 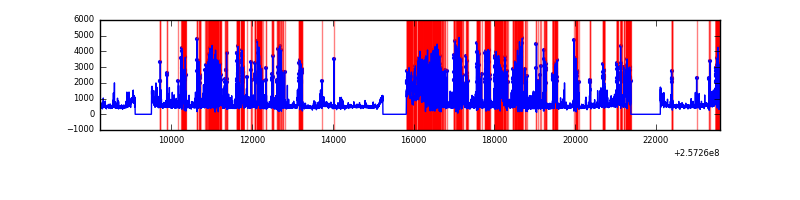 |
| C | 15352 | 13640 | 0 | 0 | 0.00% | 0.00% | 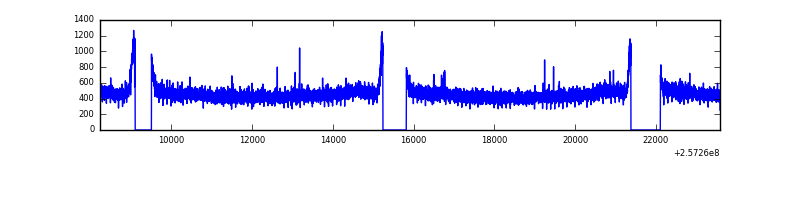 |
| D | 15352 | 13640 | 471 | 471 | 3.07% | 3.45% | 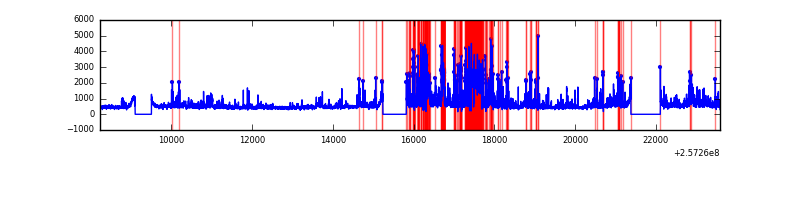 |
Top three noisy pixels from each quadrant. If the there are fewer than three noisy pixels in the level2.evt file, extra rows are filled as -1
| Pixel properties | Quadrant properties | ||||||
|---|---|---|---|---|---|---|---|
| Quadrant | DetID | PixID | Counts | Sigma | Mean | Median | Sigma |
| A | 8 | 15 | 866053 | 2589.41 | 1628 | 1592 | 333.8 |
| A | 12 | 189 | 215646 | 641.18 | 1628 | 1592 | 333.8 |
| A | 1 | 162 | 129973 | 384.55 | 1628 | 1592 | 333.8 |
| B | 4 | 239 | 3782022 | 13145.82 | 1500 | 1460 | 287.6 |
| B | 0 | 85 | 1041803 | 3617.49 | 1500 | 1460 | 287.6 |
| B | 3 | 64 | 384191 | 1330.84 | 1500 | 1460 | 287.6 |
| C | 8 | 128 | 14277 | 34.29 | 1592 | 1600 | 369.7 |
| C | 13 | 61 | 11831 | 27.67 | 1592 | 1600 | 369.7 |
| C | 8 | 112 | 8474 | 18.59 | 1592 | 1600 | 369.7 |
| D | 1 | 52 | 2534509 | 6760.58 | 1545 | 1499 | 374.7 |
| D | 8 | 195 | 432263 | 1149.7 | 1545 | 1499 | 374.7 |
| D | 10 | 157 | 175719 | 464.99 | 1545 | 1499 | 374.7 |
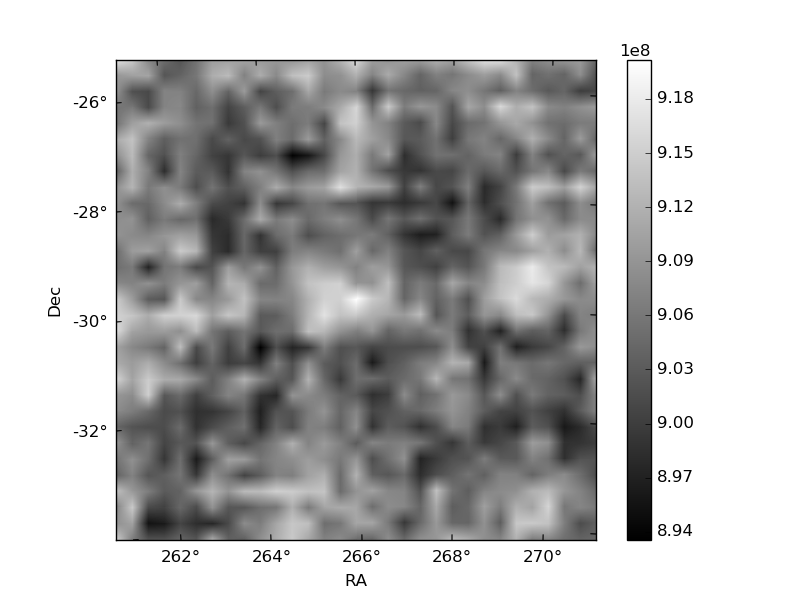
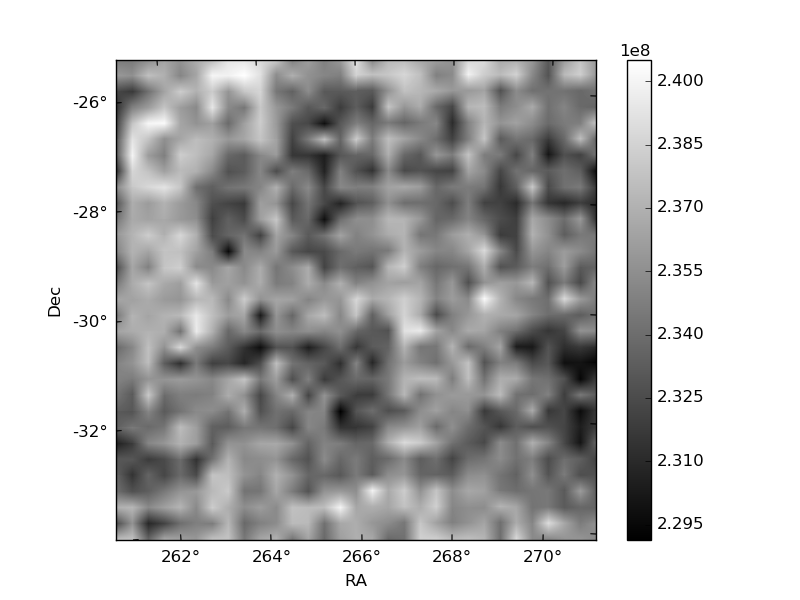
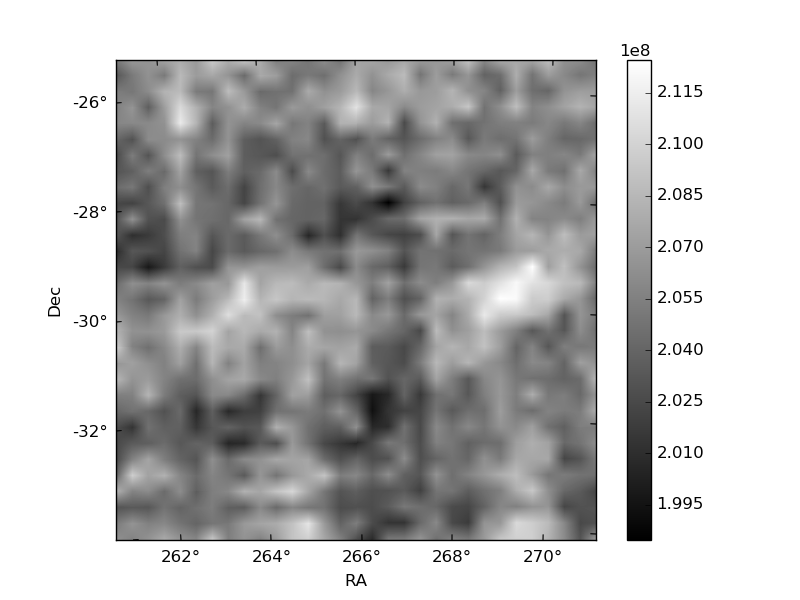
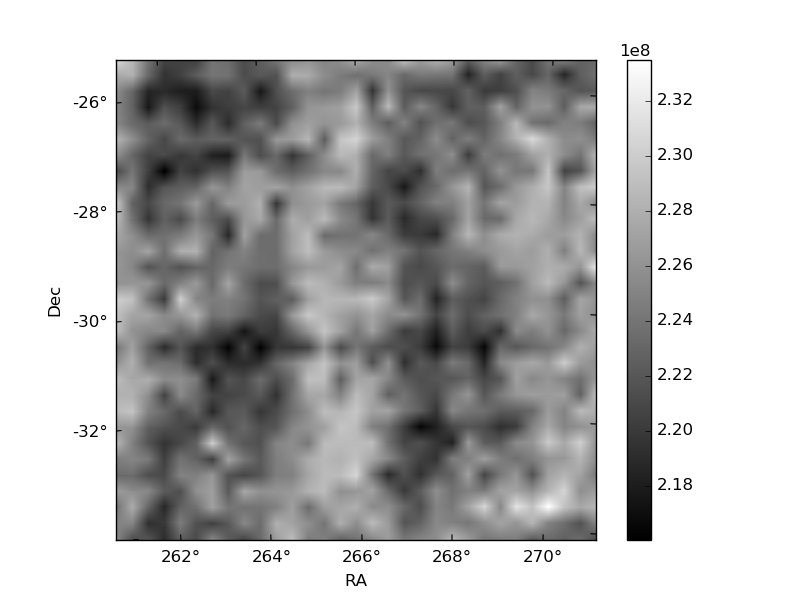
Histogram calculated using DETX and DETY for each event in the final _common_clean file
| Quadrant A | 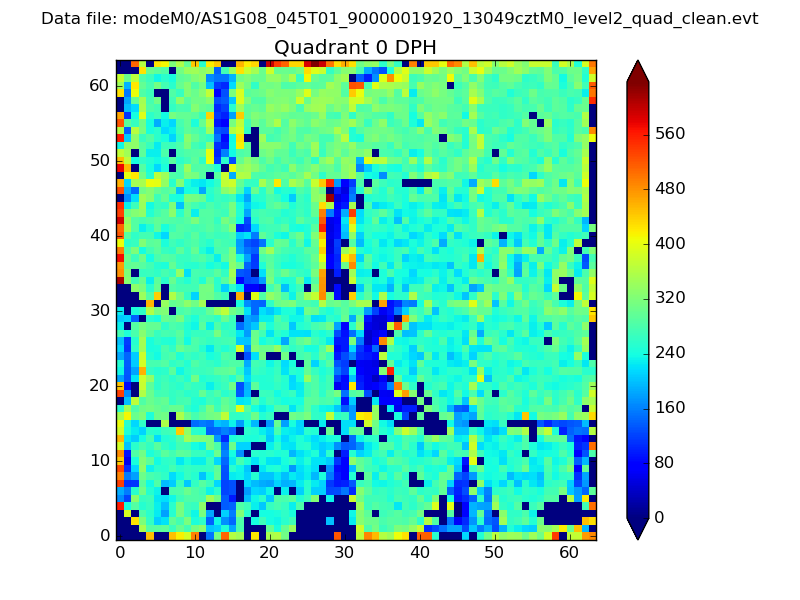 |
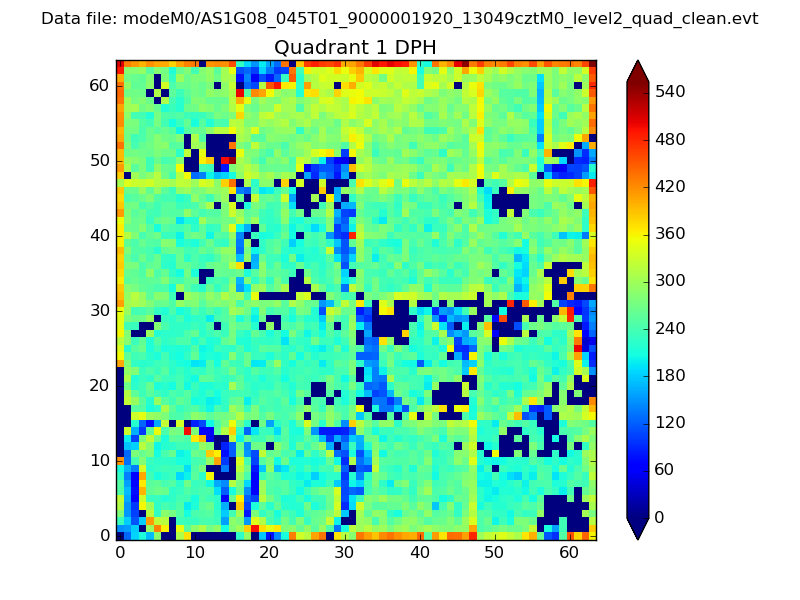 |
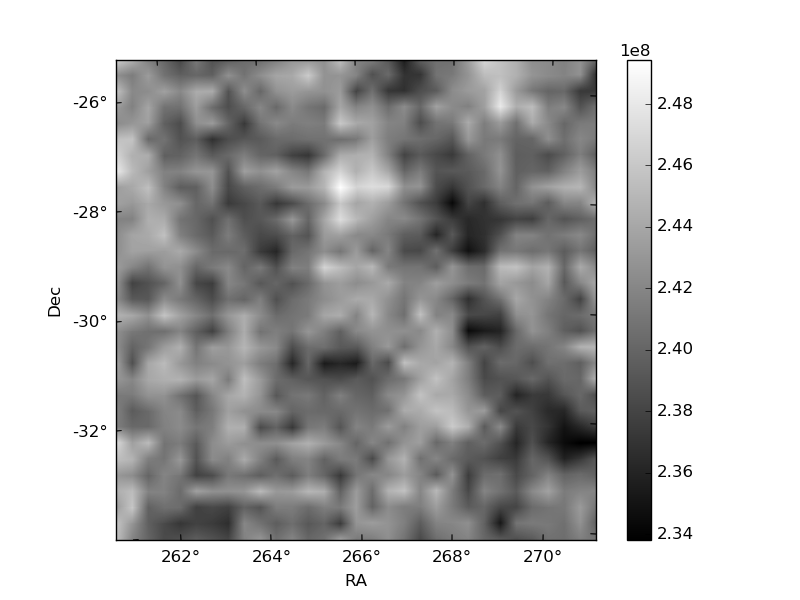
Quadrant B |
|---|---|---|---|
| Quadrant D | 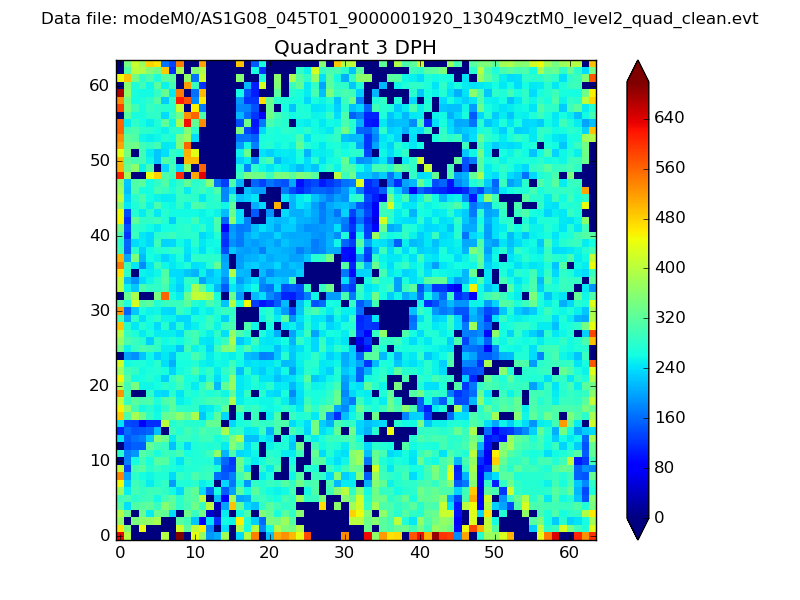 |
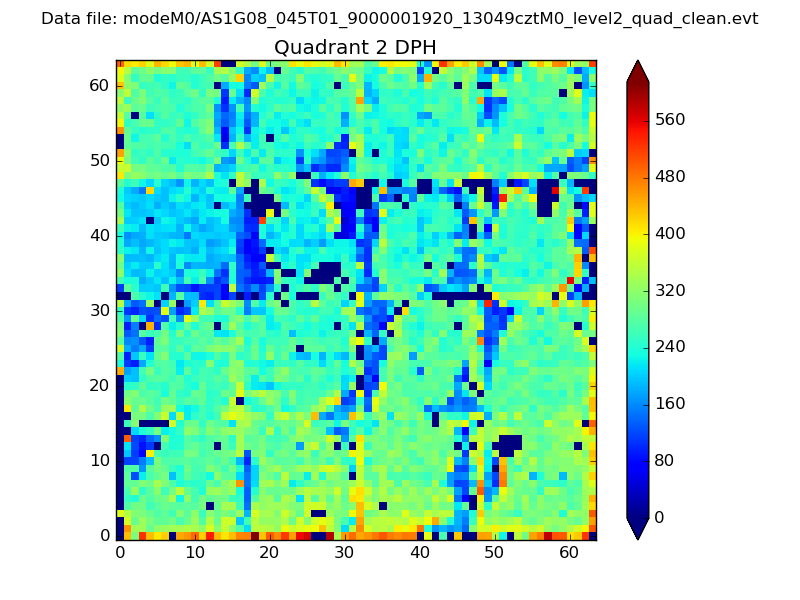 |
Quadrant C |
| Plot type | Count rate plots | Images |
|---|---|---|
| Comparison with Poisson distribution Blue bars denote a histogram of data divided into 1 sec bins. Red curve is a Poisson curve with rate = median count rate of data. |
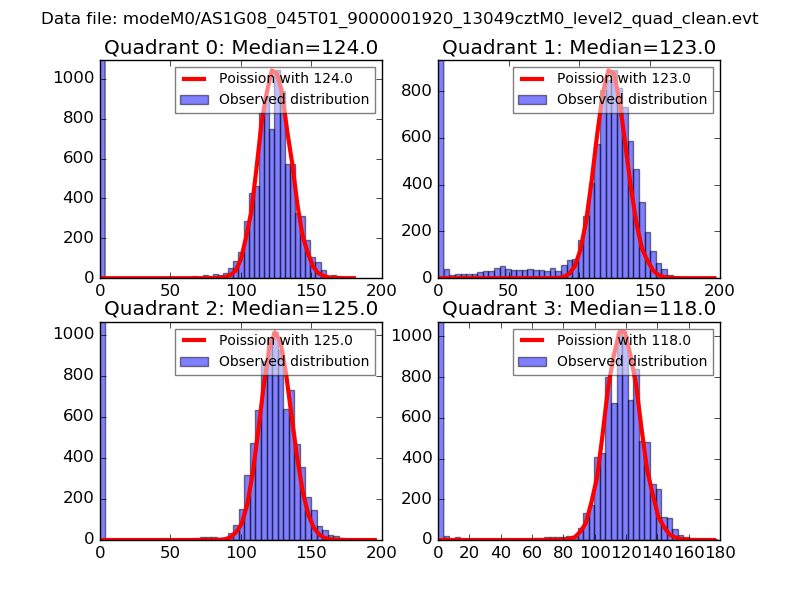 |
 |
| Quadrant-wise count rates Data is divided into 100 sec bins |
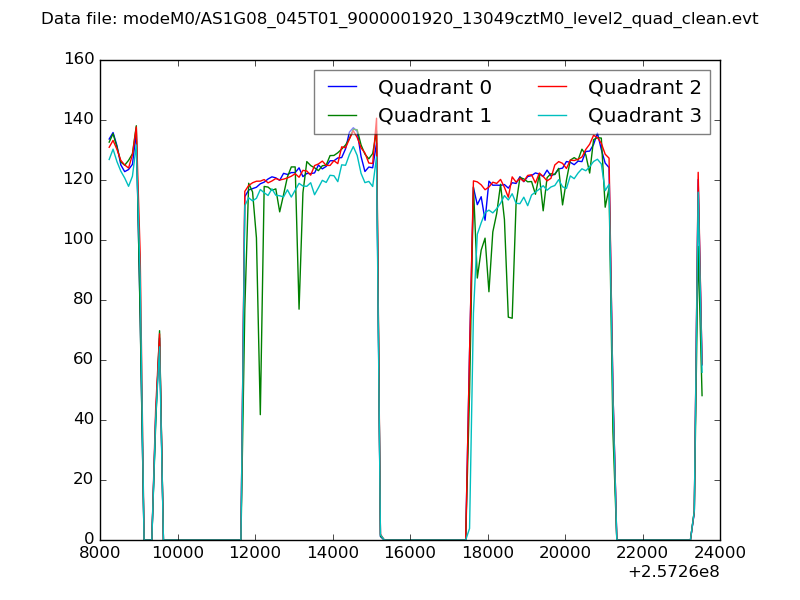 |
|
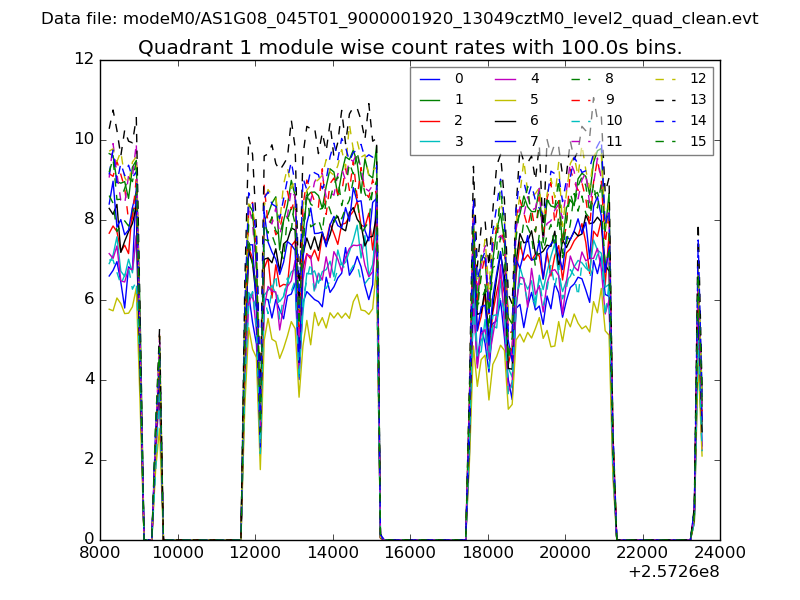
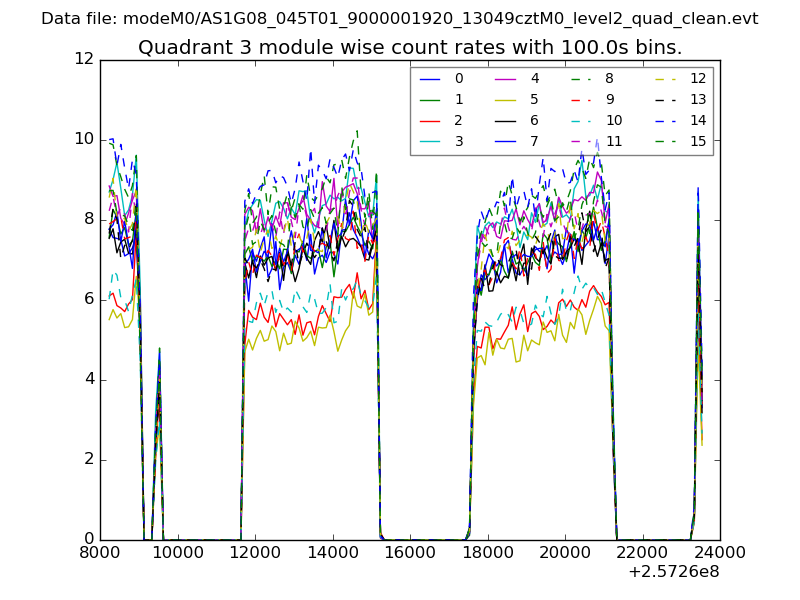
| Module-wise count rates for Quadrant A Data is divided into 100 sec bins |
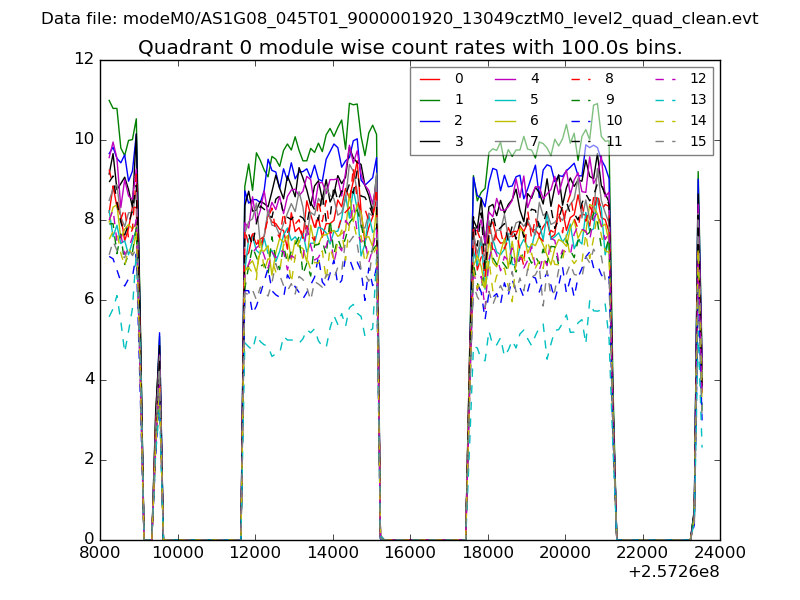 |
 |
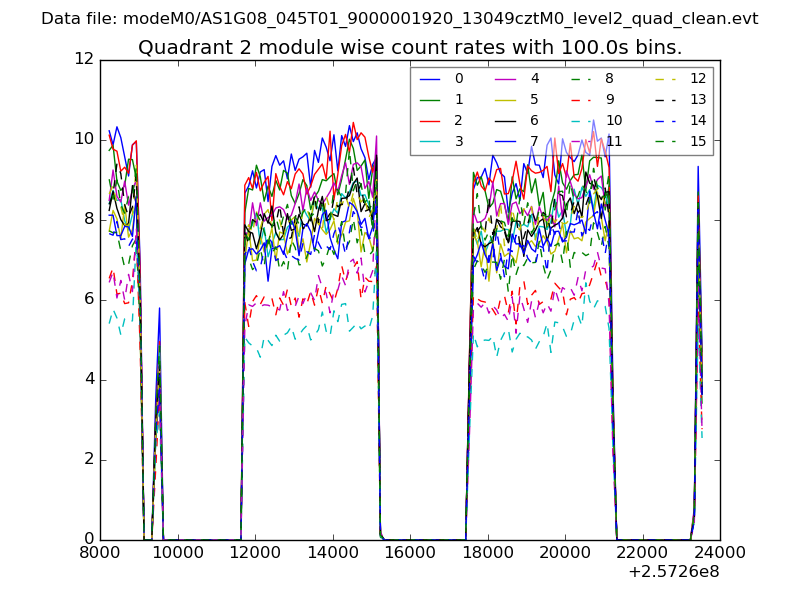
| Module-wise count rates for Quadrant B Data is divided into 100 sec bins |
 |
 |
| Module-wise count rates for Quadrant C Data is divided into 100 sec bins |
 |
 |
| Module-wise count rates for Quadrant D Data is divided into 100 sec bins |
 |
 |
| Parameter | Plot |
|---|---|
| CZT HV Monitor | 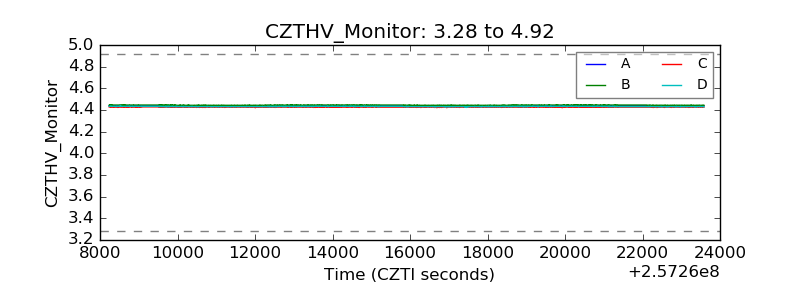 |
| D_VDD | 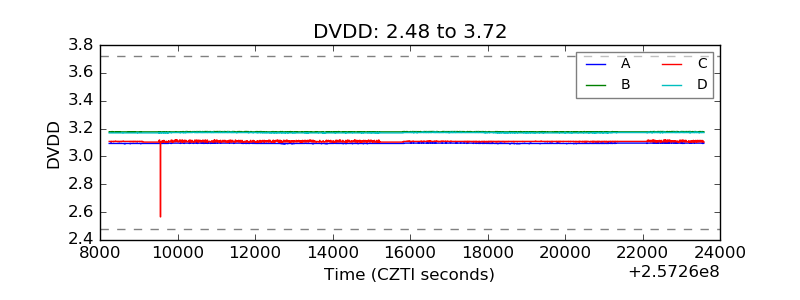 |
| Temperature 1 | 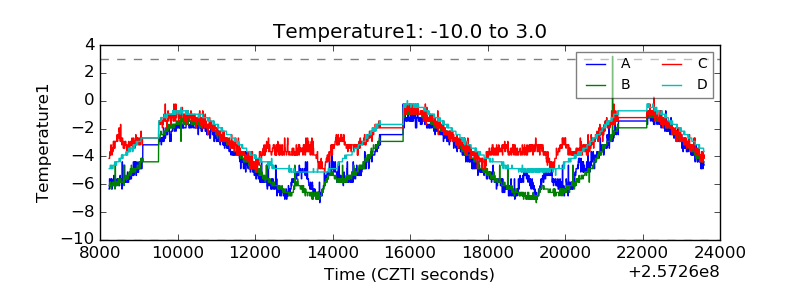 |
| Veto HV Monitor | 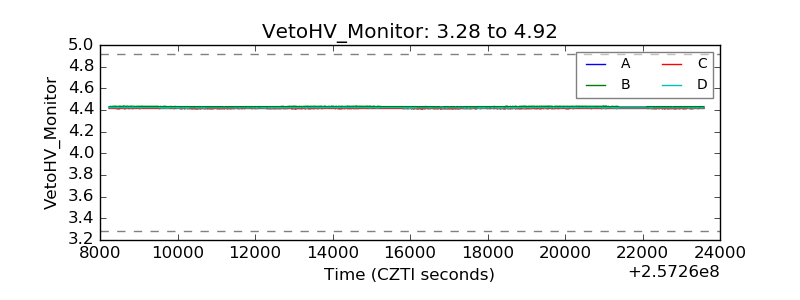 |
| Veto LLD | 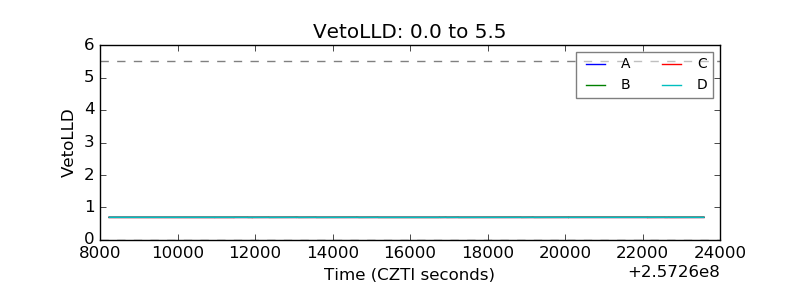 |
| Alpha Counter | 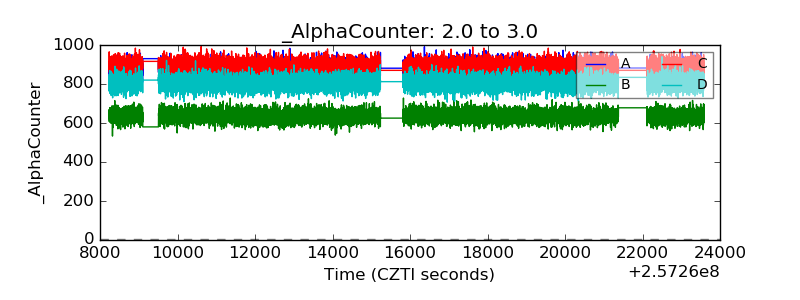 |
| _CPM_Rate | 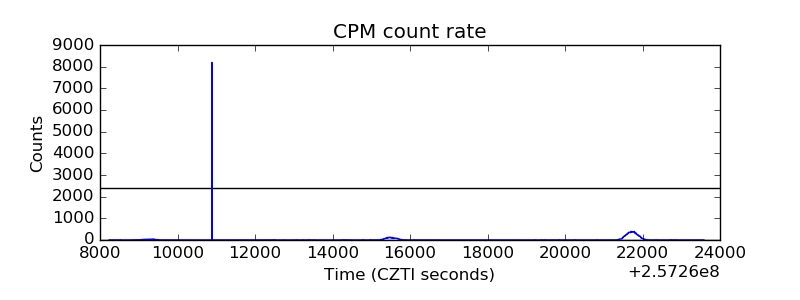 |
| CZT Counter | 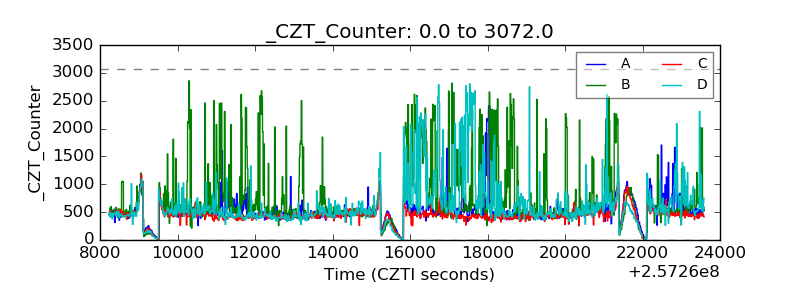 |
| +2.5 Volts monitor |  |
| +5 Volts monitor |  |
| _ROLL_ROT |  |
| _Roll_DEC | 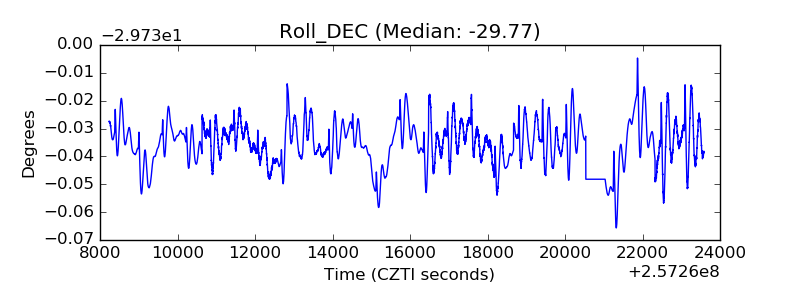 |
| _Roll_RA | 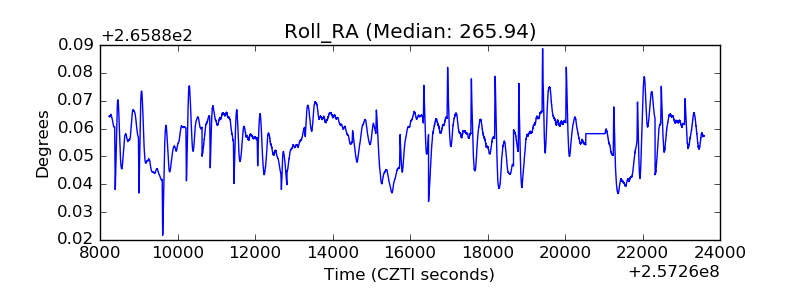 |
| Veto Counter | 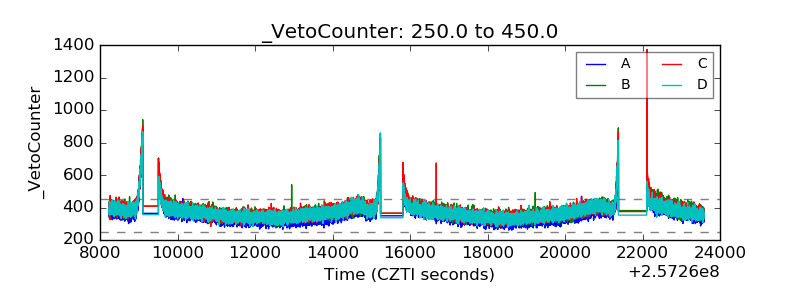 |