| Param | Original file | Final file |
|---|---|---|
| Filename | modeM0/AS1G08_045T01_9000001920_13051cztM0_level2.evt | modeM0/AS1G08_045T01_9000001920_13051cztM0_level2_quad_clean.evt |
| Size (bytes) | 512,461,440 | 91,370,880 |
| Size | 488.7 MB | 87.1 MB |
| Events in quadrant A | 3,425,374 | 582,310 |
| Events in quadrant B | 4,384,520 | 585,074 |
| Events in quadrant C | 3,049,973 | 587,985 |
| Events in quadrant D | 4,212,088 | 551,139 |
| Mode SS | |||
|---|---|---|---|
| Quadrant | BADHDUFLAG | Total packets | Discarded packets |
| A | 0 | 132 | 0 |
| B | 0 | 132 | 0 |
| C | 0 | 132 | 0 |
| D | 0 | 132 | 0 |
| Mode M0 | |||
|---|---|---|---|
| Quadrant | BADHDUFLAG | Total packets | Discarded packets |
| A | 0 | 14669 | 3 |
| B | 0 | 17612 | 2 |
| C | 0 | 13437 | 2 |
| D | 0 | 16968 | 2 |
| Mode M9 | |||
|---|---|---|---|
| Quadrant | BADHDUFLAG | Total packets | Discarded packets |
| A | 0 | 19 | 0 |
| B | 0 | 19 | 0 |
| C | 0 | 19 | 0 |
| D | 0 | 19 | 0 |
| Quadrant | Total seconds | Saturated seconds | Saturation percentage |
|---|---|---|---|
| A | 6612 | 72 | 1.088929% |
| B | 6612 | 212 | 3.206292% |
| C | 6612 | 17 | 0.257108% |
| D | 6612 | 108 | 1.633394% |
Noise dominated data is calculated using 1-second bins in cleaned event files. If a bin has >2000 counts, and if more than 50% of those come from <1% of pixels, then it is considered to be noise-dominated and hence unusable.
| Quadrant | # 1 sec bins | Bins with >0 counts | Bins with >2000 counts | High rate bins dominated by noise | Noise dominated (total time) | Noise dominated (detector-on time) | Marked lightcurve |
|---|---|---|---|---|---|---|---|
| A | 7668 | 6614 | 19 | 19 | 0.25% | 0.29% | 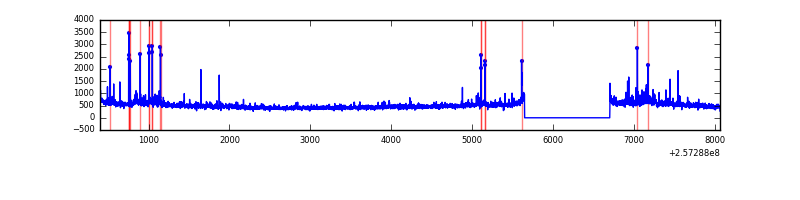 |
| B | 7668 | 6614 | 88 | 88 | 1.15% | 1.33% | 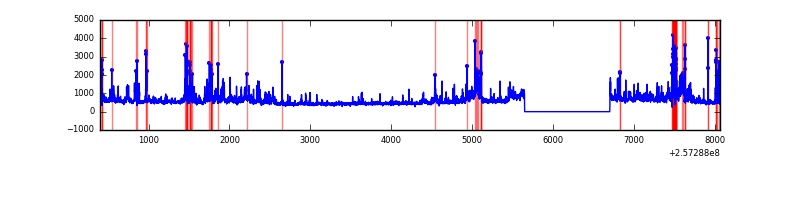 |
| C | 7668 | 6614 | 0 | 0 | 0.00% | 0.00% | 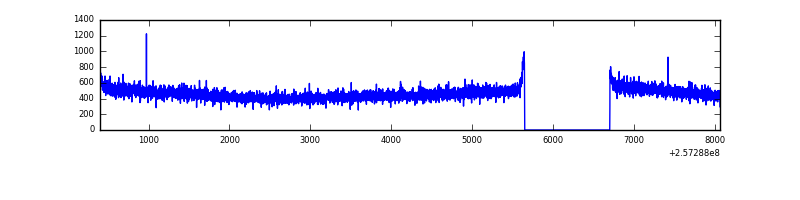 |
| D | 7668 | 6614 | 72 | 72 | 0.94% | 1.09% | 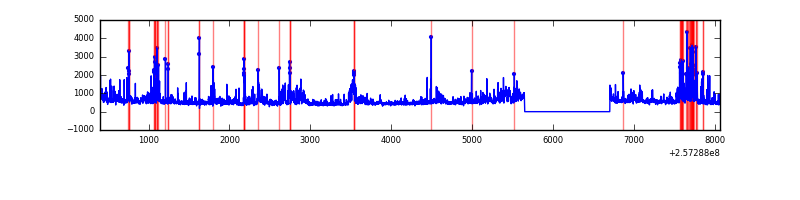 |
Top three noisy pixels from each quadrant. If the there are fewer than three noisy pixels in the level2.evt file, extra rows are filled as -1
| Pixel properties | Quadrant properties | ||||||
|---|---|---|---|---|---|---|---|
| Quadrant | DetID | PixID | Counts | Sigma | Mean | Median | Sigma |
| A | 8 | 15 | 213228 | 1308.17 | 795 | 777 | 162.4 |
| A | 12 | 189 | 91404 | 558.04 | 795 | 777 | 162.4 |
| A | 9 | 143 | 17626 | 103.75 | 795 | 777 | 162.4 |
| B | 0 | 85 | 692318 | 4570.1 | 798 | 779 | 151.3 |
| B | 0 | 219 | 163070 | 1072.51 | 798 | 779 | 151.3 |
| B | 3 | 64 | 153764 | 1011.01 | 798 | 779 | 151.3 |
| C | 13 | 61 | 5740 | 27.38 | 779 | 785 | 181.0 |
| C | 0 | 207 | 5560 | 26.38 | 779 | 785 | 181.0 |
| C | 8 | 222 | 2526 | 9.62 | 779 | 785 | 181.0 |
| D | 1 | 52 | 914826 | 4959.3 | 767 | 750 | 184.3 |
| D | 8 | 195 | 175471 | 947.94 | 767 | 750 | 184.3 |
| D | 14 | 34 | 154763 | 835.59 | 767 | 750 | 184.3 |
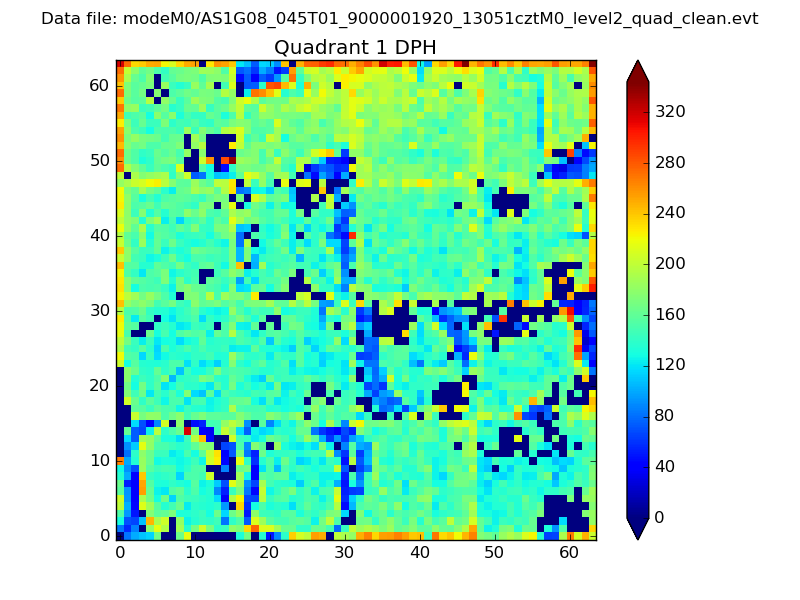
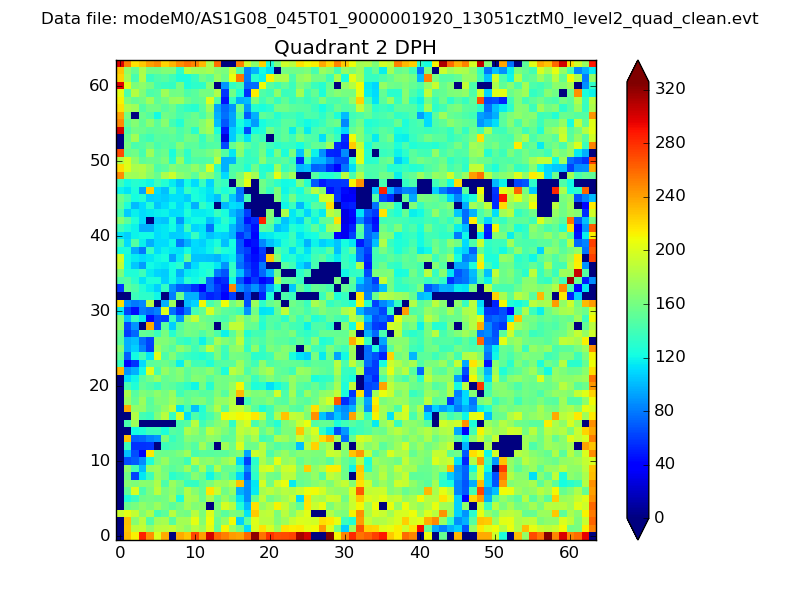
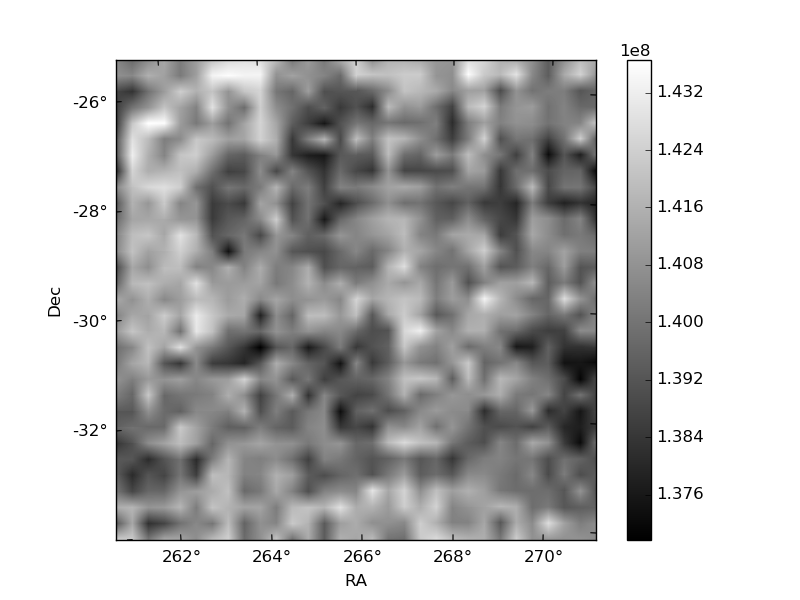
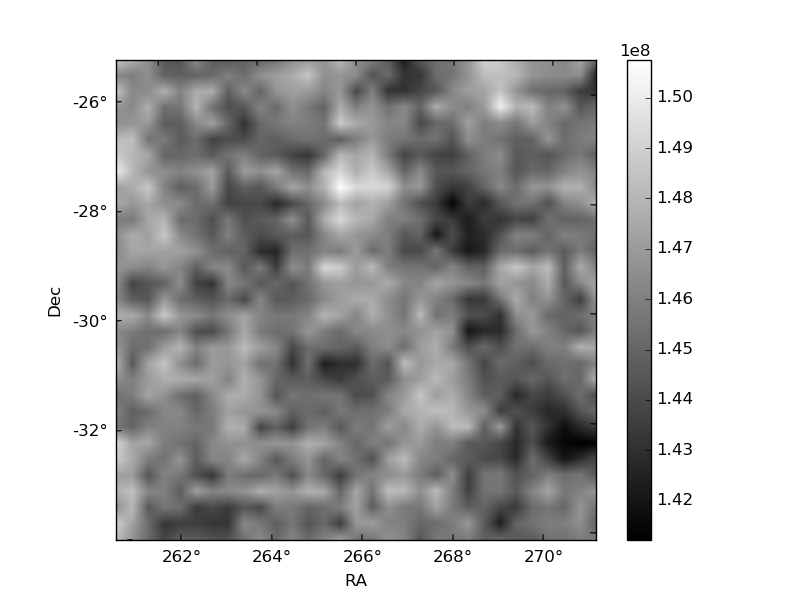
Histogram calculated using DETX and DETY for each event in the final _common_clean file
| Quadrant A |  |
 |
Quadrant B |
|---|---|---|---|
| Quadrant D |  |
 |
Quadrant C |
| Plot type | Count rate plots | Images |
|---|---|---|
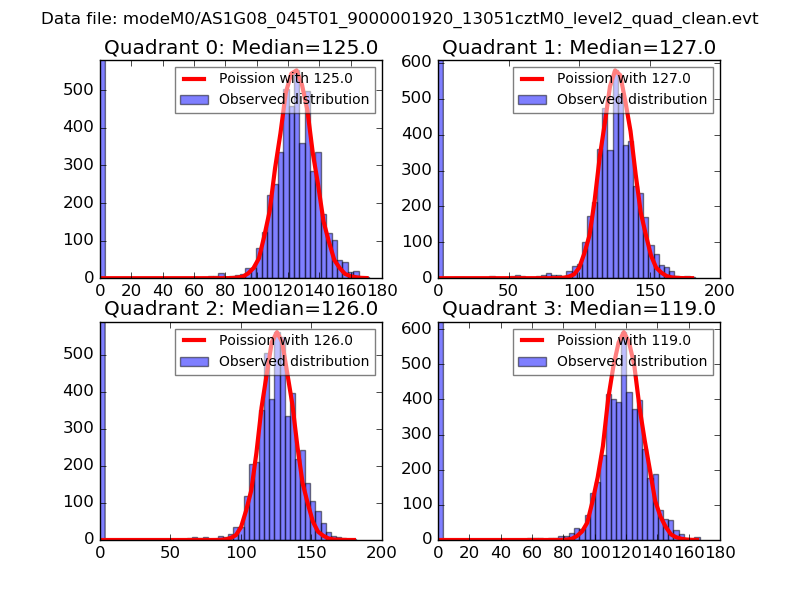
| Comparison with Poisson distribution Blue bars denote a histogram of data divided into 1 sec bins. Red curve is a Poisson curve with rate = median count rate of data. |
 |
 |
| Quadrant-wise count rates Data is divided into 100 sec bins |
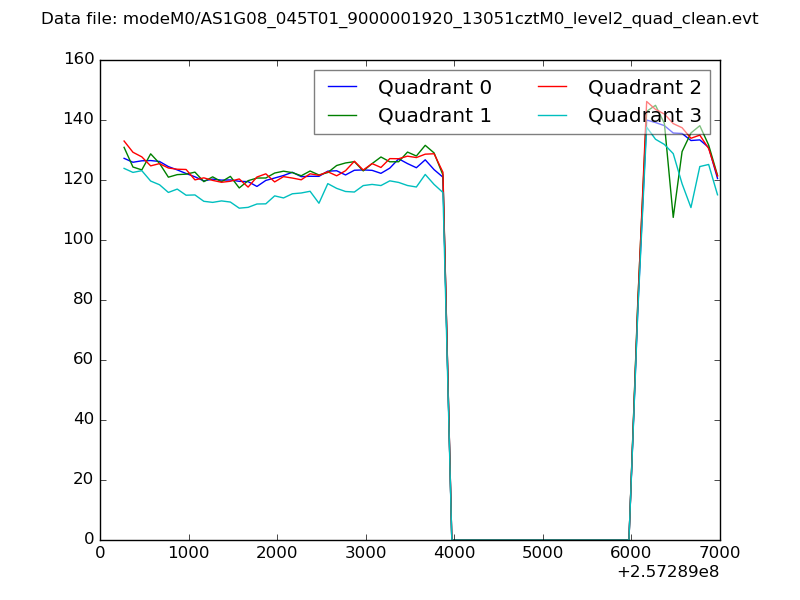 |
|
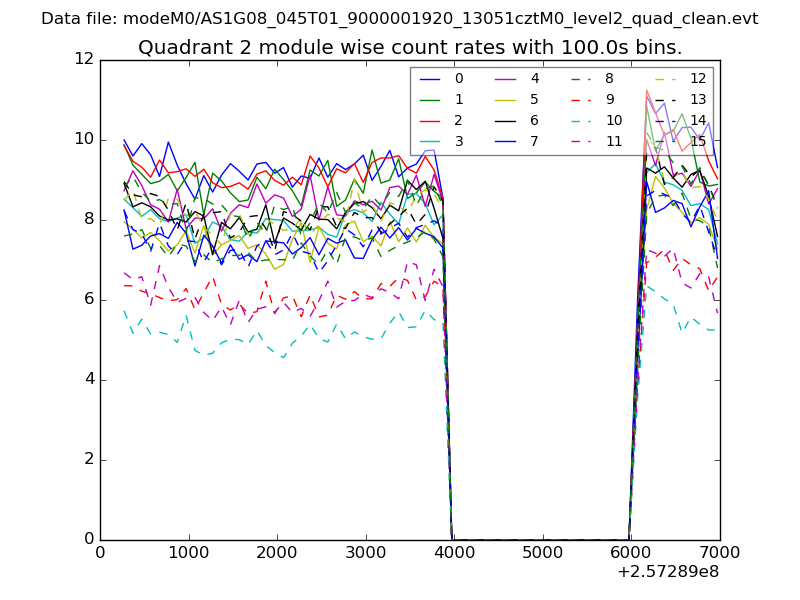
| Module-wise count rates for Quadrant A Data is divided into 100 sec bins |
 |
 |
| Module-wise count rates for Quadrant B Data is divided into 100 sec bins |
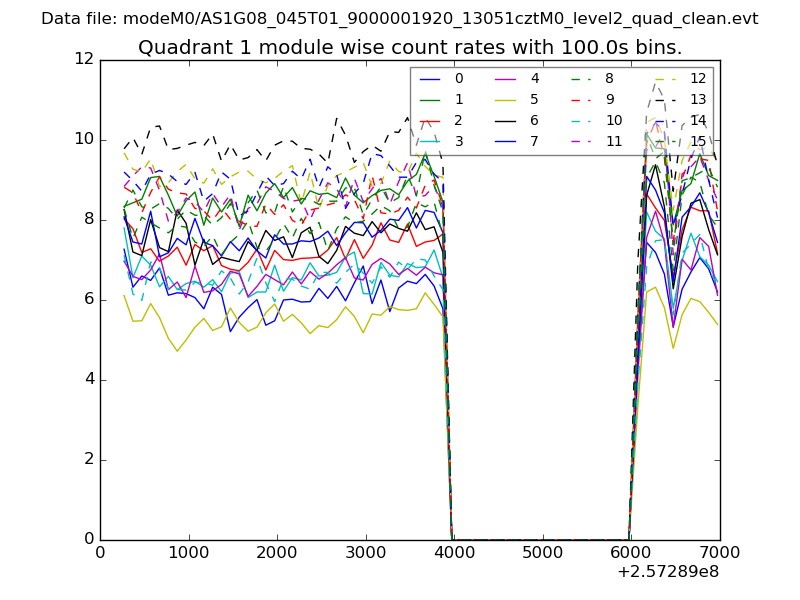 |
 |
| Module-wise count rates for Quadrant C Data is divided into 100 sec bins |
 |
 |
| Module-wise count rates for Quadrant D Data is divided into 100 sec bins |
 |
 |
| Parameter | Plot |
|---|---|
| CZT HV Monitor |  |
| D_VDD | 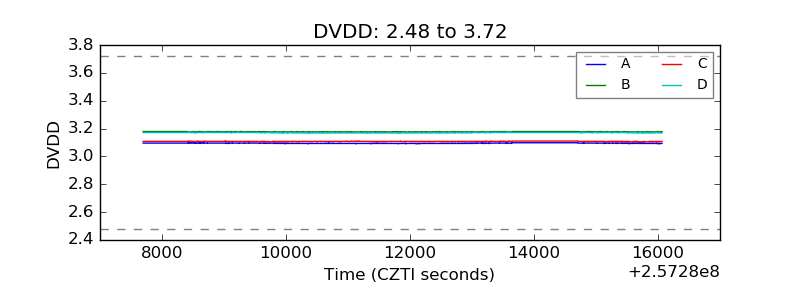 |
| Temperature 1 | 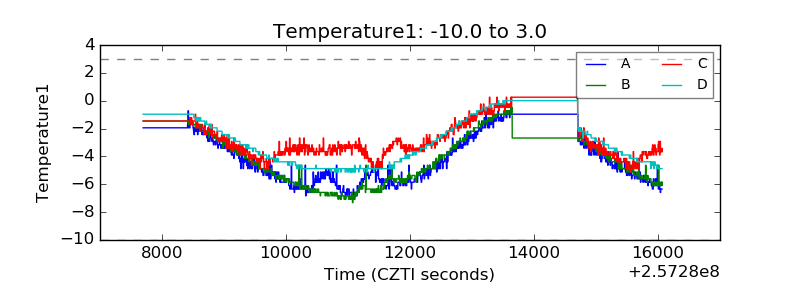 |
| Veto HV Monitor | 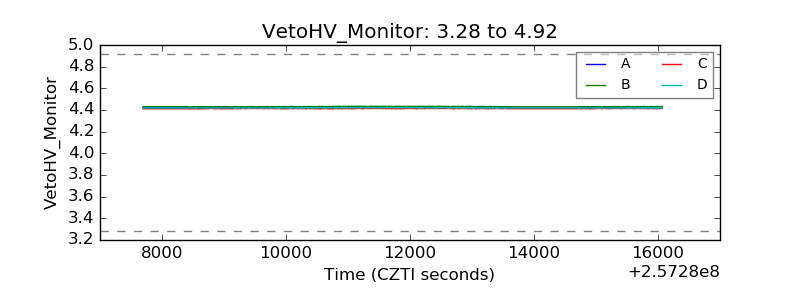 |
| Veto LLD | 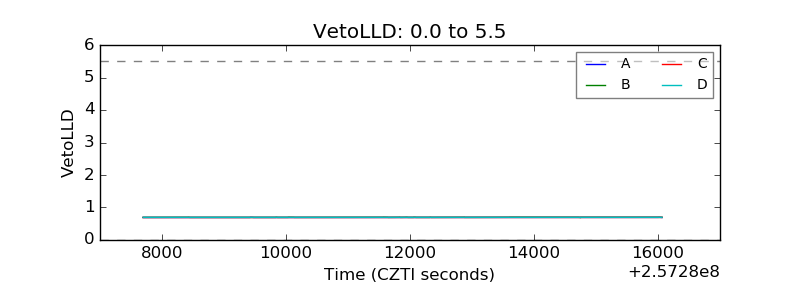 |
| Alpha Counter | 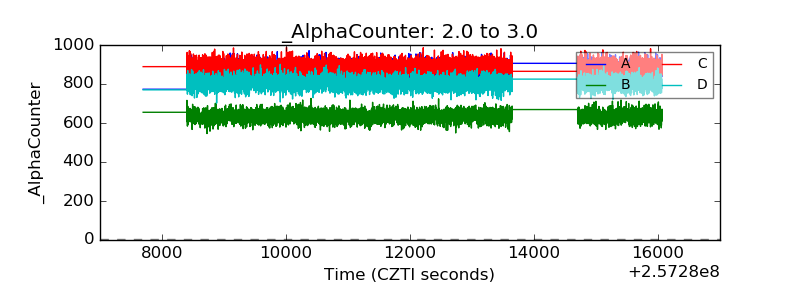 |
| _CPM_Rate | 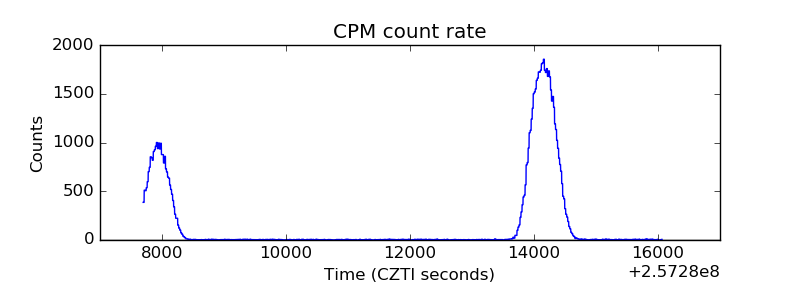 |
| CZT Counter |  |
| +2.5 Volts monitor |  |
| +5 Volts monitor |  |
| _ROLL_ROT | 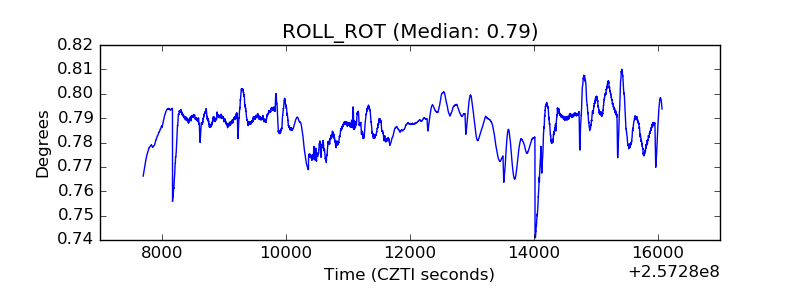 |
| _Roll_DEC | 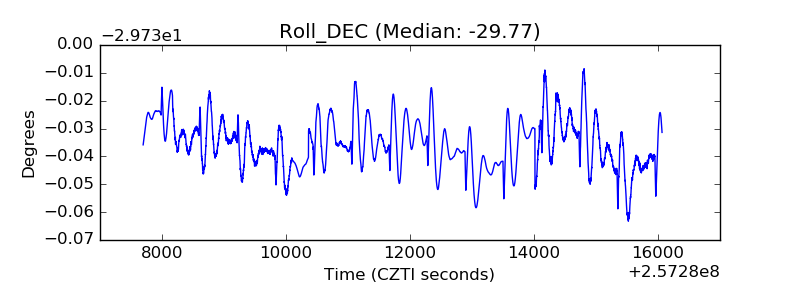 |
| _Roll_RA | 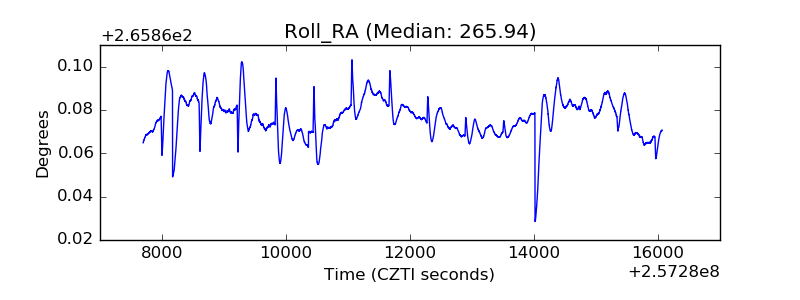 |
| Veto Counter | 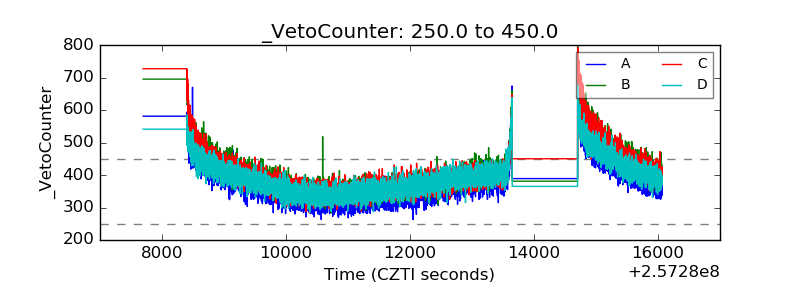 |