| Param | Original file | Final file |
|---|---|---|
| Filename | modeM0/AS1G08_045T01_9000001920_13053cztM0_level2.evt | modeM0/AS1G08_045T01_9000001920_13053cztM0_level2_quad_clean.evt |
| Size (bytes) | 611,343,360 | 99,135,360 |
| Size | 583.0 MB | 94.5 MB |
| Events in quadrant A | 3,354,284 | 669,114 |
| Events in quadrant B | 6,502,132 | 597,227 |
| Events in quadrant C | 3,079,117 | 679,822 |
| Events in quadrant D | 5,143,505 | 607,128 |
| Mode SS | |||
|---|---|---|---|
| Quadrant | BADHDUFLAG | Total packets | Discarded packets |
| A | 0 | 132 | 0 |
| B | 0 | 132 | 0 |
| C | 0 | 132 | 0 |
| D | 0 | 132 | 0 |
| Mode M0 | |||
|---|---|---|---|
| Quadrant | BADHDUFLAG | Total packets | Discarded packets |
| A | 0 | 14140 | 3 |
| B | 0 | 23723 | 2 |
| C | 0 | 13295 | 2 |
| D | 0 | 19575 | 2 |
| Mode M9 | |||
|---|---|---|---|
| Quadrant | BADHDUFLAG | Total packets | Discarded packets |
| A | 0 | 19 | 0 |
| B | 0 | 19 | 0 |
| C | 0 | 19 | 0 |
| D | 0 | 20 | 0 |
| Quadrant | Total seconds | Saturated seconds | Saturation percentage |
|---|---|---|---|
| A | 6425 | 35 | 0.544747% |
| B | 6425 | 1388 | 21.603113% |
| C | 6425 | 20 | 0.311284% |
| D | 6425 | 505 | 7.859922% |
Noise dominated data is calculated using 1-second bins in cleaned event files. If a bin has >2000 counts, and if more than 50% of those come from <1% of pixels, then it is considered to be noise-dominated and hence unusable.
| Quadrant | # 1 sec bins | Bins with >0 counts | Bins with >2000 counts | High rate bins dominated by noise | Noise dominated (total time) | Noise dominated (detector-on time) | Marked lightcurve |
|---|---|---|---|---|---|---|---|
| A | 7596 | 6427 | 3 | 3 | 0.04% | 0.05% | 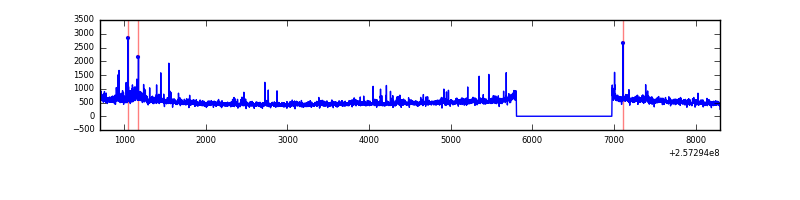 |
| B | 7596 | 6427 | 879 | 879 | 11.57% | 13.68% | 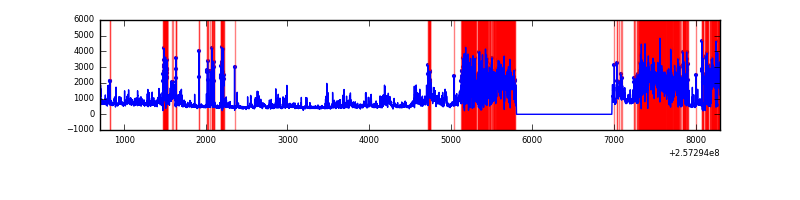 |
| C | 7596 | 6427 | 5 | 5 | 0.07% | 0.08% | 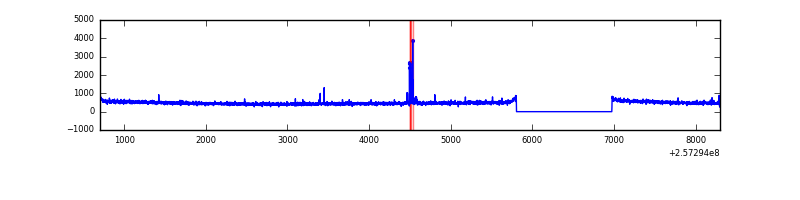 |
| D | 7596 | 6427 | 435 | 435 | 5.73% | 6.77% | 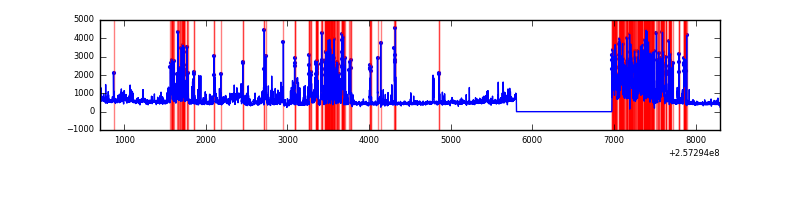 |
Top three noisy pixels from each quadrant. If the there are fewer than three noisy pixels in the level2.evt file, extra rows are filled as -1
| Pixel properties | Quadrant properties | ||||||
|---|---|---|---|---|---|---|---|
| Quadrant | DetID | PixID | Counts | Sigma | Mean | Median | Sigma |
| A | 8 | 15 | 156708 | 980.29 | 788 | 772 | 159.1 |
| A | 12 | 189 | 98256 | 612.83 | 788 | 772 | 159.1 |
| A | 1 | 162 | 19006 | 114.63 | 788 | 772 | 159.1 |
| B | 4 | 239 | 2088207 | 16280.77 | 683 | 668 | 128.2 |
| B | 0 | 85 | 1460442 | 11384.82 | 683 | 668 | 128.2 |
| B | 3 | 64 | 145579 | 1130.16 | 683 | 668 | 128.2 |
| C | 14 | 234 | 37640 | 204.11 | 777 | 782 | 180.6 |
| C | 12 | 4 | 6884 | 33.79 | 777 | 782 | 180.6 |
| C | 13 | 61 | 5737 | 27.44 | 777 | 782 | 180.6 |
| D | 1 | 52 | 1142651 | 6345.74 | 744 | 724 | 180.0 |
| D | 14 | 34 | 992453 | 5511.08 | 744 | 724 | 180.0 |
| D | 8 | 195 | 139985 | 773.88 | 744 | 724 | 180.0 |
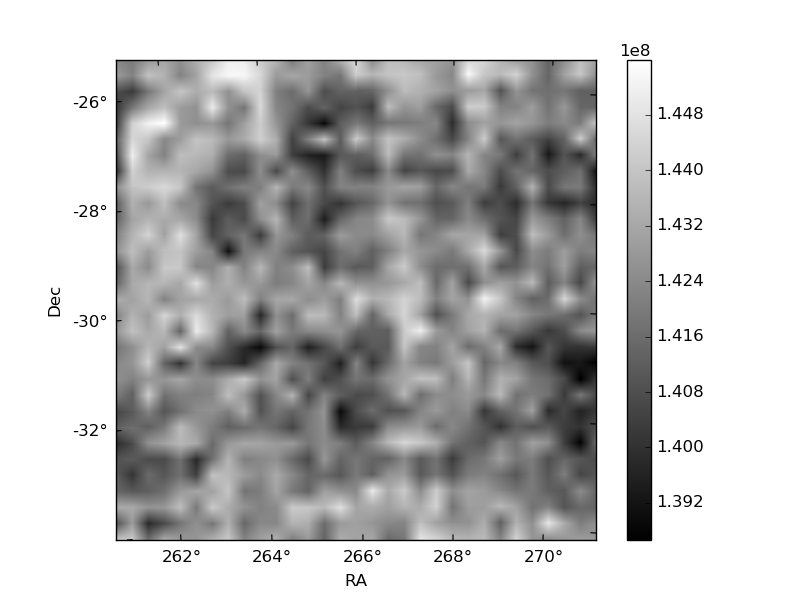
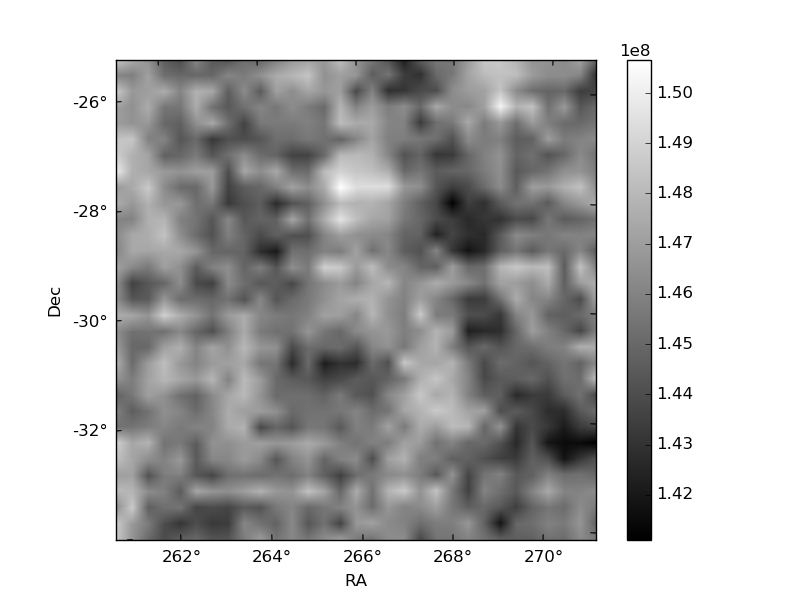
Histogram calculated using DETX and DETY for each event in the final _common_clean file
| Quadrant A |  |
 |
Quadrant B |
|---|---|---|---|
| Quadrant D |  |
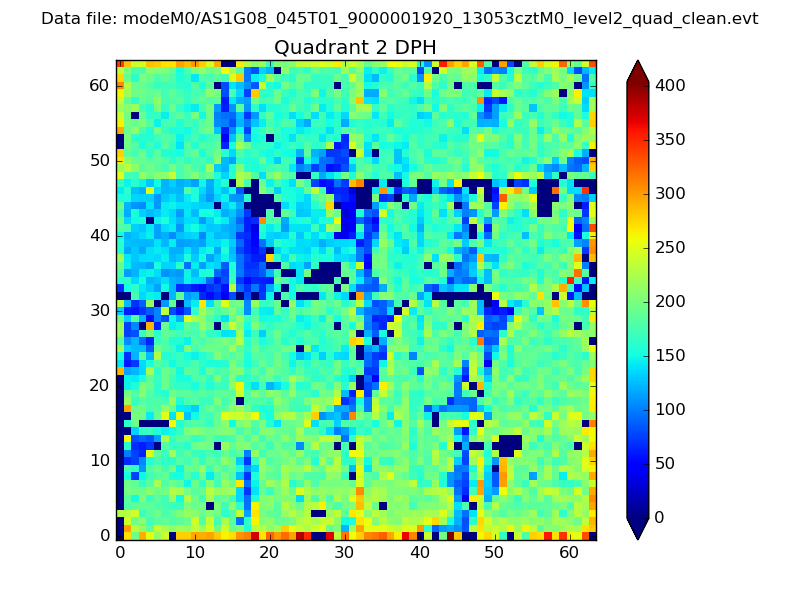 |
Quadrant C |
| Plot type | Count rate plots | Images |
|---|---|---|
| Comparison with Poisson distribution Blue bars denote a histogram of data divided into 1 sec bins. Red curve is a Poisson curve with rate = median count rate of data. |
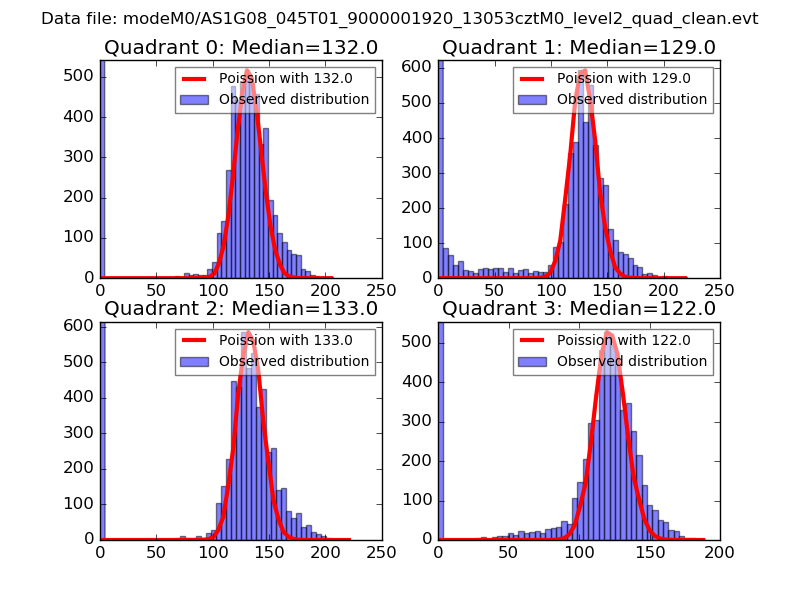 |
 |
| Quadrant-wise count rates Data is divided into 100 sec bins |
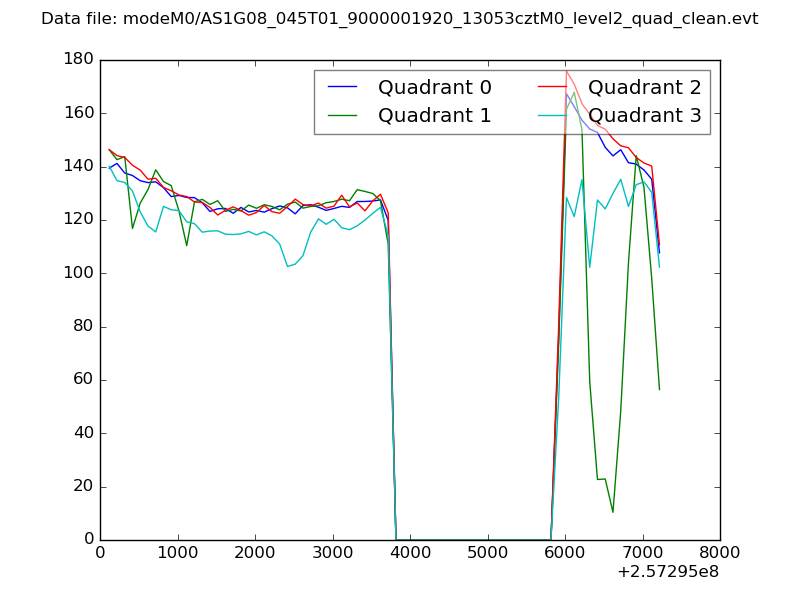 |
|
| Module-wise count rates for Quadrant A Data is divided into 100 sec bins |
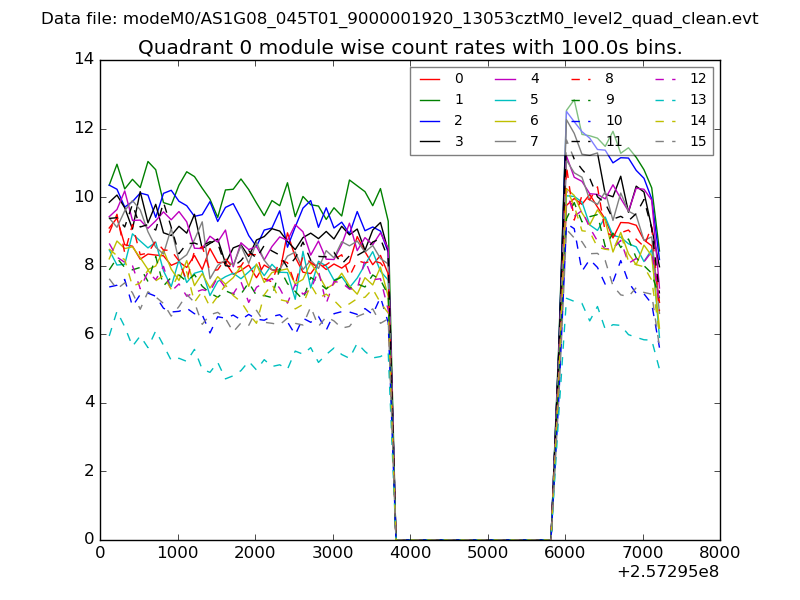 |
 |
| Module-wise count rates for Quadrant B Data is divided into 100 sec bins |
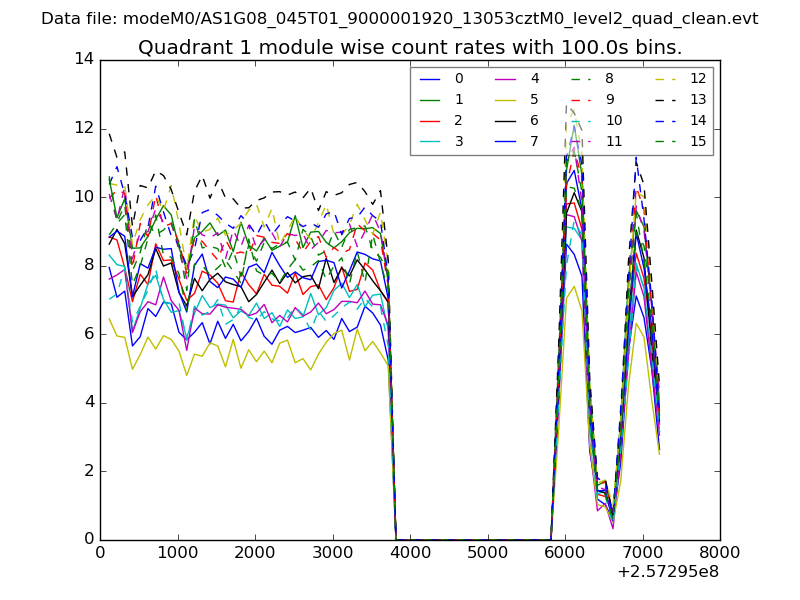 |
 |
| Module-wise count rates for Quadrant C Data is divided into 100 sec bins |
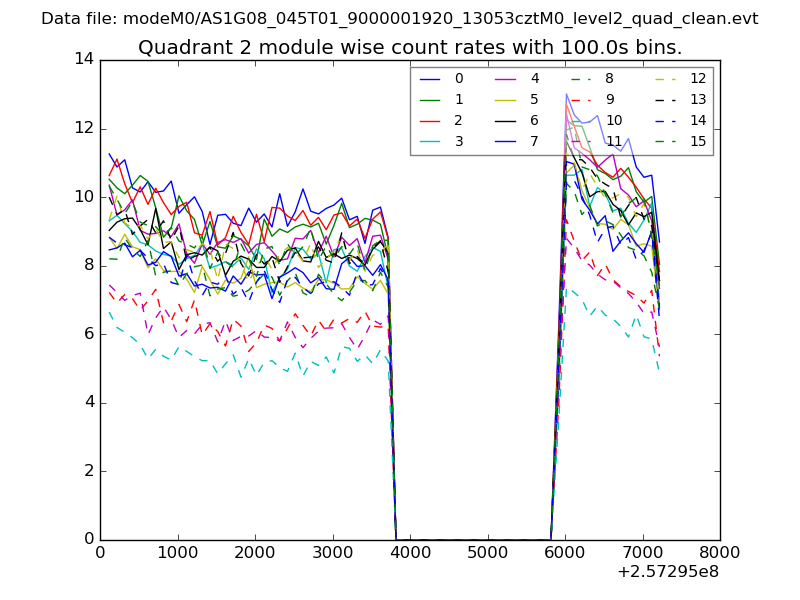 |
 |
| Module-wise count rates for Quadrant D Data is divided into 100 sec bins |
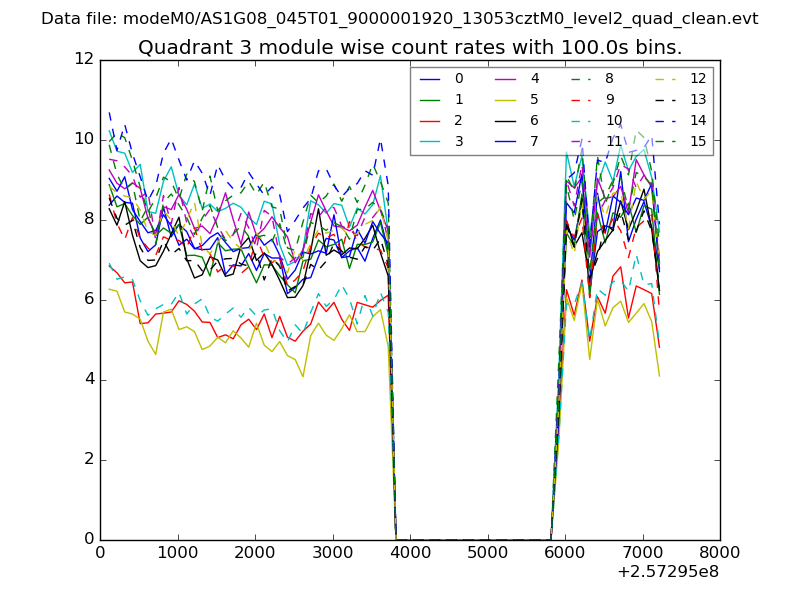 |
 |
| Parameter | Plot |
|---|---|
| CZT HV Monitor | 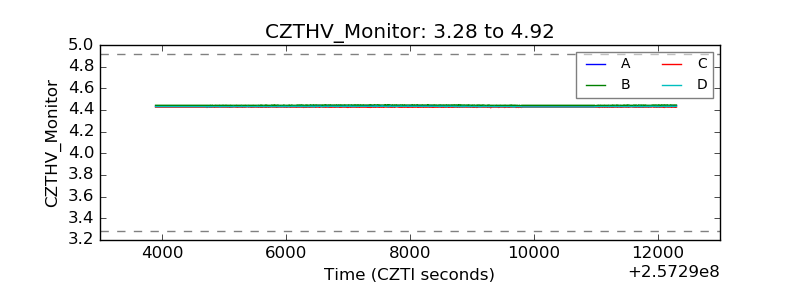 |
| D_VDD | 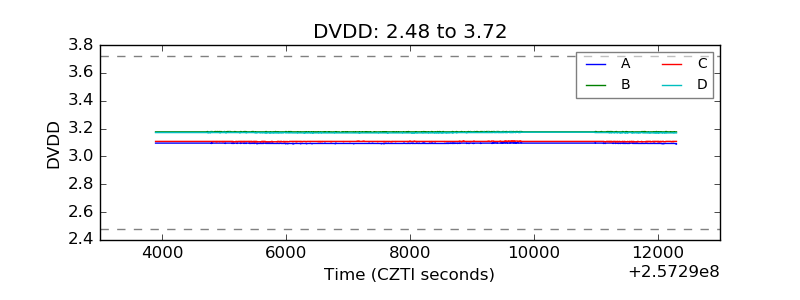 |
| Temperature 1 | 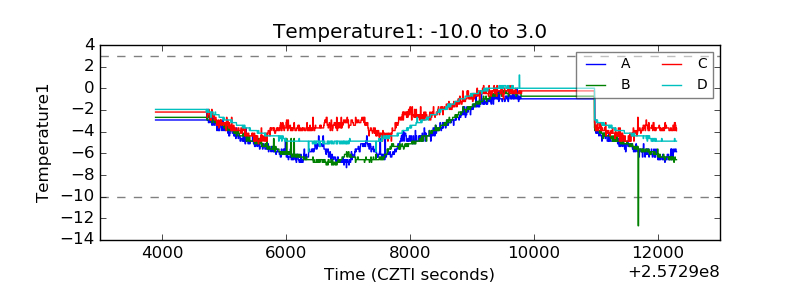 |
| Veto HV Monitor | 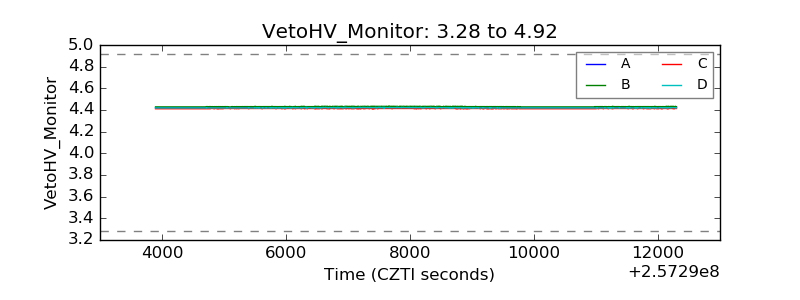 |
| Veto LLD | 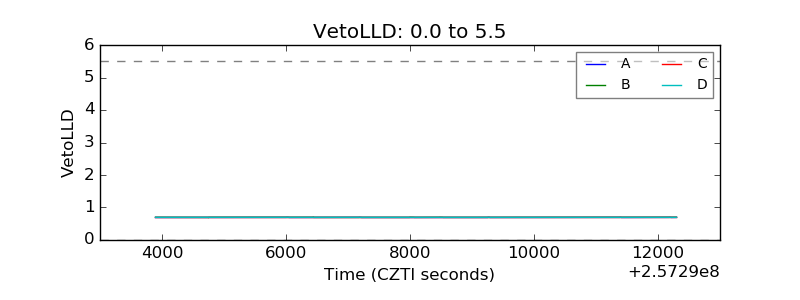 |
| Alpha Counter | 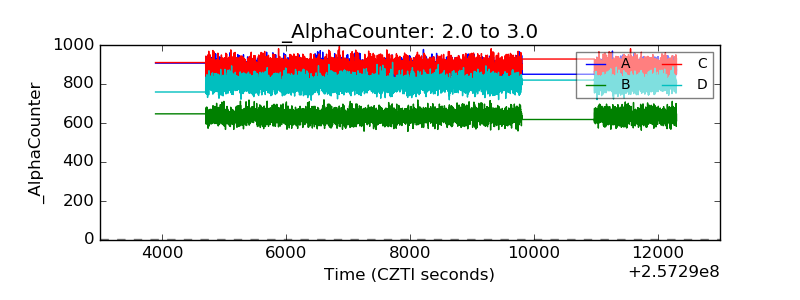 |
| _CPM_Rate | 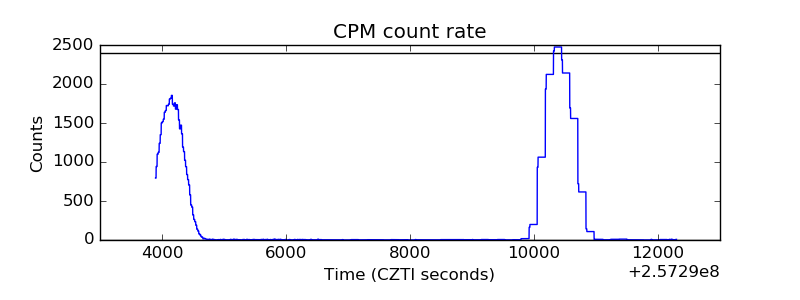 |
| CZT Counter | 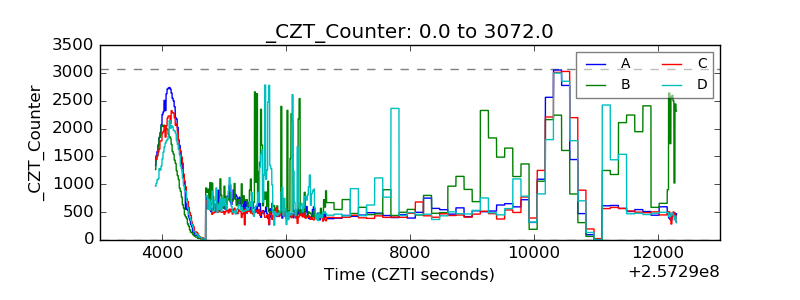 |
| +2.5 Volts monitor |  |
| +5 Volts monitor | 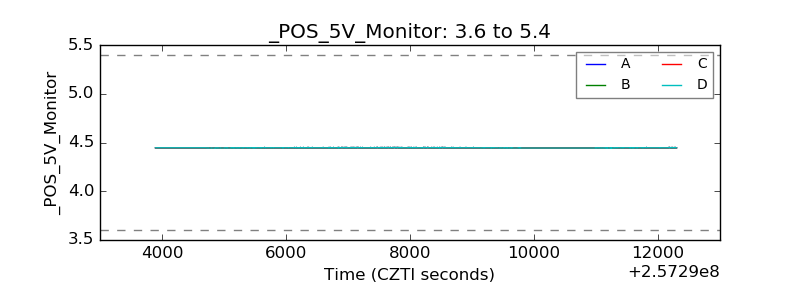 |
| _ROLL_ROT | 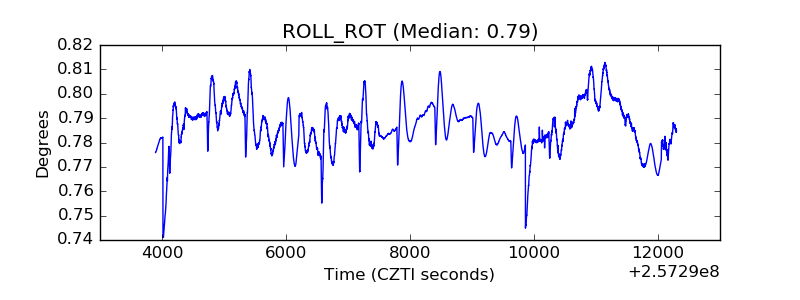 |
| _Roll_DEC | 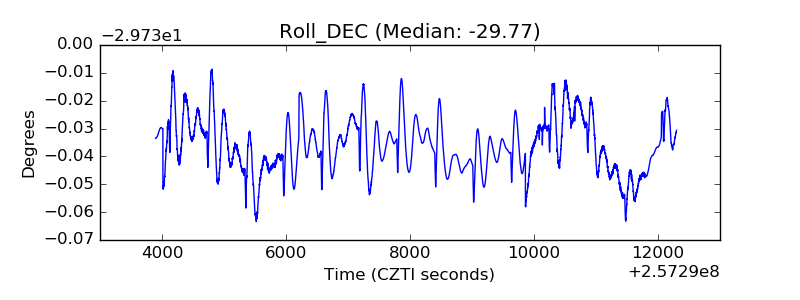 |
| _Roll_RA | 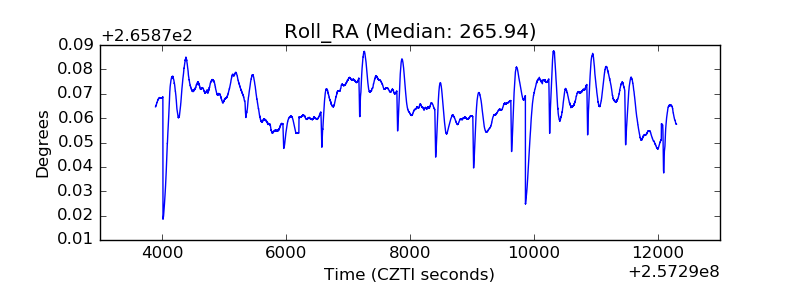 |
| Veto Counter | 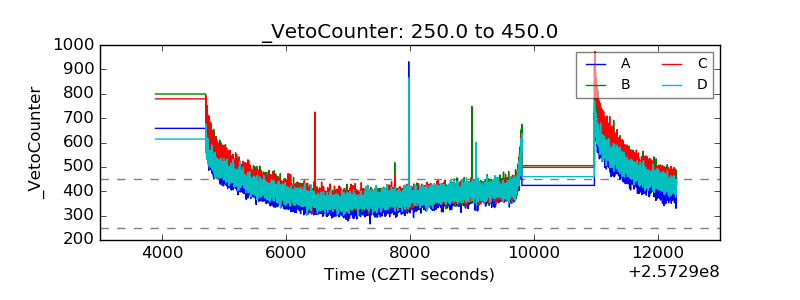 |