| Param | Original file | Final file |
|---|---|---|
| Filename | modeM0/AS1G08_045T01_9000001920_13054cztM0_level2.evt | modeM0/AS1G08_045T01_9000001920_13054cztM0_level2_quad_clean.evt |
| Size (bytes) | 668,905,920 | 100,800,000 |
| Size | 637.9 MB | 96.1 MB |
| Events in quadrant A | 3,275,829 | 695,331 |
| Events in quadrant B | 7,845,372 | 563,206 |
| Events in quadrant C | 3,038,434 | 716,010 |
| Events in quadrant D | 5,674,634 | 640,716 |
| Mode SS | |||
|---|---|---|---|
| Quadrant | BADHDUFLAG | Total packets | Discarded packets |
| A | 0 | 126 | 0 |
| B | 0 | 126 | 0 |
| C | 0 | 126 | 0 |
| D | 0 | 126 | 0 |
| Mode M0 | |||
|---|---|---|---|
| Quadrant | BADHDUFLAG | Total packets | Discarded packets |
| A | 0 | 13718 | 2 |
| B | 0 | 27513 | 1 |
| C | 0 | 12984 | 1 |
| D | 0 | 21188 | 1 |
| Mode M9 | |||
|---|---|---|---|
| Quadrant | BADHDUFLAG | Total packets | Discarded packets |
| A | 0 | 13 | 0 |
| B | 0 | 13 | 0 |
| C | 0 | 13 | 0 |
| D | 0 | 13 | 0 |
| Quadrant | Total seconds | Saturated seconds | Saturation percentage |
|---|---|---|---|
| A | 6260 | 42 | 0.670927% |
| B | 6260 | 2440 | 38.977636% |
| C | 6260 | 16 | 0.255591% |
| D | 6260 | 735 | 11.741214% |
Noise dominated data is calculated using 1-second bins in cleaned event files. If a bin has >2000 counts, and if more than 50% of those come from <1% of pixels, then it is considered to be noise-dominated and hence unusable.
| Quadrant | # 1 sec bins | Bins with >0 counts | Bins with >2000 counts | High rate bins dominated by noise | Noise dominated (total time) | Noise dominated (detector-on time) | Marked lightcurve |
|---|---|---|---|---|---|---|---|
| A | 7526 | 6262 | 13 | 13 | 0.17% | 0.21% | 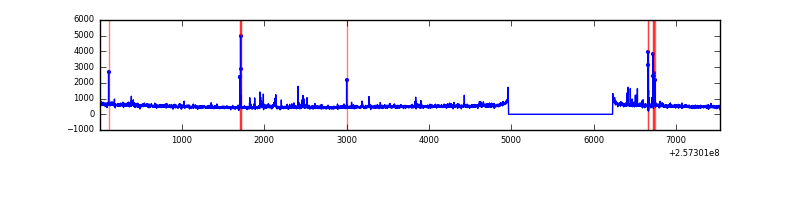 |
| B | 7526 | 6261 | 1659 | 1659 | 22.04% | 26.50% | 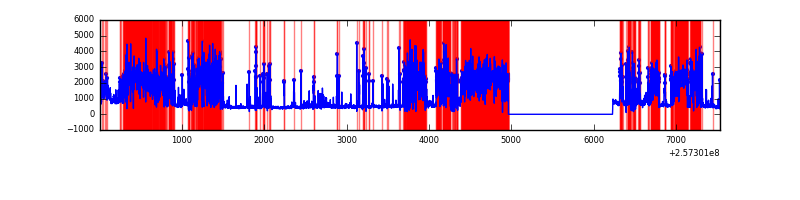 |
| C | 7526 | 6262 | 1 | 1 | 0.01% | 0.02% | 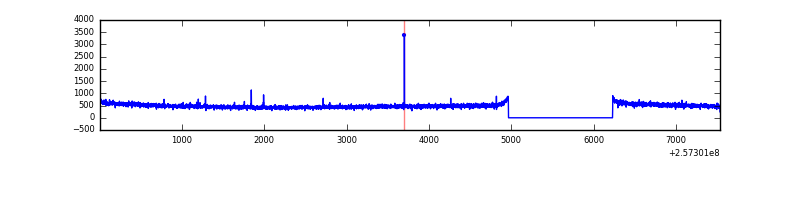 |
| D | 7526 | 6262 | 557 | 557 | 7.40% | 8.89% | 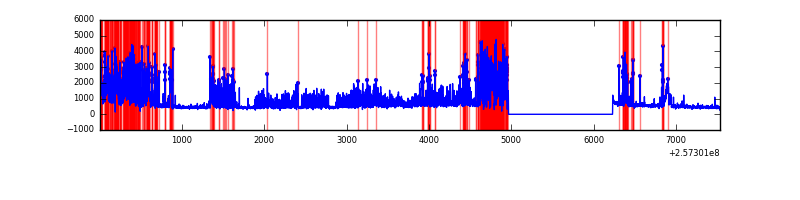 |
Top three noisy pixels from each quadrant. If the there are fewer than three noisy pixels in the level2.evt file, extra rows are filled as -1
| Pixel properties | Quadrant properties | ||||||
|---|---|---|---|---|---|---|---|
| Quadrant | DetID | PixID | Counts | Sigma | Mean | Median | Sigma |
| A | 12 | 189 | 72427 | 461.01 | 776 | 761 | 155.5 |
| A | 9 | 143 | 57427 | 364.52 | 776 | 761 | 155.5 |
| A | 15 | 223 | 46003 | 291.03 | 776 | 761 | 155.5 |
| B | 4 | 239 | 3504144 | 32019.73 | 585 | 569 | 109.4 |
| B | 0 | 85 | 1852014 | 16920.65 | 585 | 569 | 109.4 |
| B | 3 | 64 | 140810 | 1281.68 | 585 | 569 | 109.4 |
| C | 14 | 234 | 6570 | 32.23 | 776 | 784 | 179.5 |
| C | 13 | 61 | 5522 | 26.39 | 776 | 784 | 179.5 |
| C | 12 | 4 | 3577 | 15.56 | 776 | 784 | 179.5 |
| D | 1 | 52 | 1947167 | 11223.39 | 724 | 704 | 173.4 |
| D | 14 | 34 | 808873 | 4659.94 | 724 | 704 | 173.4 |
| D | 13 | 112 | 104291 | 597.28 | 724 | 704 | 173.4 |
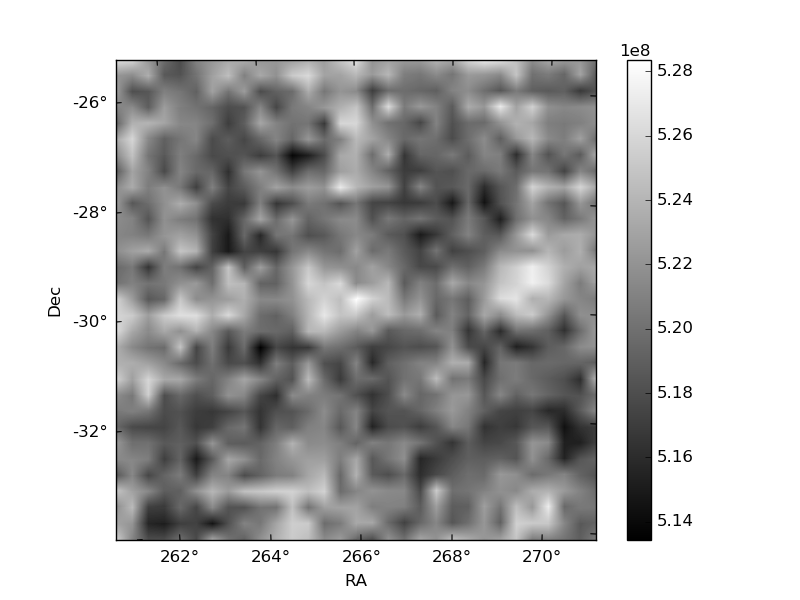
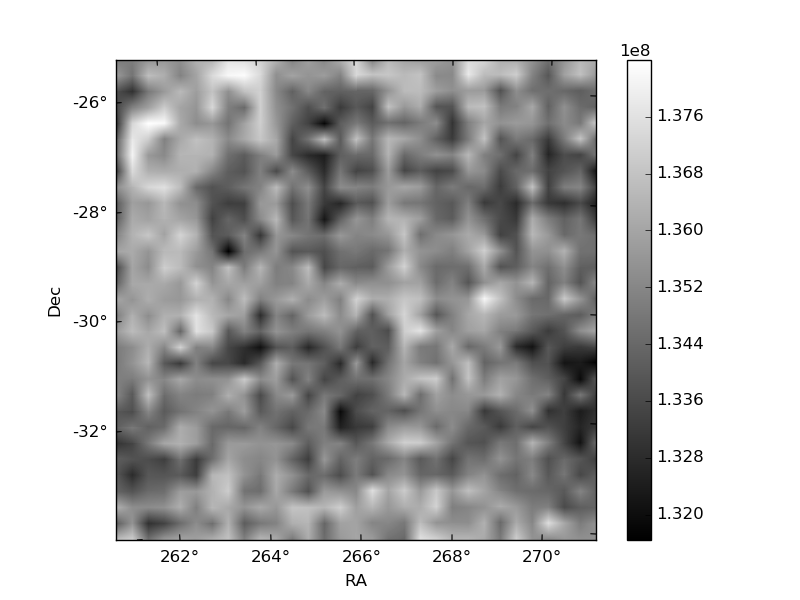
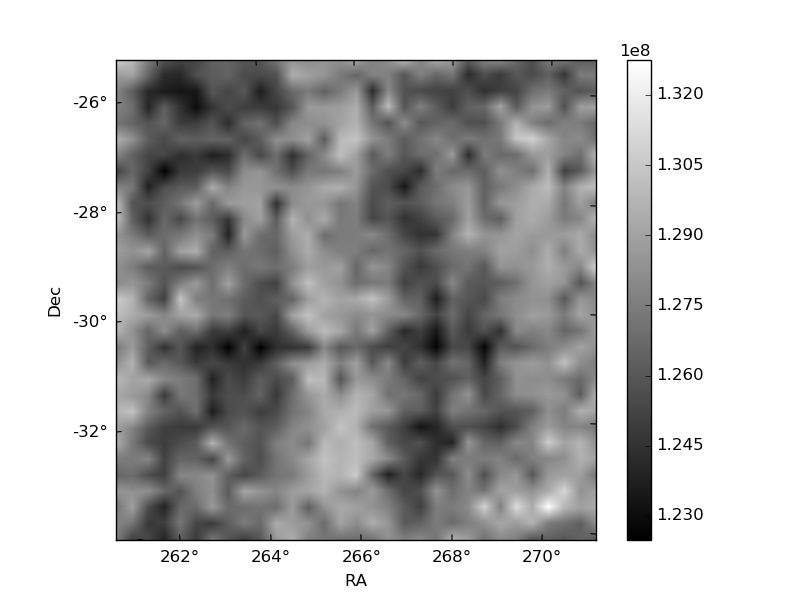
Histogram calculated using DETX and DETY for each event in the final _common_clean file
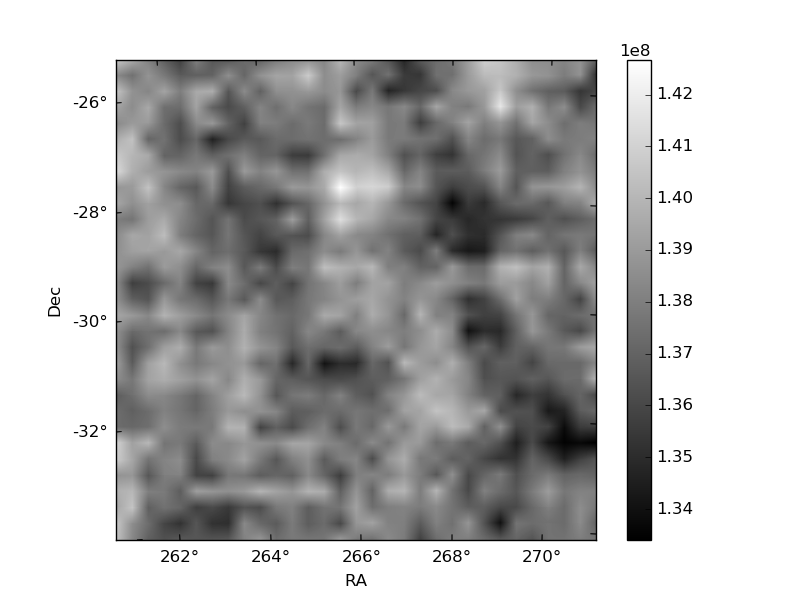
| Quadrant A | 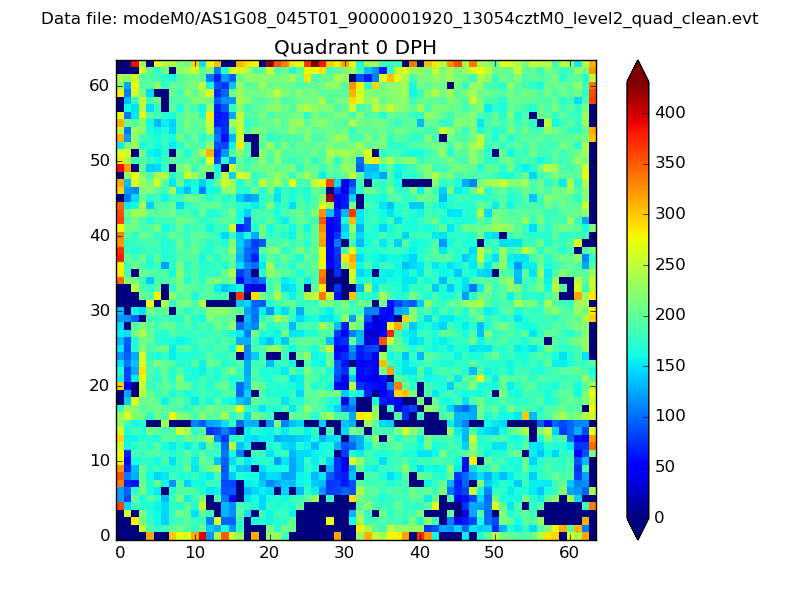 |
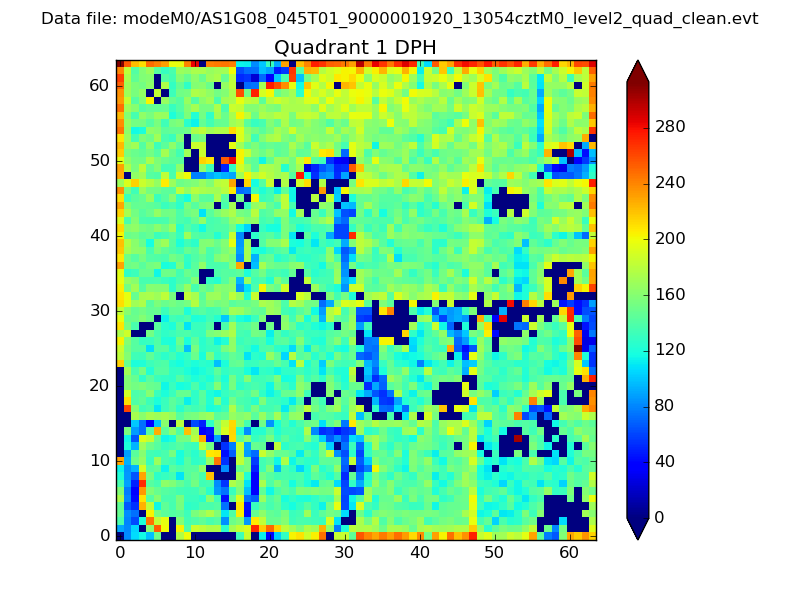 |
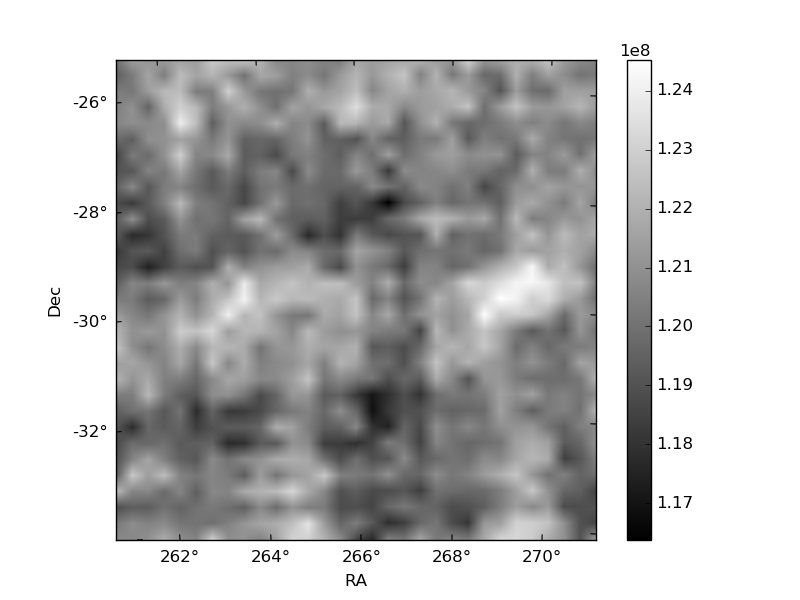
Quadrant B |
|---|---|---|---|
| Quadrant D |  |
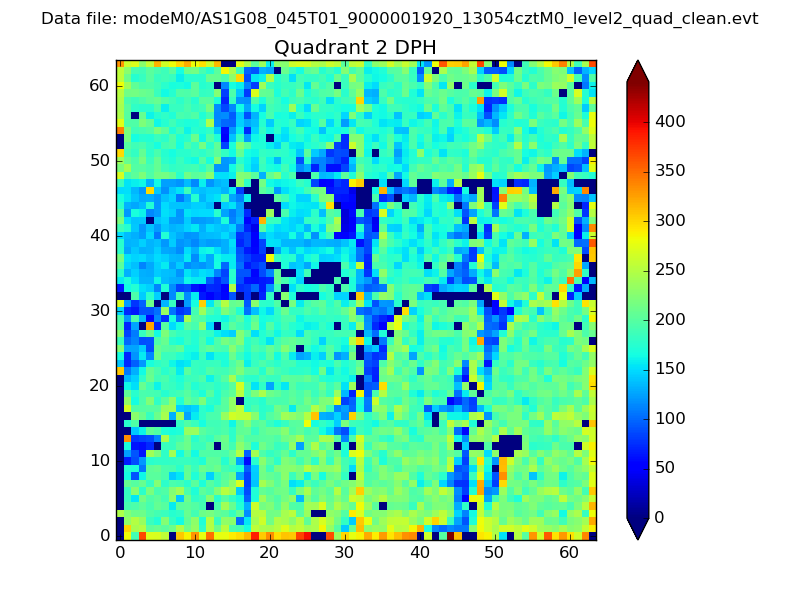 |
Quadrant C |
| Plot type | Count rate plots | Images |
|---|---|---|
| Comparison with Poisson distribution Blue bars denote a histogram of data divided into 1 sec bins. Red curve is a Poisson curve with rate = median count rate of data. |
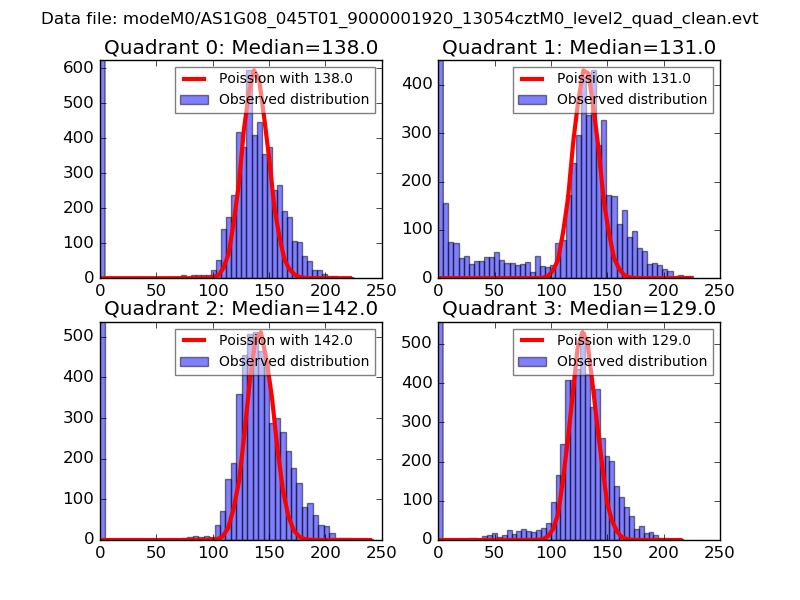 |
 |
| Quadrant-wise count rates Data is divided into 100 sec bins |
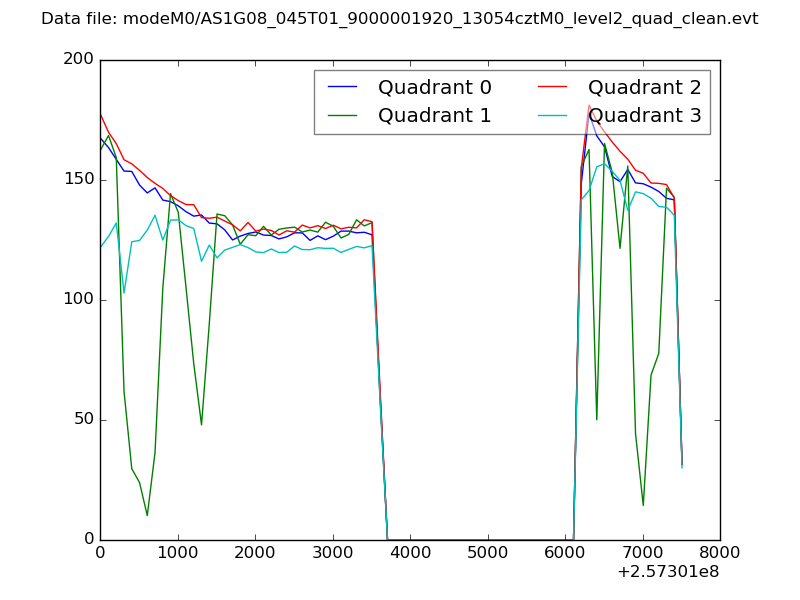 |
|
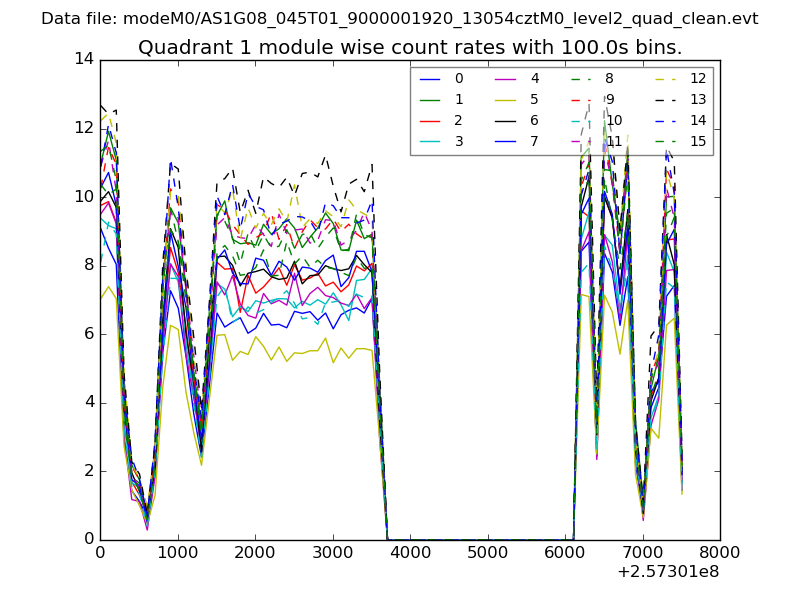
| Module-wise count rates for Quadrant A Data is divided into 100 sec bins |
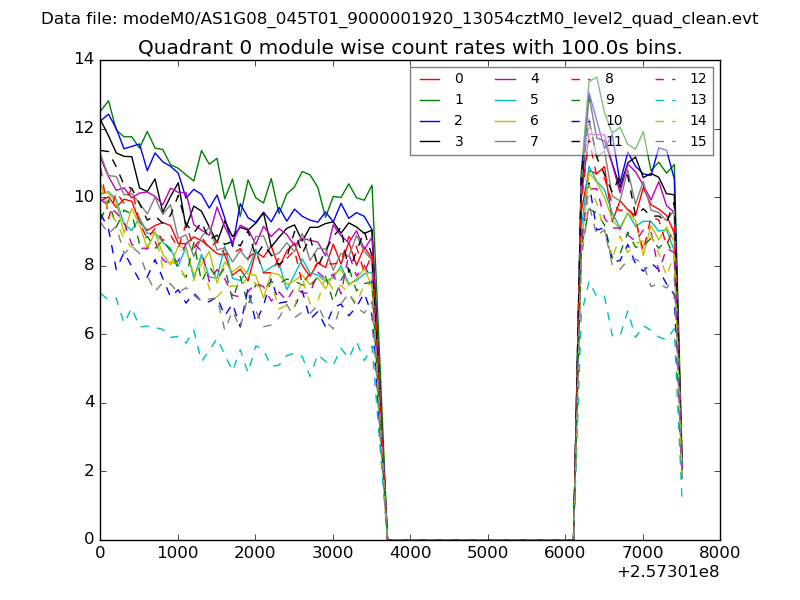 |
 |
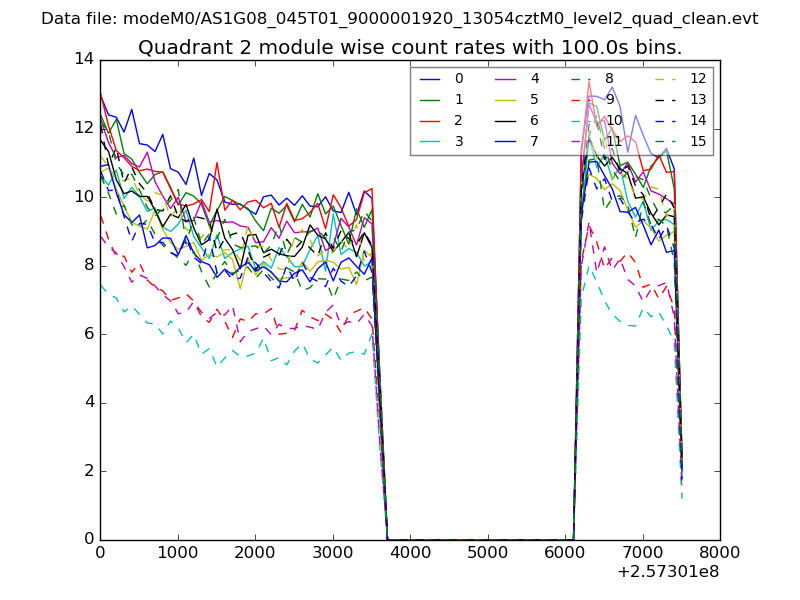
| Module-wise count rates for Quadrant B Data is divided into 100 sec bins |
 |
 |
| Module-wise count rates for Quadrant C Data is divided into 100 sec bins |
 |
 |
| Module-wise count rates for Quadrant D Data is divided into 100 sec bins |
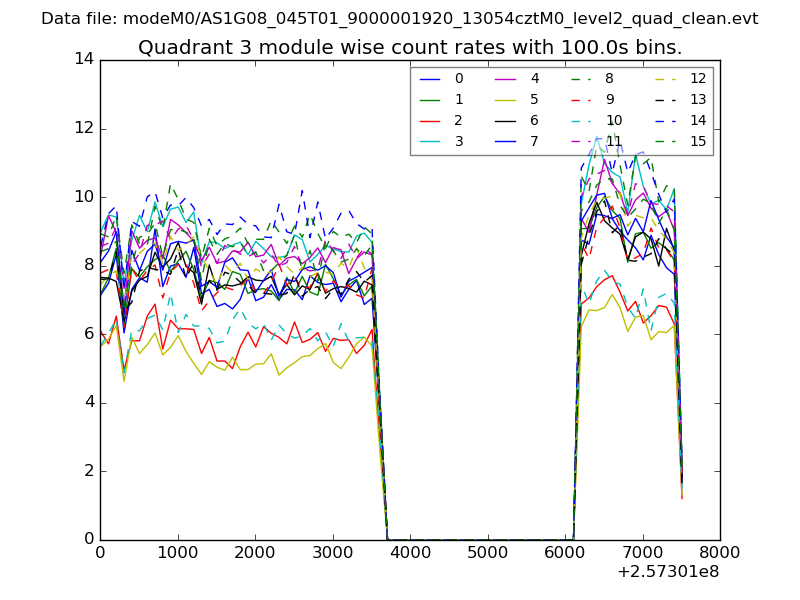 |
 |
| Parameter | Plot |
|---|---|
| CZT HV Monitor | 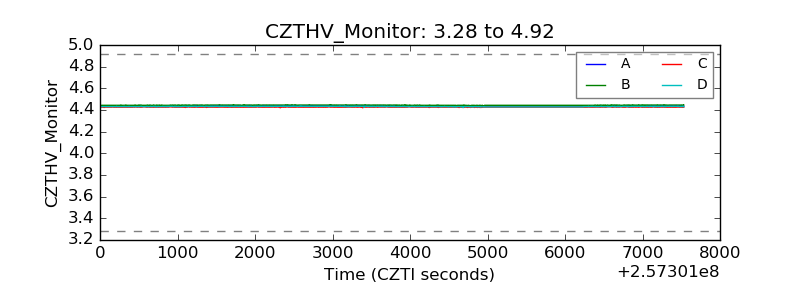 |
| D_VDD | 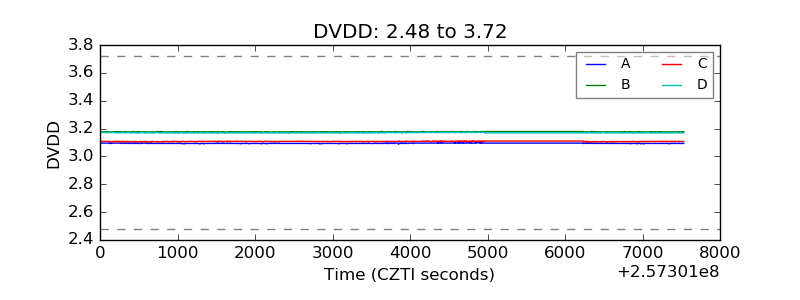 |
| Temperature 1 | 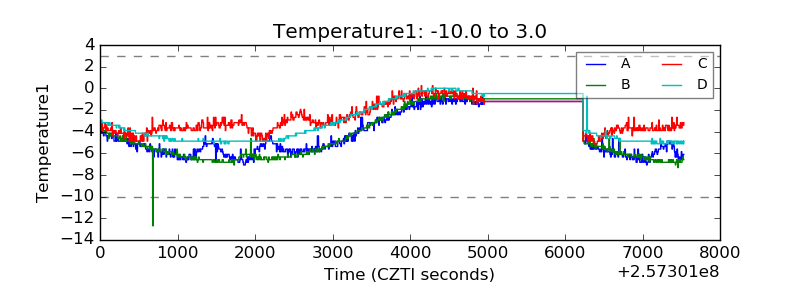 |
| Veto HV Monitor | 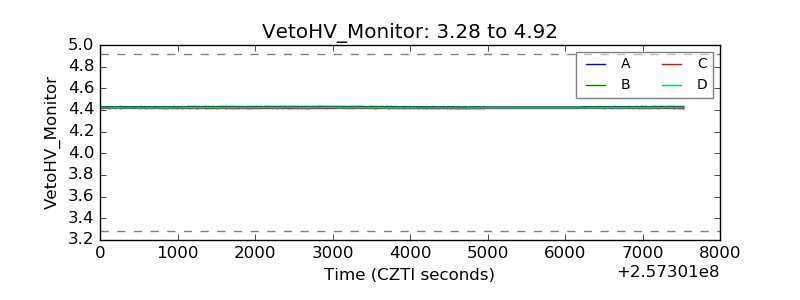 |
| Veto LLD |  |
| Alpha Counter | 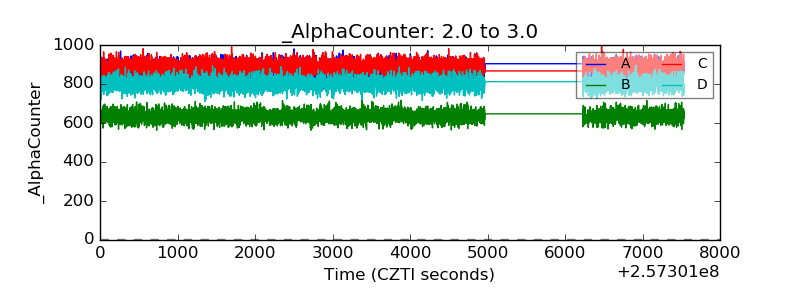 |
| _CPM_Rate | 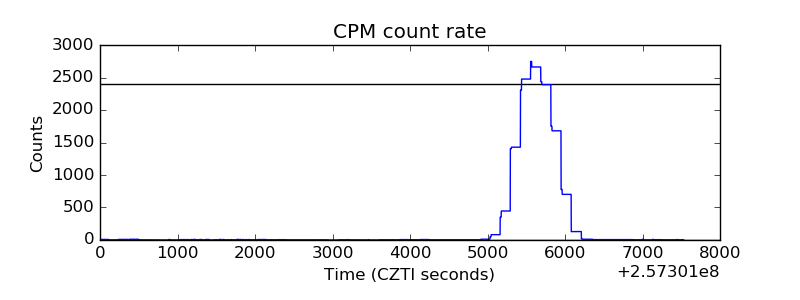 |
| CZT Counter | 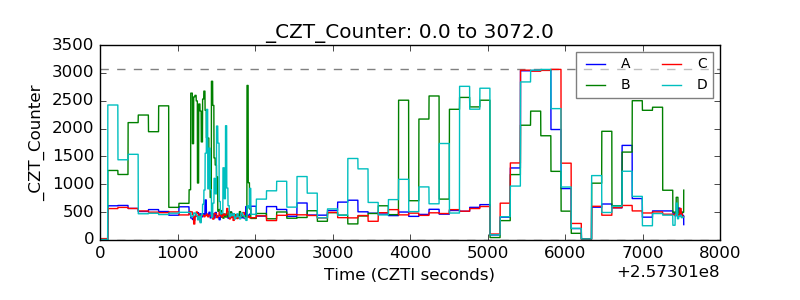 |
| +2.5 Volts monitor |  |
| +5 Volts monitor |  |
| _ROLL_ROT |  |
| _Roll_DEC | 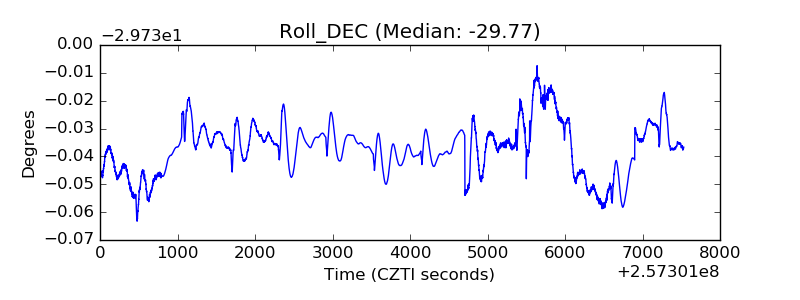 |
| _Roll_RA | 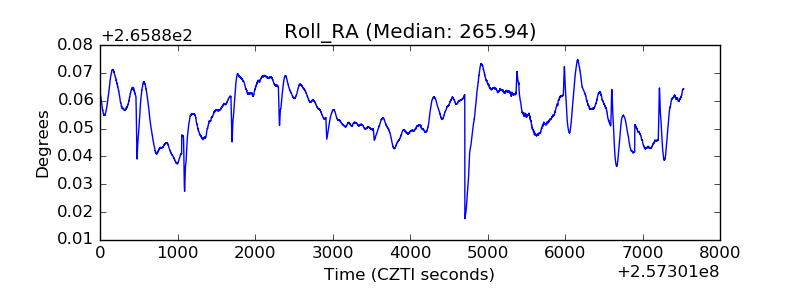 |
| Veto Counter | 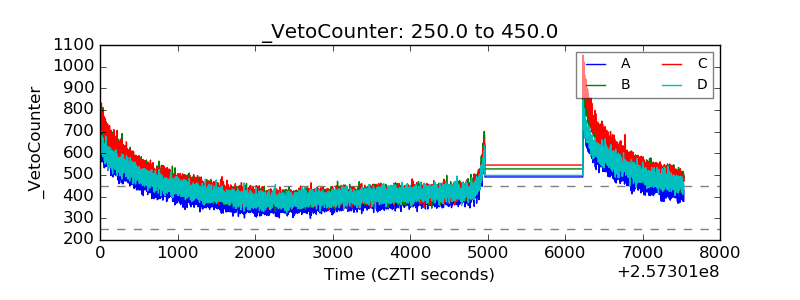 |