| Param | Original file | Final file |
|---|---|---|
| Filename | modeM0/AS1G08_045T01_9000001920_13056cztM0_level2.evt | modeM0/AS1G08_045T01_9000001920_13056cztM0_level2_quad_clean.evt |
| Size (bytes) | 571,443,840 | 83,364,480 |
| Size | 545.0 MB | 79.5 MB |
| Events in quadrant A | 3,231,990 | 544,554 |
| Events in quadrant B | 7,072,554 | 483,129 |
| Events in quadrant C | 2,865,784 | 560,121 |
| Events in quadrant D | 3,732,673 | 521,798 |
| Mode SS | |||
|---|---|---|---|
| Quadrant | BADHDUFLAG | Total packets | Discarded packets |
| A | 0 | 120 | 0 |
| B | 0 | 120 | 0 |
| C | 0 | 120 | 0 |
| D | 0 | 120 | 0 |
| Mode M0 | |||
|---|---|---|---|
| Quadrant | BADHDUFLAG | Total packets | Discarded packets |
| A | 0 | 13290 | 2 |
| B | 0 | 24892 | 1 |
| C | 0 | 12197 | 1 |
| D | 0 | 14777 | 1 |
| Mode M9 | |||
|---|---|---|---|
| Quadrant | BADHDUFLAG | Total packets | Discarded packets |
| A | 0 | 14 | 0 |
| B | 0 | 14 | 0 |
| C | 0 | 14 | 0 |
| D | 0 | 14 | 0 |
| Quadrant | Total seconds | Saturated seconds | Saturation percentage |
|---|---|---|---|
| A | 5936 | 60 | 1.010782% |
| B | 5936 | 2606 | 43.901617% |
| C | 5936 | 15 | 0.252695% |
| D | 5936 | 147 | 2.476415% |
Noise dominated data is calculated using 1-second bins in cleaned event files. If a bin has >2000 counts, and if more than 50% of those come from <1% of pixels, then it is considered to be noise-dominated and hence unusable.
| Quadrant | # 1 sec bins | Bins with >0 counts | Bins with >2000 counts | High rate bins dominated by noise | Noise dominated (total time) | Noise dominated (detector-on time) | Marked lightcurve |
|---|---|---|---|---|---|---|---|
| A | 7257 | 5939 | 20 | 20 | 0.28% | 0.34% | 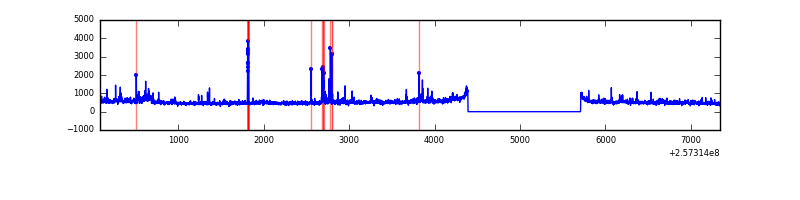 |
| B | 7257 | 5938 | 1448 | 1448 | 19.95% | 24.39% | 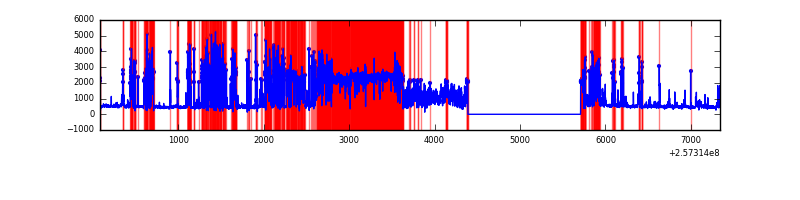 |
| C | 7257 | 5939 | 2 | 2 | 0.03% | 0.03% | 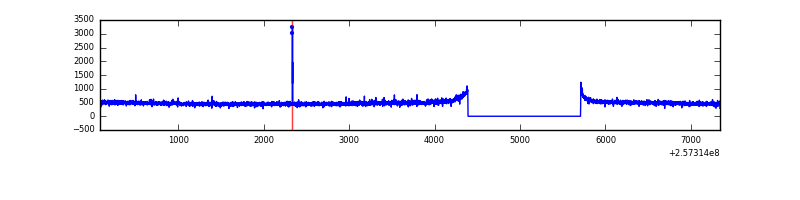 |
| D | 7257 | 5939 | 108 | 108 | 1.49% | 1.82% | 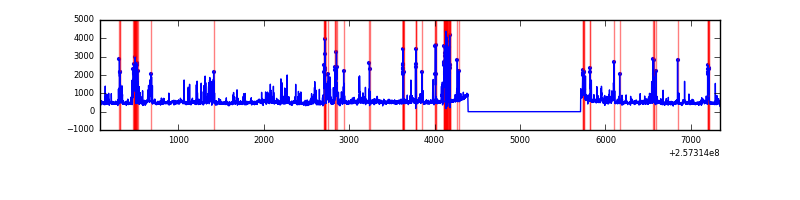 |
Top three noisy pixels from each quadrant. If the there are fewer than three noisy pixels in the level2.evt file, extra rows are filled as -1
| Pixel properties | Quadrant properties | ||||||
|---|---|---|---|---|---|---|---|
| Quadrant | DetID | PixID | Counts | Sigma | Mean | Median | Sigma |
| A | 8 | 15 | 191834 | 1304.89 | 729 | 713 | 146.5 |
| A | 15 | 174 | 65751 | 444.05 | 729 | 713 | 146.5 |
| A | 12 | 189 | 44234 | 297.14 | 729 | 713 | 146.5 |
| B | 4 | 239 | 3211347 | 36678.17 | 464 | 453 | 87.5 |
| B | 0 | 85 | 1928585 | 22025.13 | 464 | 453 | 87.5 |
| B | 0 | 219 | 59155 | 670.56 | 464 | 453 | 87.5 |
| C | 14 | 234 | 10706 | 59.49 | 730 | 738 | 167.6 |
| C | 13 | 61 | 5207 | 26.67 | 730 | 738 | 167.6 |
| C | 12 | 4 | 5205 | 26.66 | 730 | 738 | 167.6 |
| D | 1 | 52 | 934240 | 5509.89 | 713 | 695 | 169.4 |
| D | 8 | 195 | 42261 | 245.33 | 713 | 695 | 169.4 |
| D | 7 | 223 | 27157 | 156.18 | 713 | 695 | 169.4 |
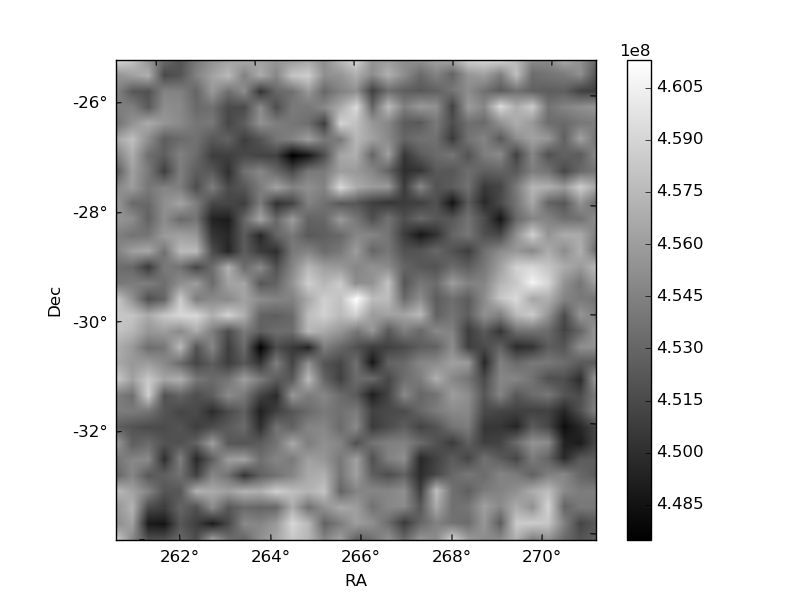
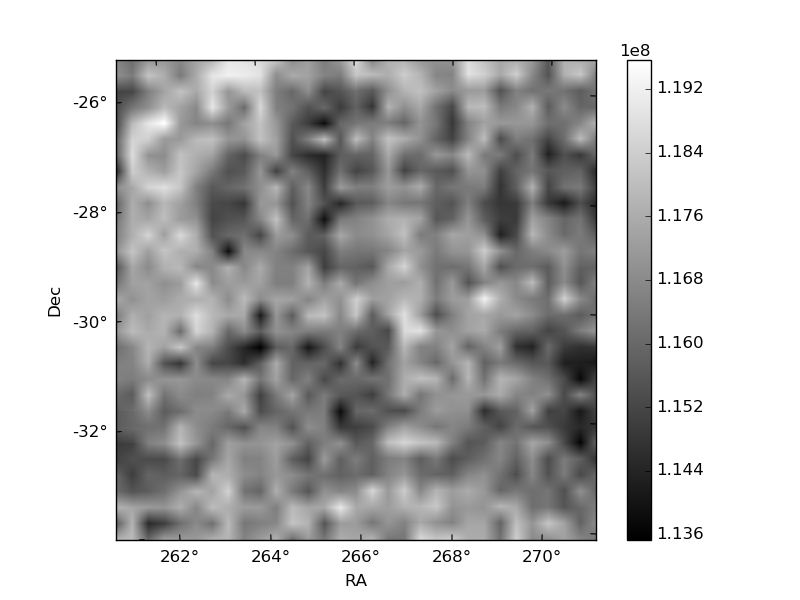
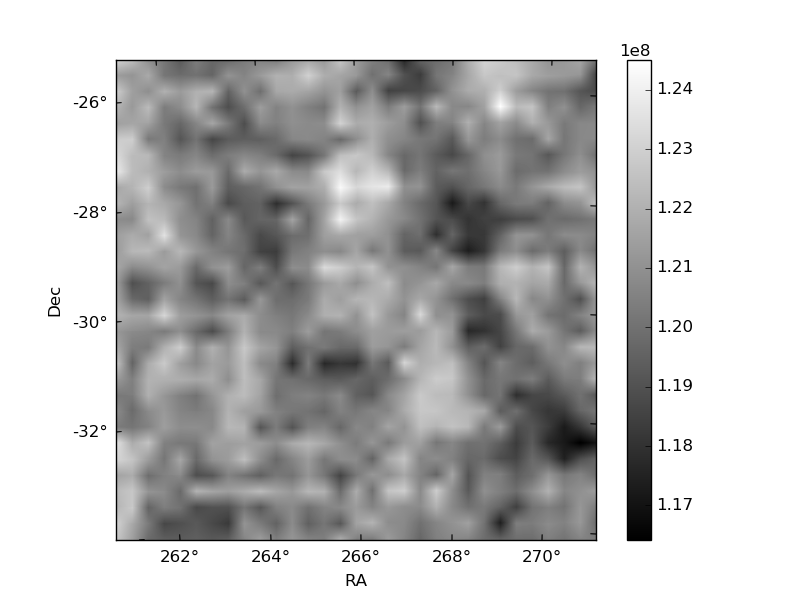
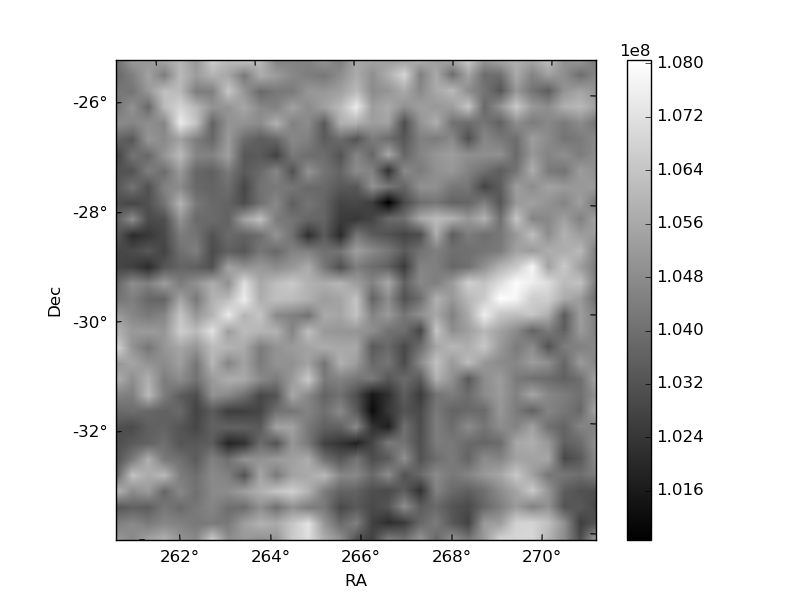
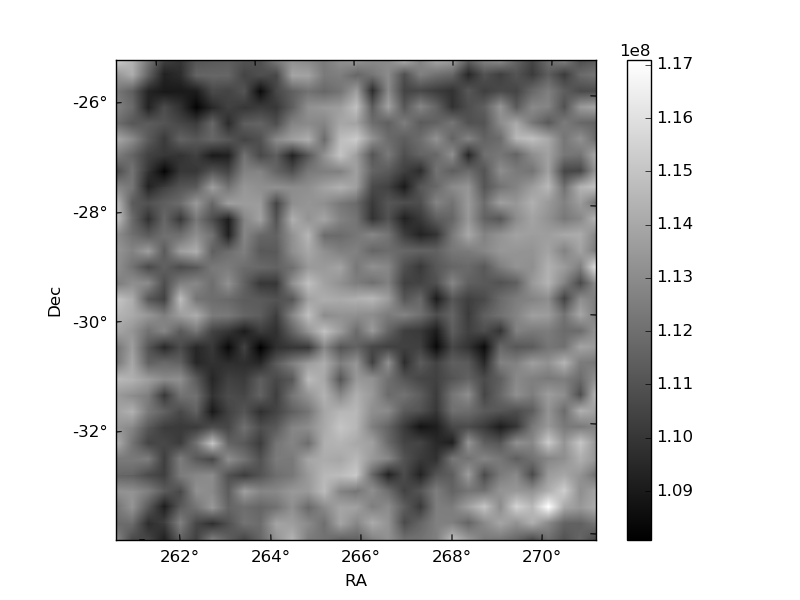
Histogram calculated using DETX and DETY for each event in the final _common_clean file
| Quadrant A | 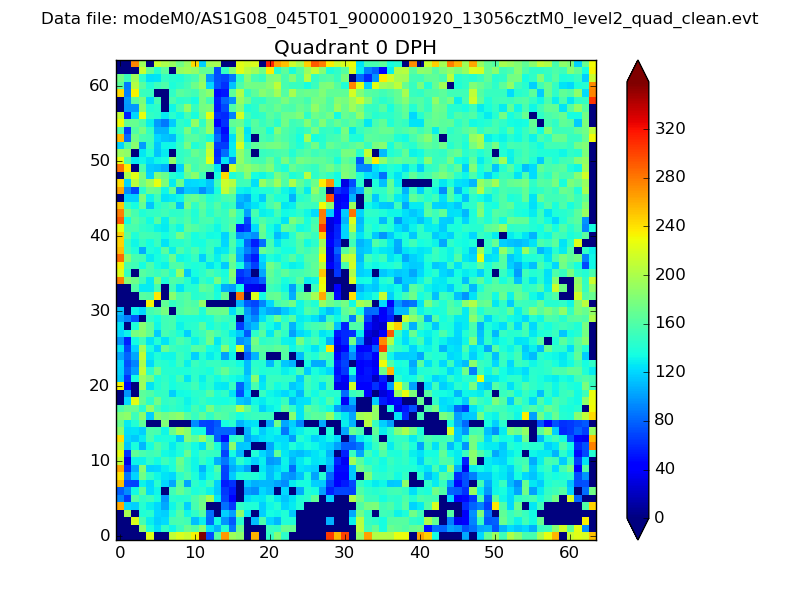 |
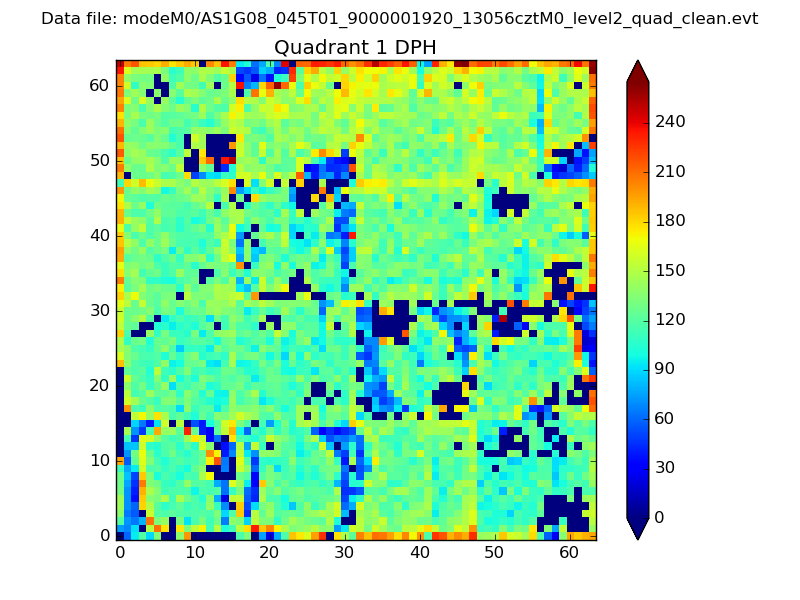 |
Quadrant B |
|---|---|---|---|
| Quadrant D | 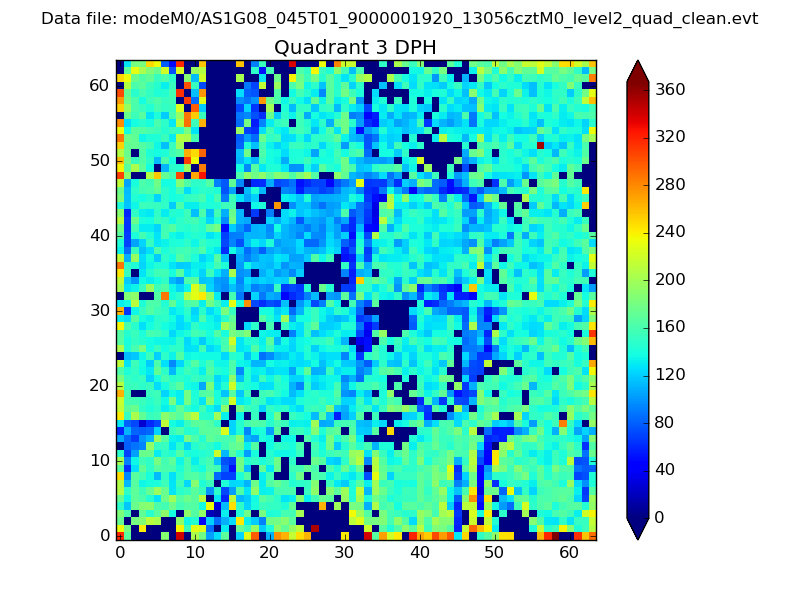 |
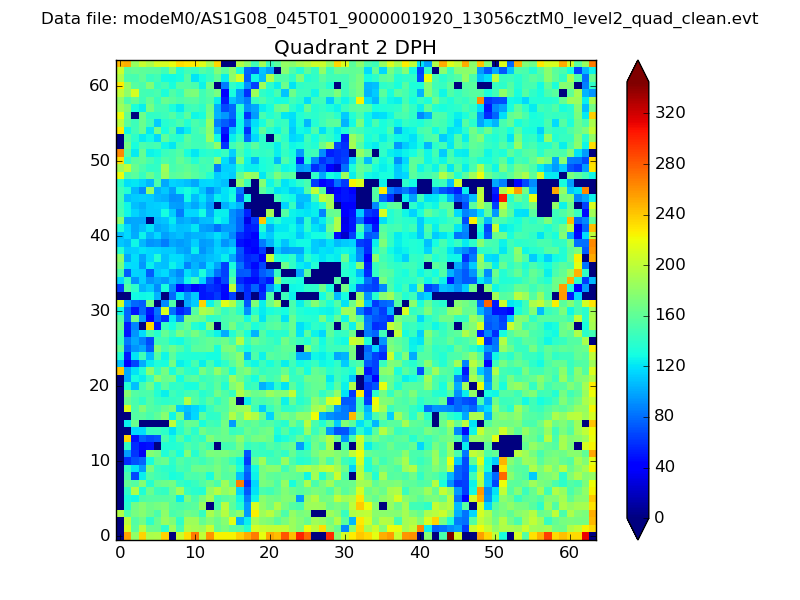 |
Quadrant C |
| Plot type | Count rate plots | Images |
|---|---|---|
| Comparison with Poisson distribution Blue bars denote a histogram of data divided into 1 sec bins. Red curve is a Poisson curve with rate = median count rate of data. |
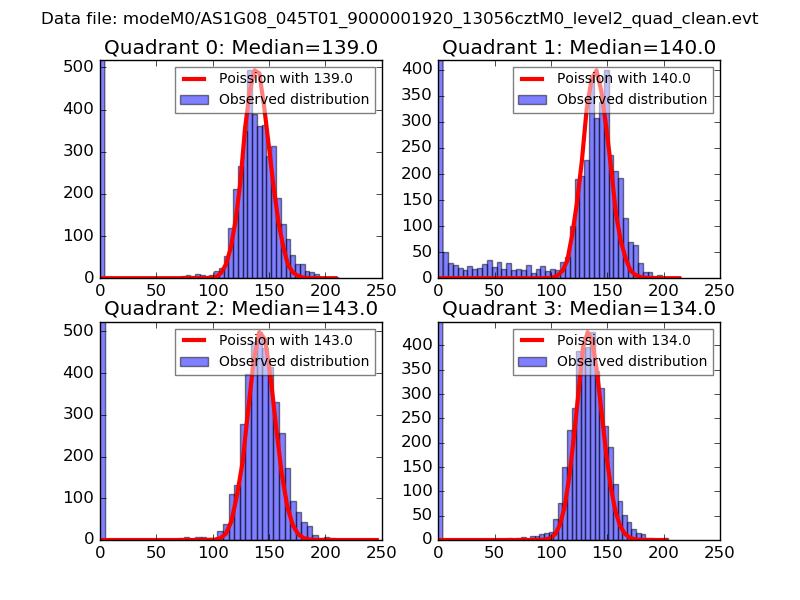 |
 |
| Quadrant-wise count rates Data is divided into 100 sec bins |
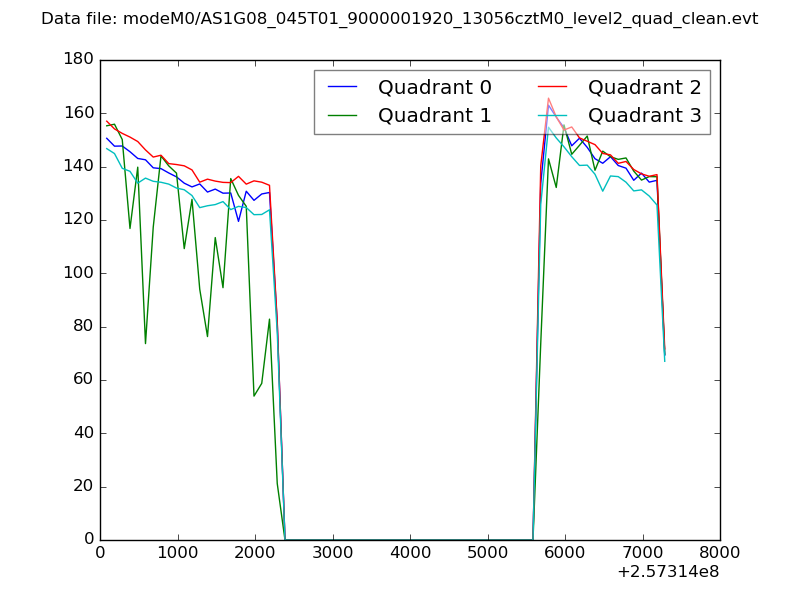 |
|
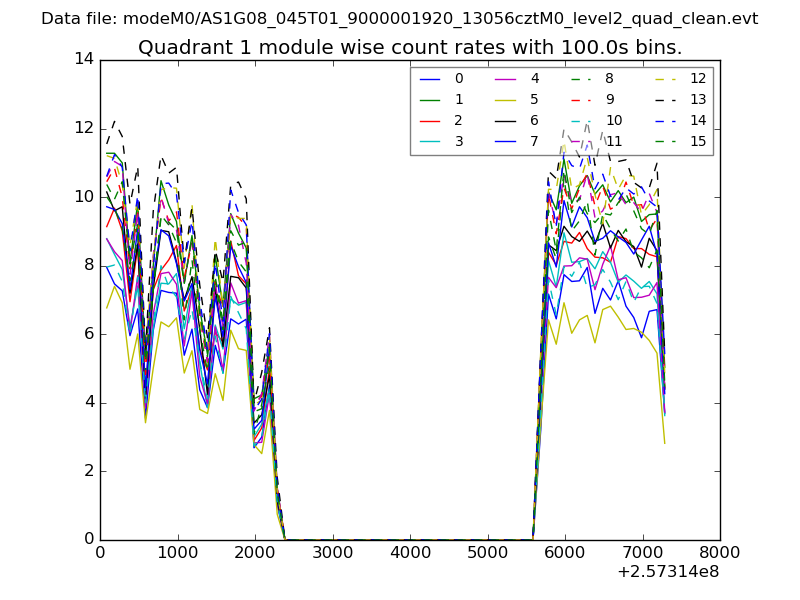
| Module-wise count rates for Quadrant A Data is divided into 100 sec bins |
 |
 |
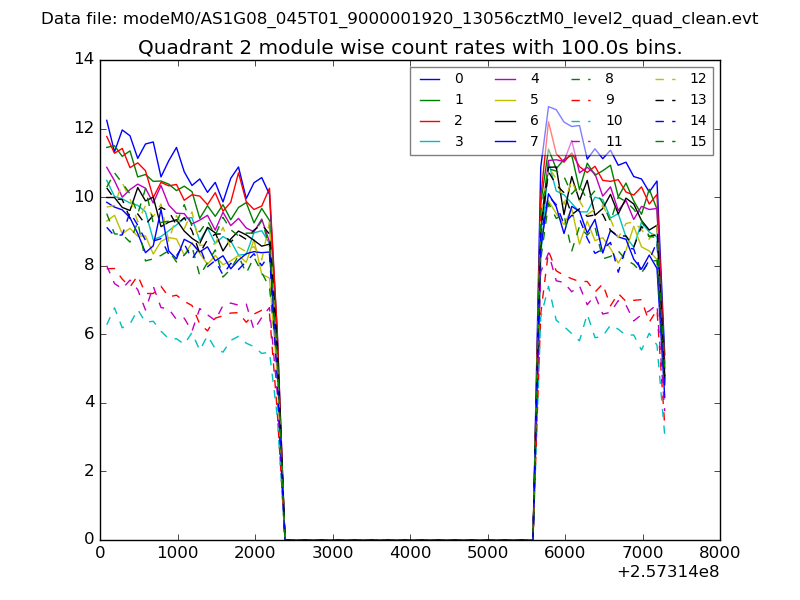
| Module-wise count rates for Quadrant B Data is divided into 100 sec bins |
 |
 |
| Module-wise count rates for Quadrant C Data is divided into 100 sec bins |
 |
 |
| Module-wise count rates for Quadrant D Data is divided into 100 sec bins |
 |
 |
| Parameter | Plot |
|---|---|
| CZT HV Monitor | 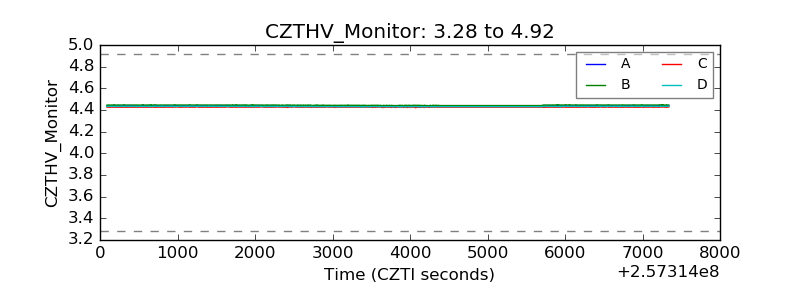 |
| D_VDD |  |
| Temperature 1 | 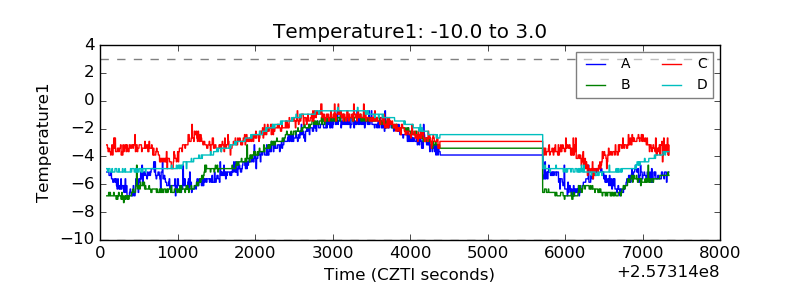 |
| Veto HV Monitor | 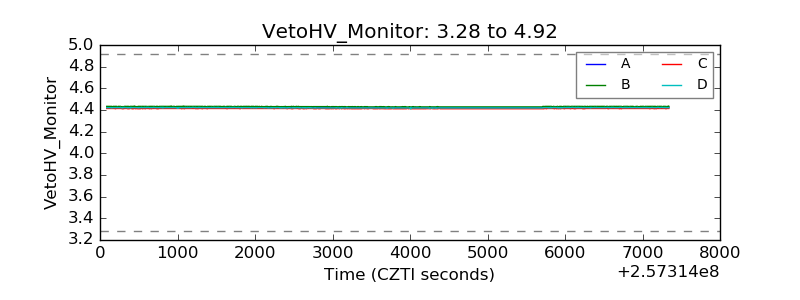 |
| Veto LLD |  |
| Alpha Counter | 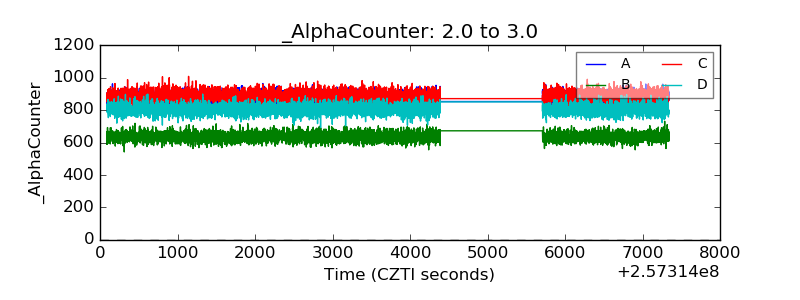 |
| _CPM_Rate | 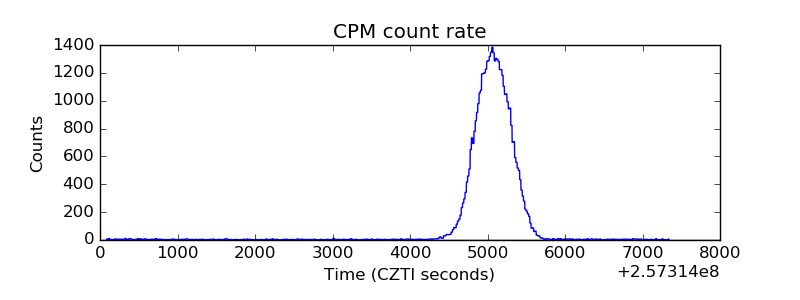 |
| CZT Counter | 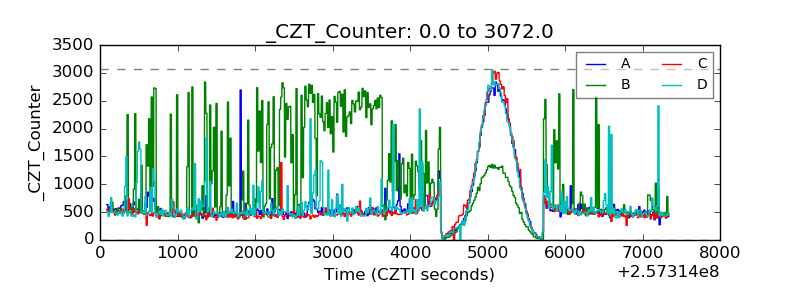 |
| +2.5 Volts monitor |  |
| +5 Volts monitor |  |
| _ROLL_ROT |  |
| _Roll_DEC | 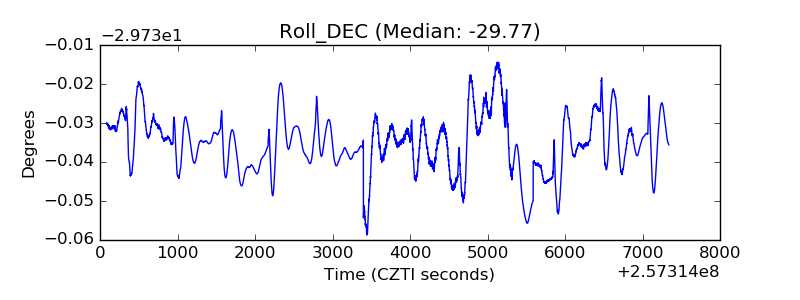 |
| _Roll_RA | 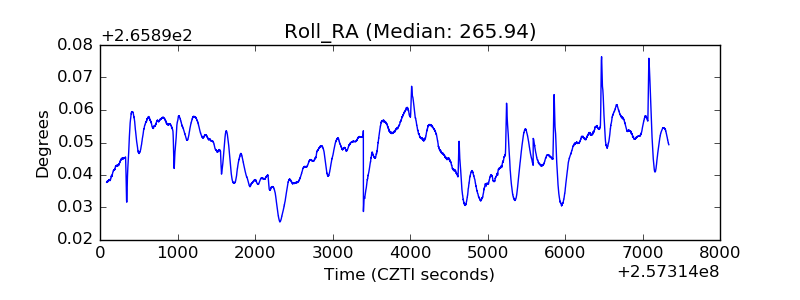 |
| Veto Counter |  |