| Param | Original file | Final file |
|---|---|---|
| Filename | modeM0/AS1G08_045T01_9000001920_13058cztM0_level2.evt | modeM0/AS1G08_045T01_9000001920_13058cztM0_level2_quad_clean.evt |
| Size (bytes) | 512,303,040 | 86,106,240 |
| Size | 488.6 MB | 82.1 MB |
| Events in quadrant A | 3,388,090 | 555,515 |
| Events in quadrant B | 5,382,807 | 506,370 |
| Events in quadrant C | 2,976,103 | 562,612 |
| Events in quadrant D | 3,331,884 | 534,670 |
| Mode SS | |||
|---|---|---|---|
| Quadrant | BADHDUFLAG | Total packets | Discarded packets |
| A | 0 | 132 | 0 |
| B | 0 | 132 | 0 |
| C | 0 | 132 | 2 |
| D | 0 | 132 | 0 |
| Mode M0 | |||
|---|---|---|---|
| Quadrant | BADHDUFLAG | Total packets | Discarded packets |
| A | 0 | 14316 | 137 |
| B | 0 | 20435 | 192 |
| C | 0 | 13312 | 149 |
| D | 0 | 14185 | 140 |
| Mode M9 | |||
|---|---|---|---|
| Quadrant | BADHDUFLAG | Total packets | Discarded packets |
| A | 0 | 8 | 0 |
| B | 0 | 8 | 0 |
| C | 0 | 8 | 0 |
| D | 0 | 8 | 0 |
| Quadrant | Total seconds | Saturated seconds | Saturation percentage |
|---|---|---|---|
| A | 6422 | 148 | 2.304578% |
| B | 6409 | 1031 | 16.086753% |
| C | 6413 | 86 | 1.341026% |
| D | 6425 | 122 | 1.898833% |
Noise dominated data is calculated using 1-second bins in cleaned event files. If a bin has >2000 counts, and if more than 50% of those come from <1% of pixels, then it is considered to be noise-dominated and hence unusable.
| Quadrant | # 1 sec bins | Bins with >0 counts | Bins with >2000 counts | High rate bins dominated by noise | Noise dominated (total time) | Noise dominated (detector-on time) | Marked lightcurve |
|---|---|---|---|---|---|---|---|
| A | 7313 | 6450 | 23 | 23 | 0.31% | 0.36% | 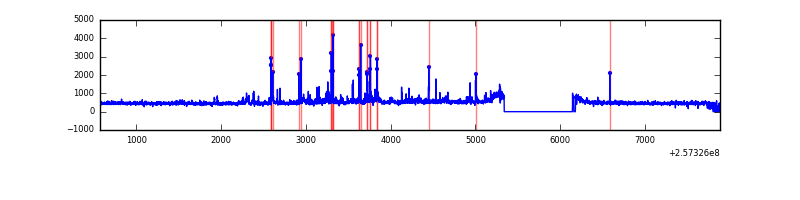 |
| B | 7310 | 6448 | 619 | 619 | 8.47% | 9.60% | 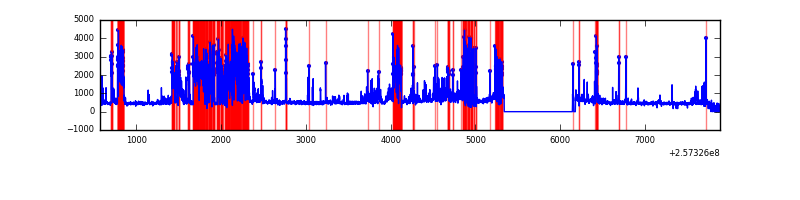 |
| C | 7312 | 6451 | 2 | 2 | 0.03% | 0.03% | 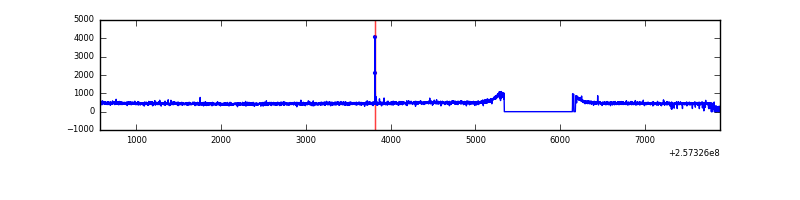 |
| D | 7314 | 6460 | 10 | 10 | 0.14% | 0.15% | 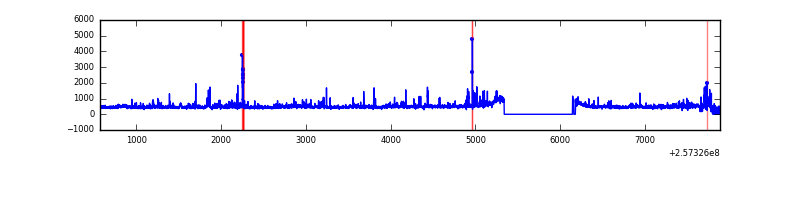 |
Top three noisy pixels from each quadrant. If the there are fewer than three noisy pixels in the level2.evt file, extra rows are filled as -1
| Pixel properties | Quadrant properties | ||||||
|---|---|---|---|---|---|---|---|
| Quadrant | DetID | PixID | Counts | Sigma | Mean | Median | Sigma |
| A | 8 | 15 | 136809 | 861.24 | 772 | 756 | 158.0 |
| A | 12 | 189 | 82985 | 520.53 | 772 | 756 | 158.0 |
| A | 15 | 223 | 66121 | 413.77 | 772 | 756 | 158.0 |
| B | 4 | 239 | 2242295 | 16942.1 | 692 | 676 | 132.3 |
| B | 3 | 64 | 161168 | 1212.99 | 692 | 676 | 132.3 |
| B | 0 | 85 | 86026 | 645.07 | 692 | 676 | 132.3 |
| C | 14 | 234 | 12531 | 66.88 | 759 | 764 | 175.9 |
| C | 13 | 61 | 5405 | 26.38 | 759 | 764 | 175.9 |
| C | 12 | 4 | 3187 | 13.77 | 759 | 764 | 175.9 |
| D | 1 | 52 | 396296 | 2168.48 | 758 | 736 | 182.4 |
| D | 8 | 195 | 39953 | 214.99 | 758 | 736 | 182.4 |
| D | 2 | 234 | 19548 | 103.13 | 758 | 736 | 182.4 |
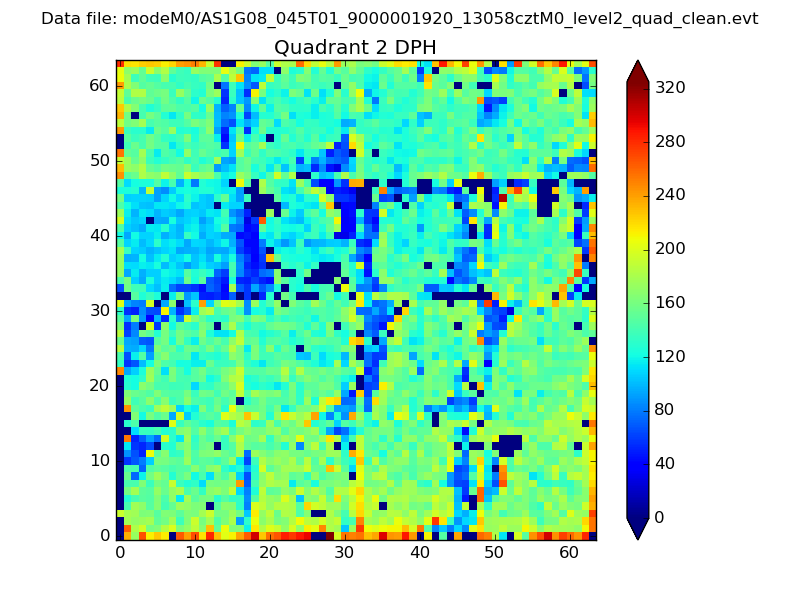
Histogram calculated using DETX and DETY for each event in the final _common_clean file
| Quadrant A | 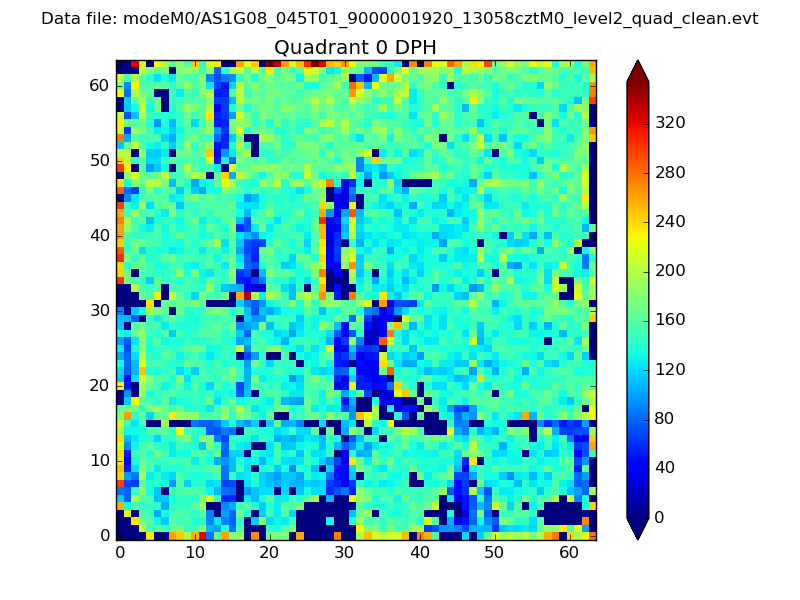 |
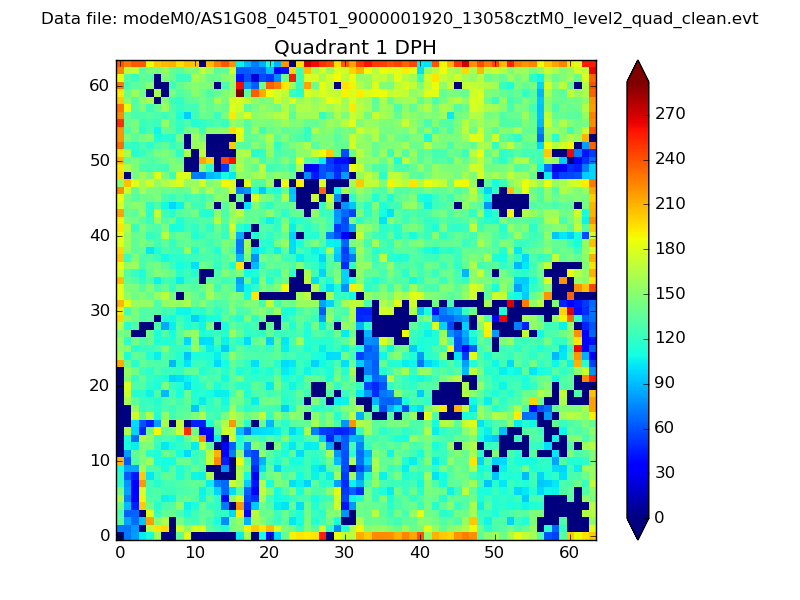 |
Quadrant B |
|---|---|---|---|
| Quadrant D | 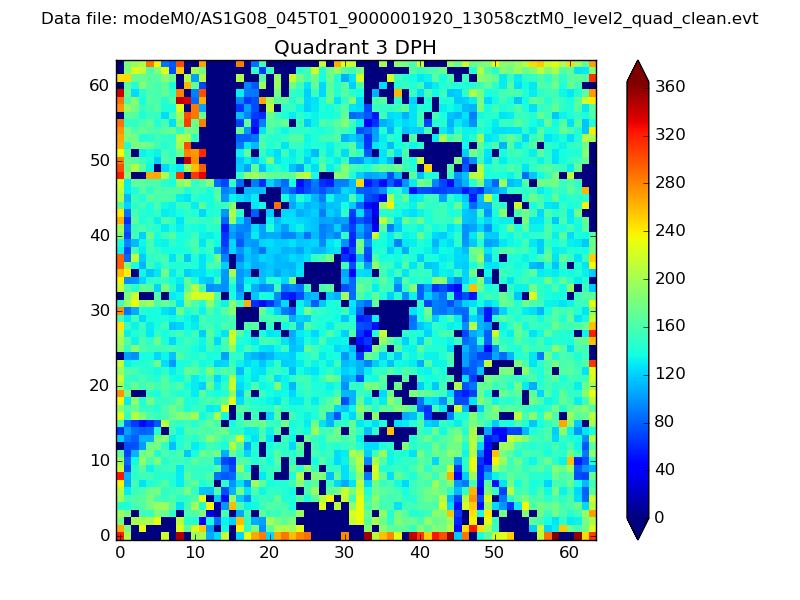 |
 |
Quadrant C |
| Plot type | Count rate plots | Images |
|---|---|---|
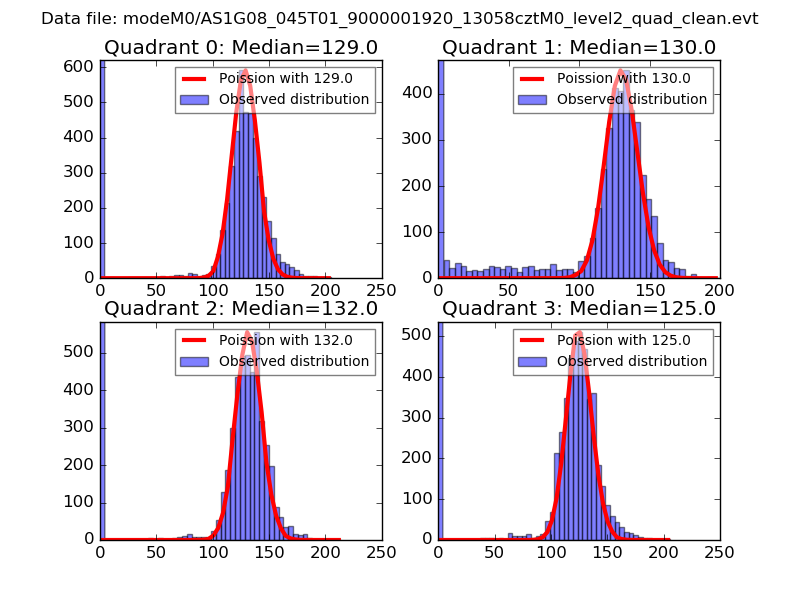
| Comparison with Poisson distribution Blue bars denote a histogram of data divided into 1 sec bins. Red curve is a Poisson curve with rate = median count rate of data. |
 |
 |
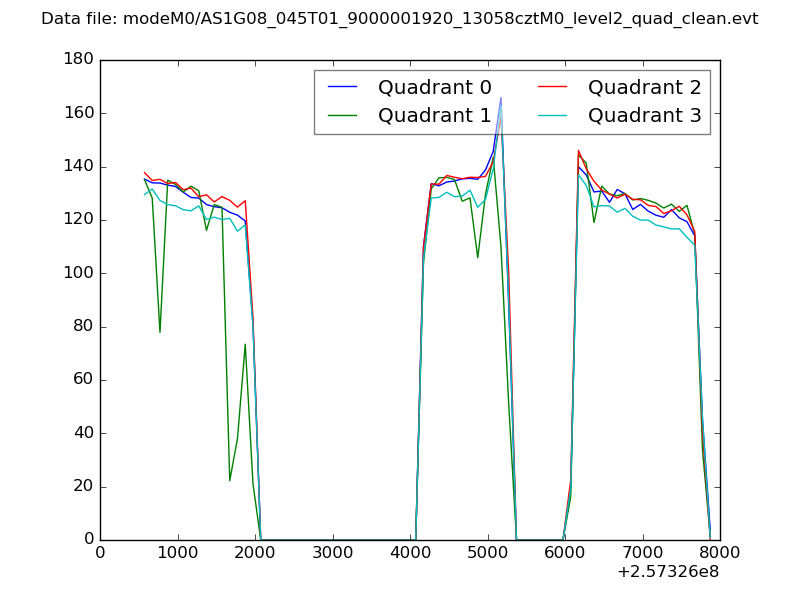
| Quadrant-wise count rates Data is divided into 100 sec bins |
 |
|
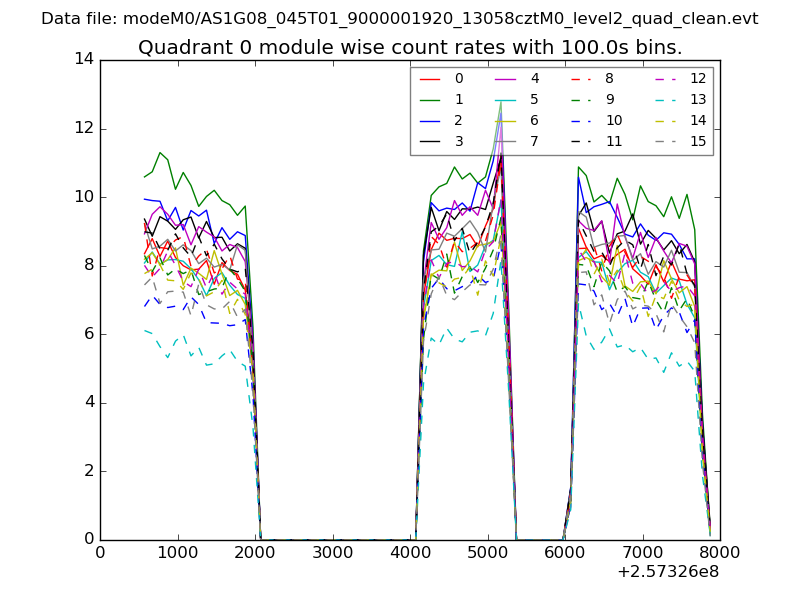
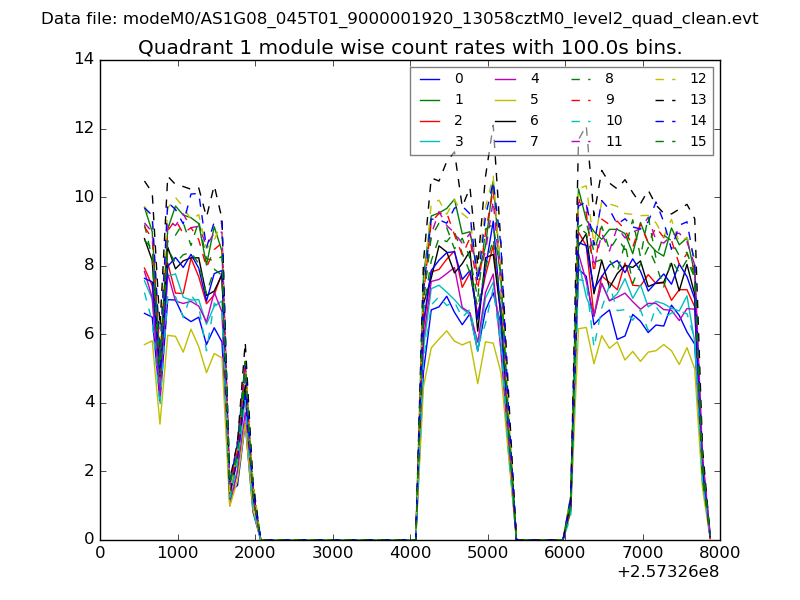
| Module-wise count rates for Quadrant A Data is divided into 100 sec bins |
 |
 |
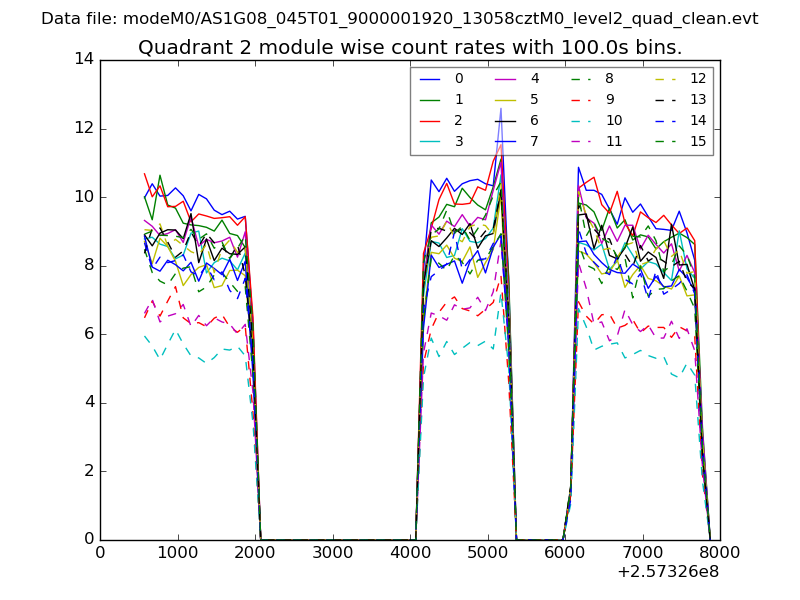
| Module-wise count rates for Quadrant B Data is divided into 100 sec bins |
 |
 |
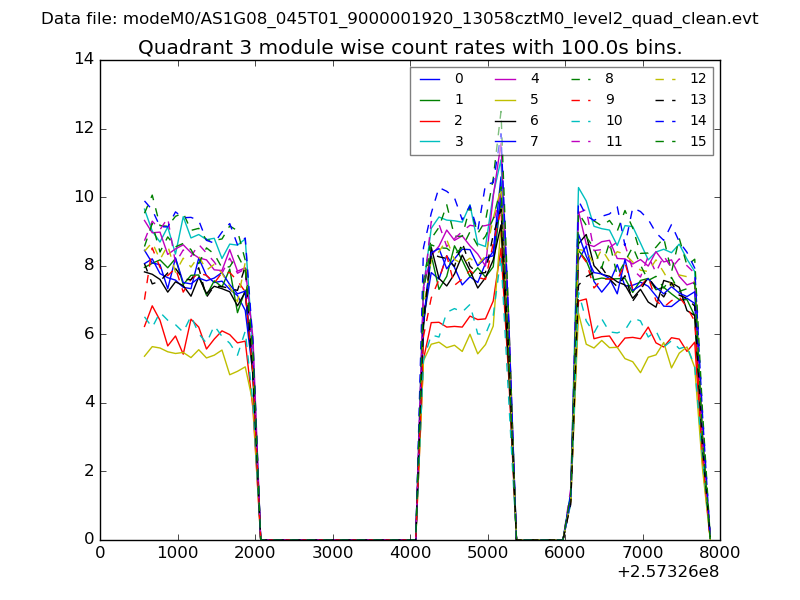
| Module-wise count rates for Quadrant C Data is divided into 100 sec bins |
 |
 |
| Module-wise count rates for Quadrant D Data is divided into 100 sec bins |
 |
 |
| Parameter | Plot |
|---|---|
| CZT HV Monitor | 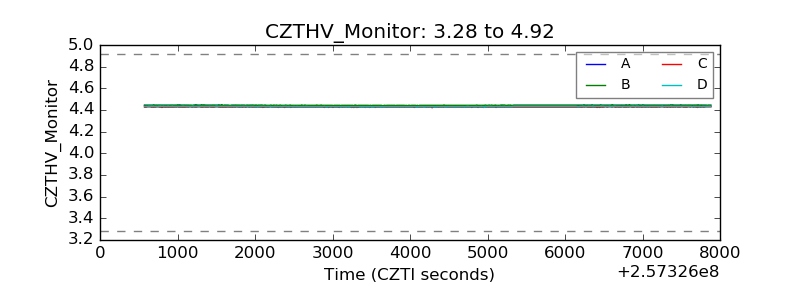 |
| D_VDD | 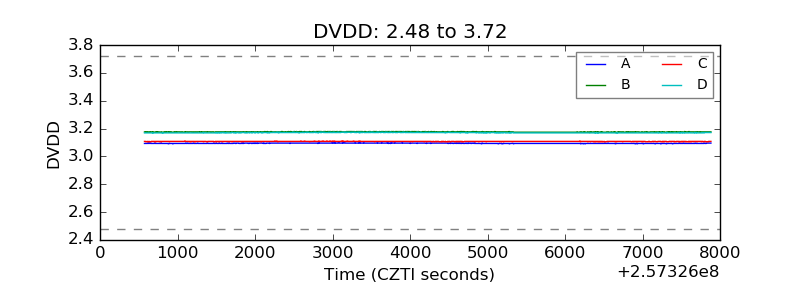 |
| Temperature 1 | 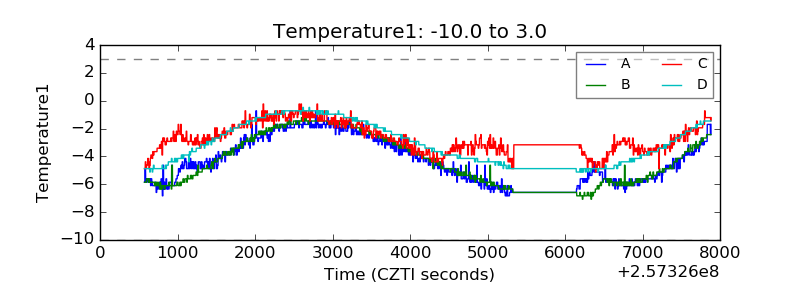 |
| Veto HV Monitor | 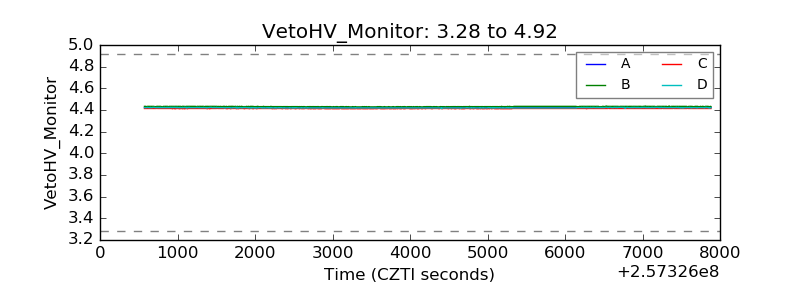 |
| Veto LLD | 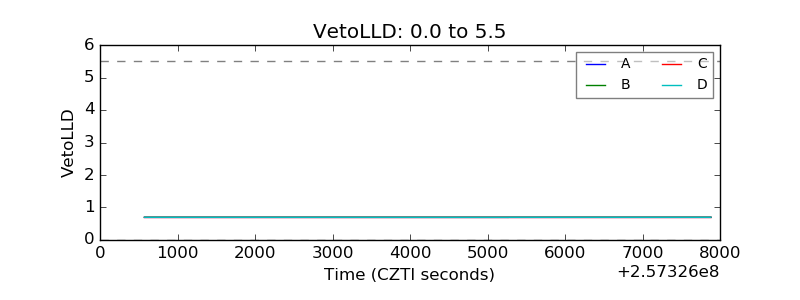 |
| Alpha Counter | 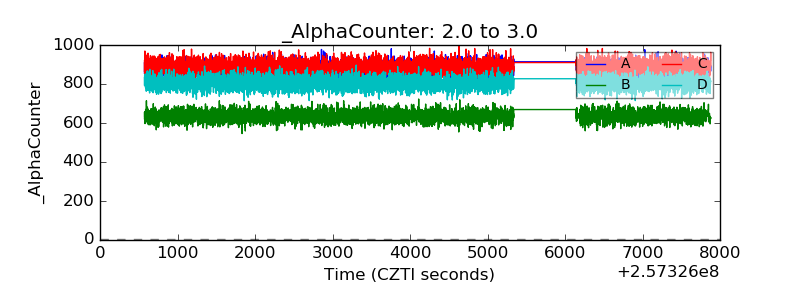 |
| _CPM_Rate | 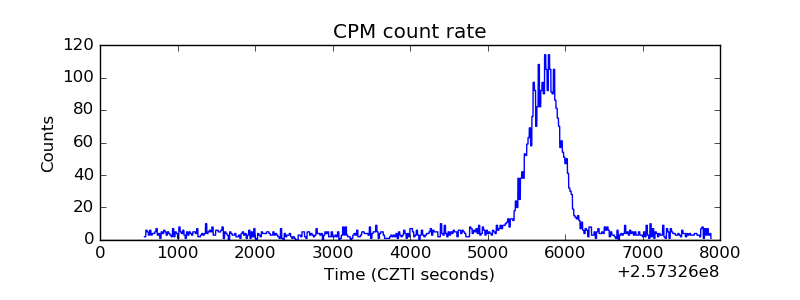 |
| CZT Counter | 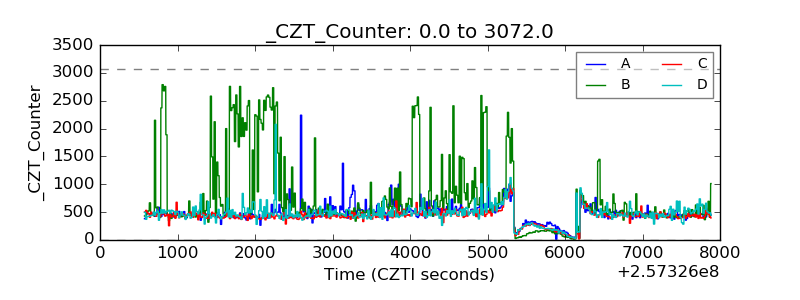 |
| +2.5 Volts monitor |  |
| +5 Volts monitor |  |
| _ROLL_ROT |  |
| _Roll_DEC | 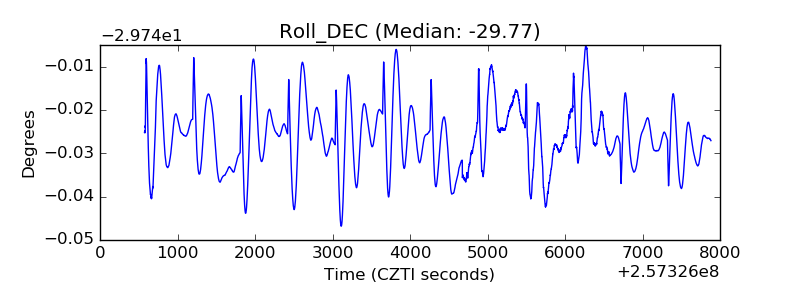 |
| _Roll_RA | 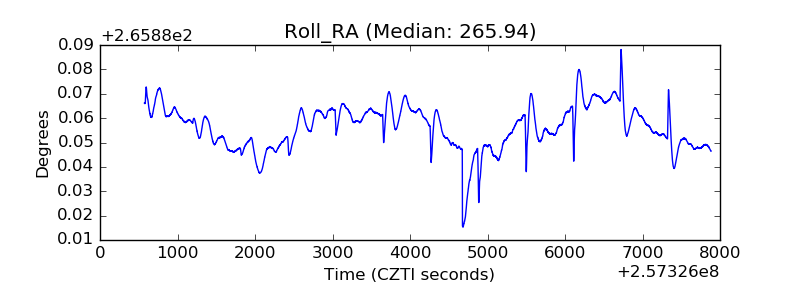 |
| Veto Counter | 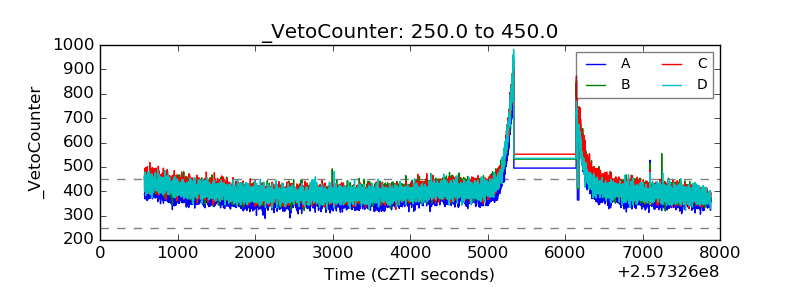 |