| Param | Original file | Final file |
|---|---|---|
| Filename | modeM0/AS1G08_045T01_9000001920_13059cztM0_level2.evt | modeM0/AS1G08_045T01_9000001920_13059cztM0_level2_quad_clean.evt |
| Size (bytes) | 631,252,800 | 86,319,360 |
| Size | 602.0 MB | 82.3 MB |
| Events in quadrant A | 3,562,641 | 570,309 |
| Events in quadrant B | 7,789,501 | 423,077 |
| Events in quadrant C | 3,210,052 | 582,485 |
| Events in quadrant D | 4,077,498 | 546,650 |
| Mode SS | |||
|---|---|---|---|
| Quadrant | BADHDUFLAG | Total packets | Discarded packets |
| A | 0 | 144 | 0 |
| B | 0 | 144 | 0 |
| C | 0 | 144 | 0 |
| D | 0 | 144 | 0 |
| Mode M0 | |||
|---|---|---|---|
| Quadrant | BADHDUFLAG | Total packets | Discarded packets |
| A | 0 | 15102 | 2 |
| B | 0 | 27791 | 1 |
| C | 0 | 14400 | 1 |
| D | 0 | 16757 | 1 |
| Mode M9 | |||
|---|---|---|---|
| Quadrant | BADHDUFLAG | Total packets | Discarded packets |
| A | 0 | 4 | 0 |
| B | 0 | 4 | 0 |
| C | 0 | 4 | 0 |
| D | 0 | 4 | 0 |
| Quadrant | Total seconds | Saturated seconds | Saturation percentage |
|---|---|---|---|
| A | 7038 | 171 | 2.429668% |
| B | 7038 | 2196 | 31.202046% |
| C | 7038 | 126 | 1.790281% |
| D | 7038 | 242 | 3.438477% |
Noise dominated data is calculated using 1-second bins in cleaned event files. If a bin has >2000 counts, and if more than 50% of those come from <1% of pixels, then it is considered to be noise-dominated and hence unusable.
| Quadrant | # 1 sec bins | Bins with >0 counts | Bins with >2000 counts | High rate bins dominated by noise | Noise dominated (total time) | Noise dominated (detector-on time) | Marked lightcurve |
|---|---|---|---|---|---|---|---|
| A | 7445 | 7041 | 6 | 6 | 0.08% | 0.09% | 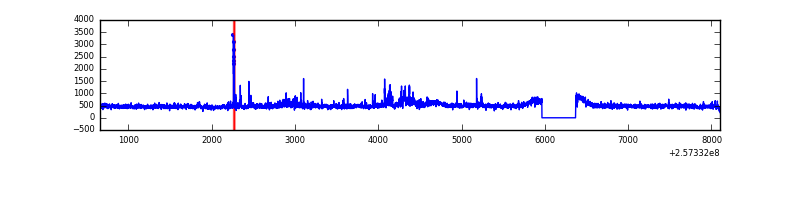 |
| B | 7445 | 7041 | 1454 | 1454 | 19.53% | 20.65% | 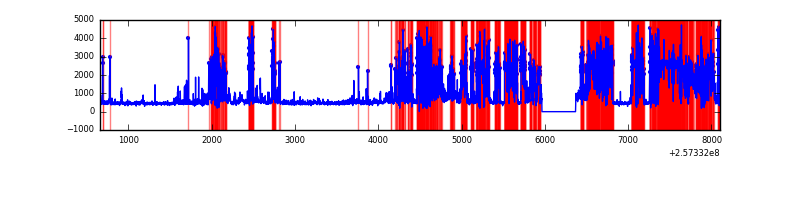 |
| C | 7445 | 7041 | 0 | 0 | 0.00% | 0.00% | 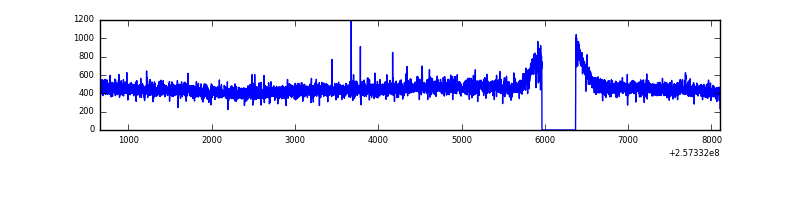 |
| D | 7445 | 7041 | 91 | 91 | 1.22% | 1.29% | 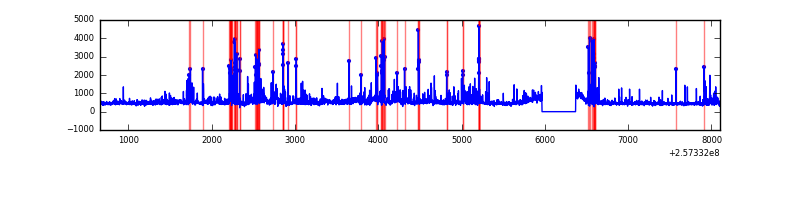 |
Top three noisy pixels from each quadrant. If the there are fewer than three noisy pixels in the level2.evt file, extra rows are filled as -1
| Pixel properties | Quadrant properties | ||||||
|---|---|---|---|---|---|---|---|
| Quadrant | DetID | PixID | Counts | Sigma | Mean | Median | Sigma |
| A | 12 | 189 | 182080 | 1056.12 | 832 | 812 | 171.6 |
| A | 8 | 192 | 48400 | 277.26 | 832 | 812 | 171.6 |
| A | 15 | 223 | 44839 | 256.51 | 832 | 812 | 171.6 |
| B | 4 | 239 | 4709750 | 37033.58 | 664 | 647 | 127.2 |
| B | 0 | 85 | 182374 | 1429.15 | 664 | 647 | 127.2 |
| B | 3 | 64 | 140279 | 1098.1 | 664 | 647 | 127.2 |
| C | 3 | 248 | 7752 | 36.51 | 820 | 823 | 189.8 |
| C | 13 | 61 | 5850 | 26.49 | 820 | 823 | 189.8 |
| C | 12 | 4 | 3715 | 15.24 | 820 | 823 | 189.8 |
| D | 1 | 52 | 792220 | 4045.71 | 810 | 786 | 195.6 |
| D | 8 | 195 | 193795 | 986.64 | 810 | 786 | 195.6 |
| D | 2 | 234 | 22770 | 112.38 | 810 | 786 | 195.6 |
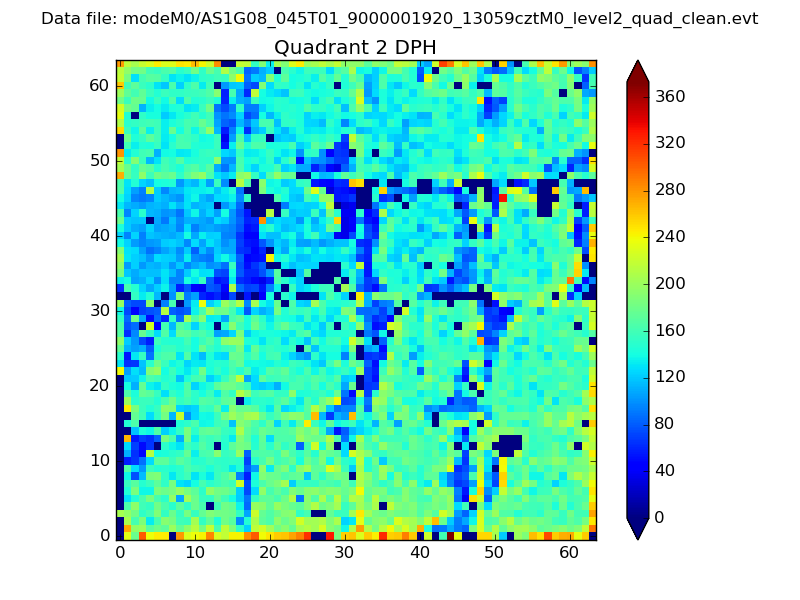
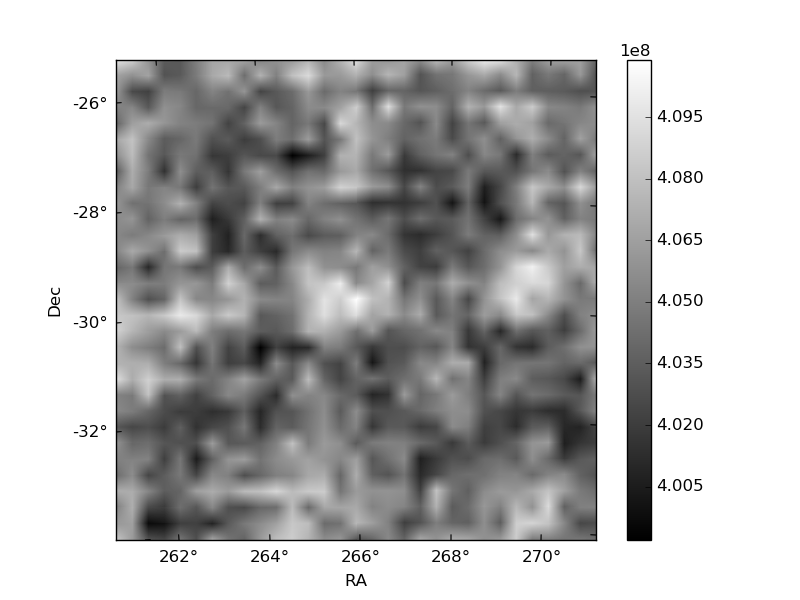
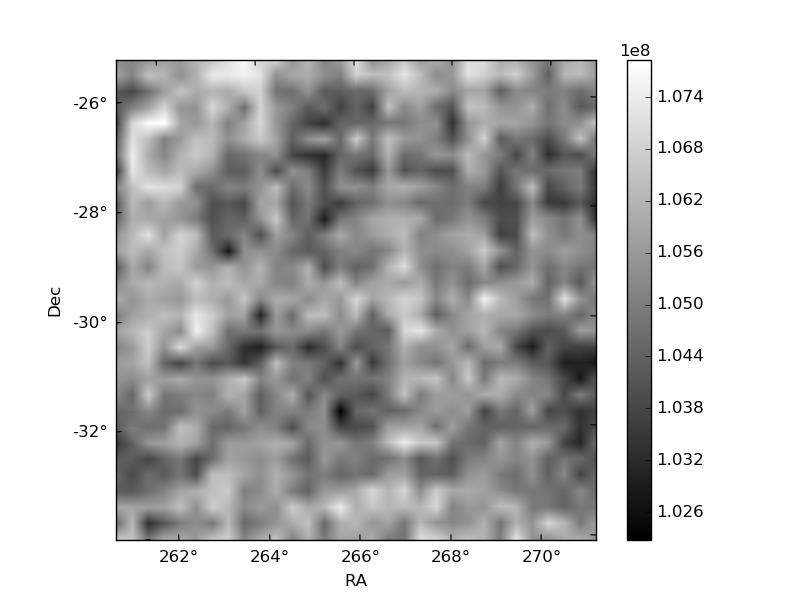
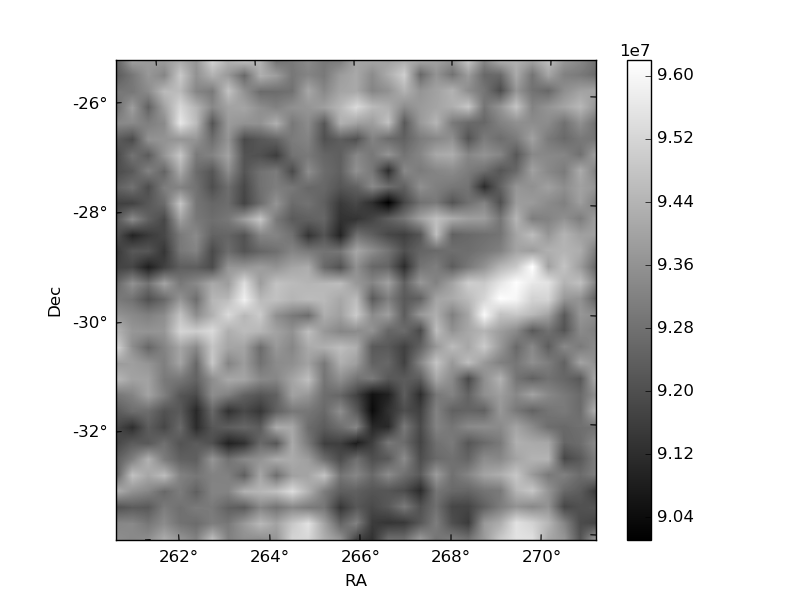
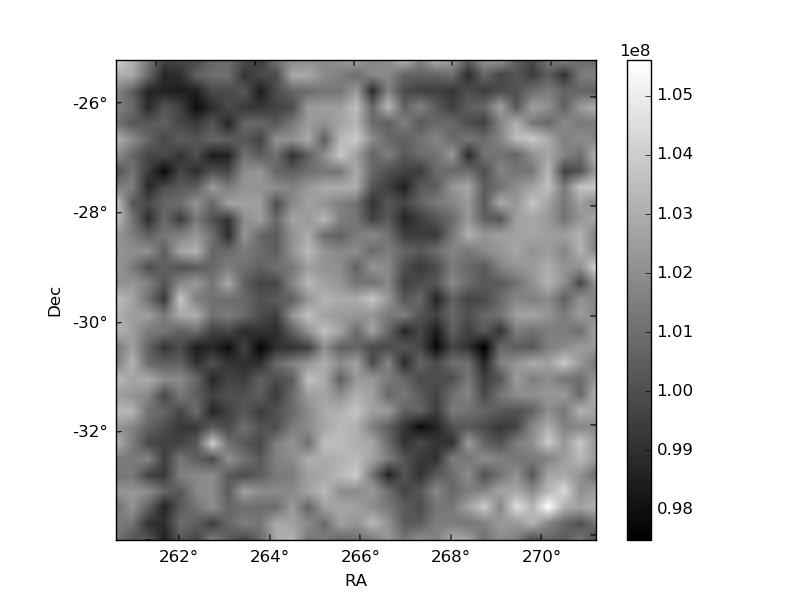
Histogram calculated using DETX and DETY for each event in the final _common_clean file
| Quadrant A | 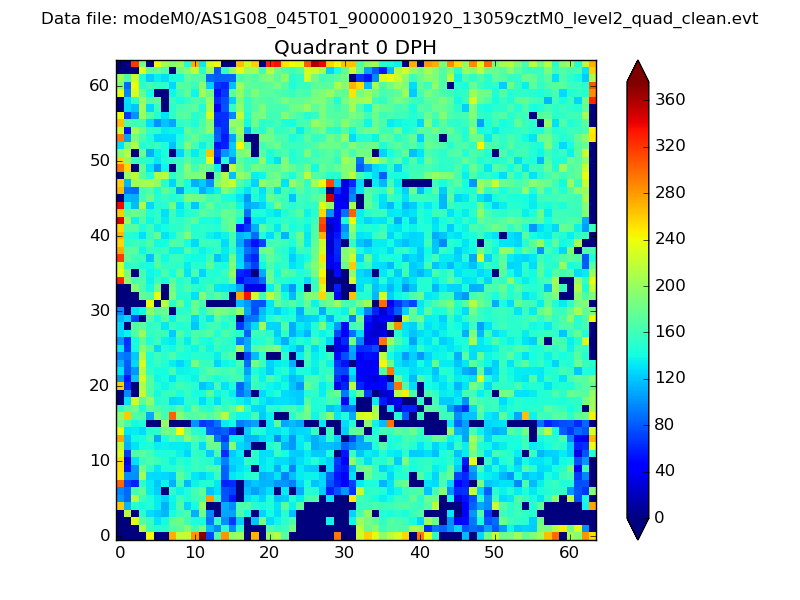 |
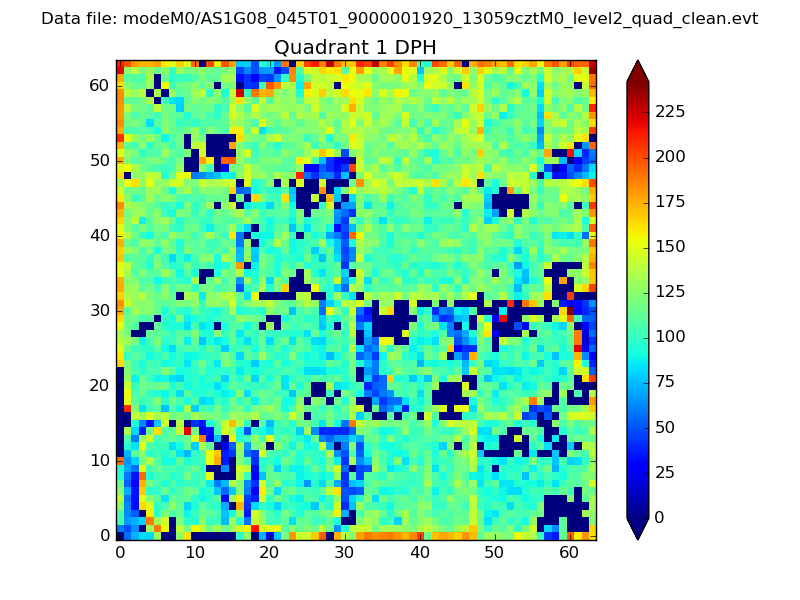 |
Quadrant B |
|---|---|---|---|
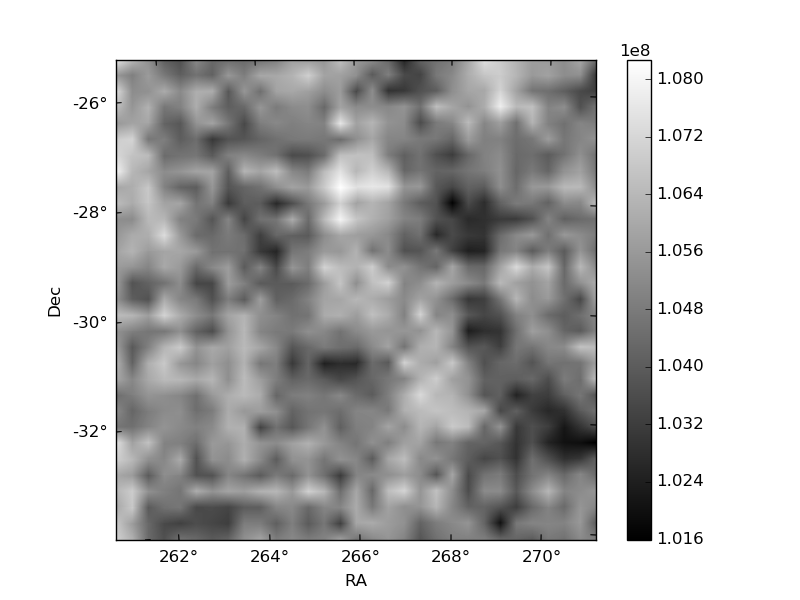
| Quadrant D | 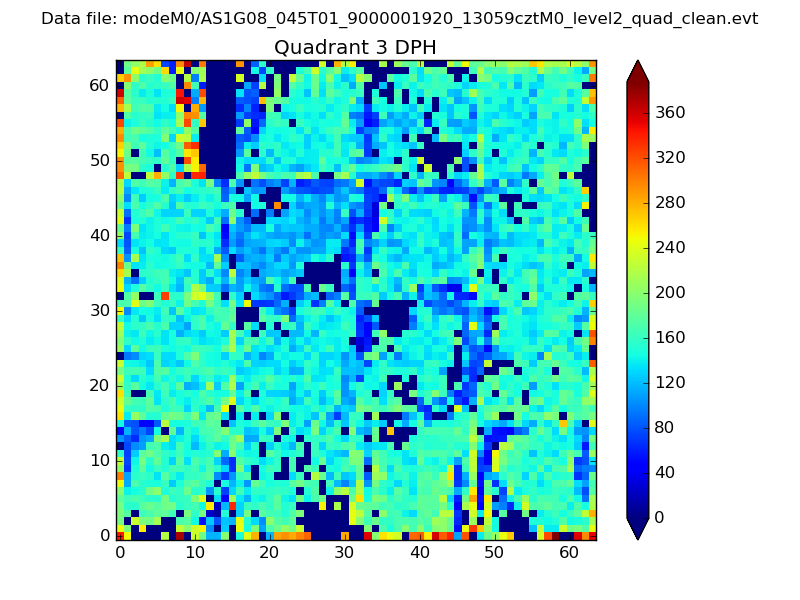 |
 |
Quadrant C |
| Plot type | Count rate plots | Images |
|---|---|---|
| Comparison with Poisson distribution Blue bars denote a histogram of data divided into 1 sec bins. Red curve is a Poisson curve with rate = median count rate of data. |
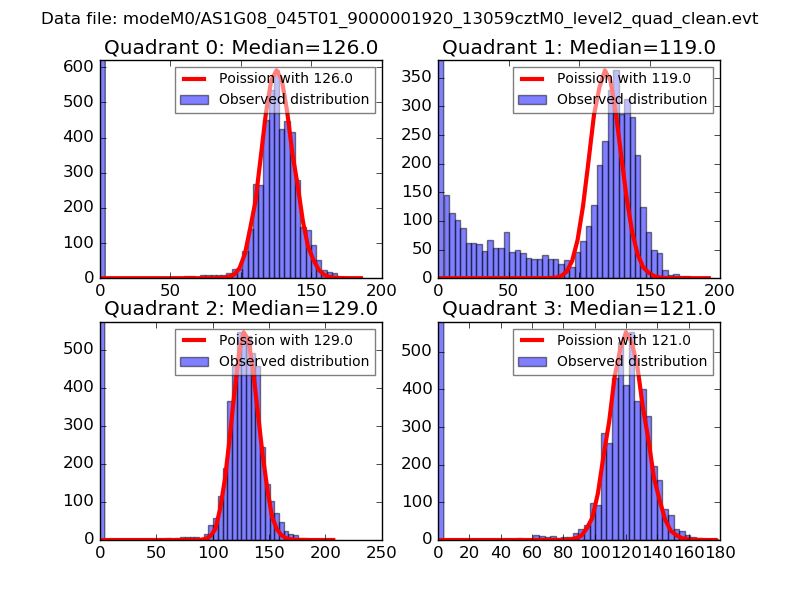 |
 |
| Quadrant-wise count rates Data is divided into 100 sec bins |
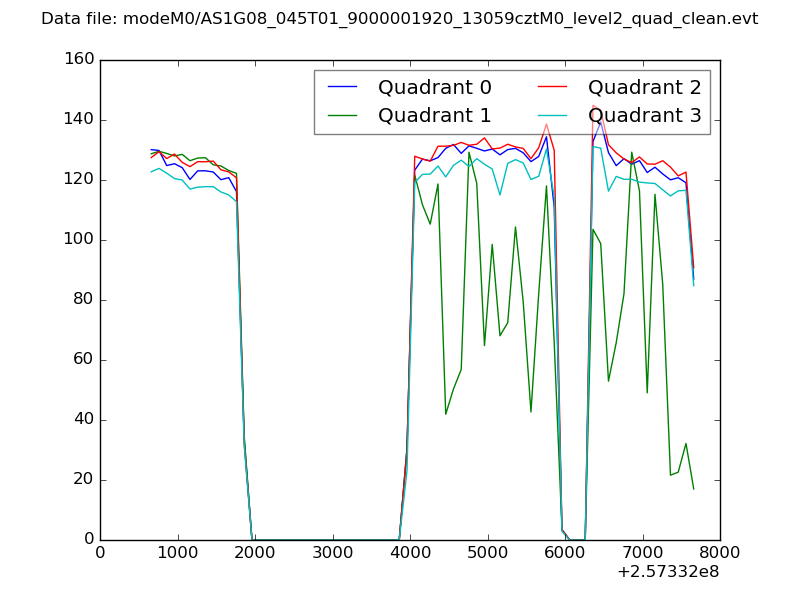 |
|
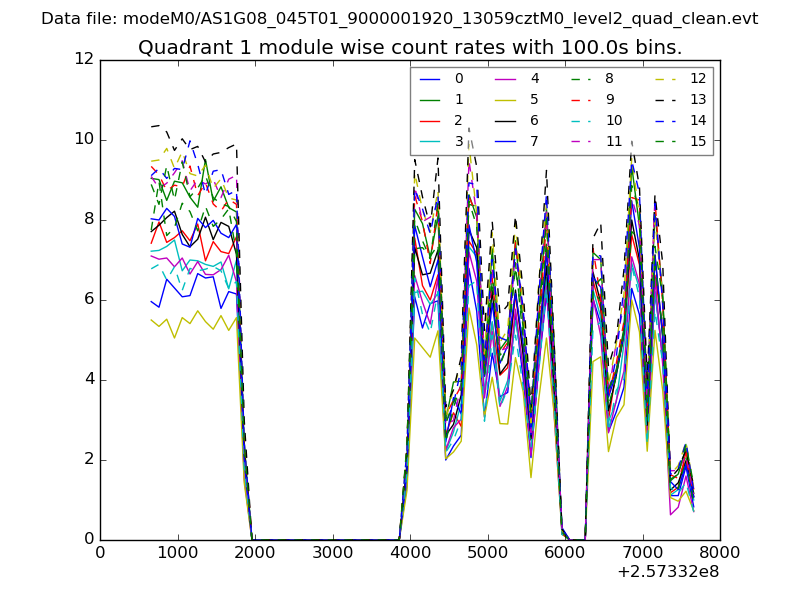
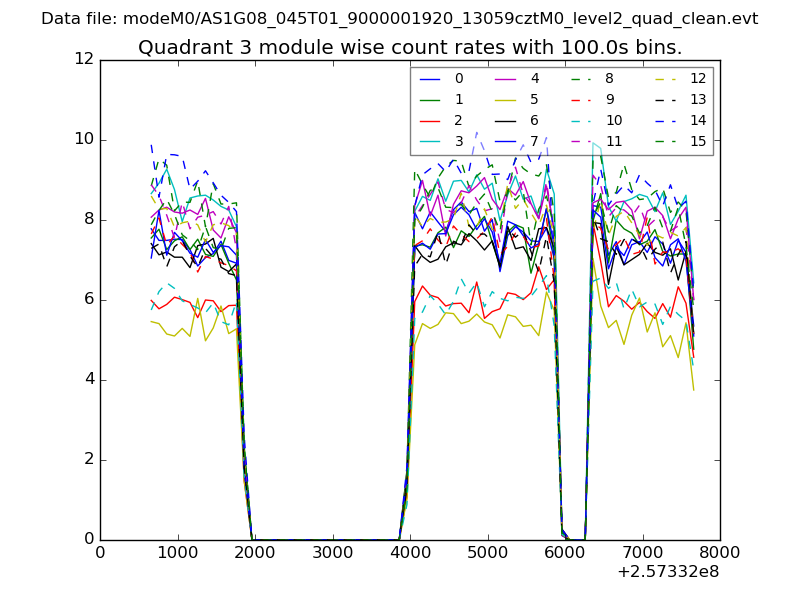
| Module-wise count rates for Quadrant A Data is divided into 100 sec bins |
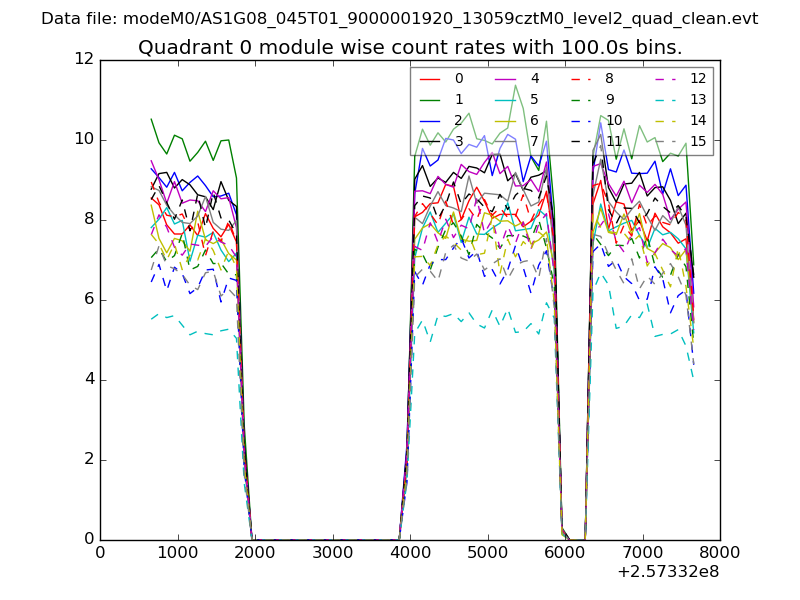 |
 |
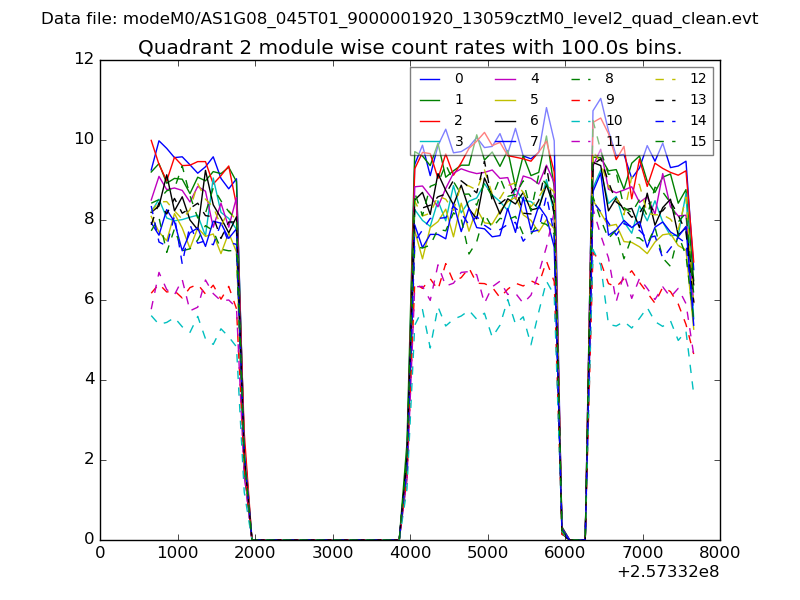
| Module-wise count rates for Quadrant B Data is divided into 100 sec bins |
 |
 |
| Module-wise count rates for Quadrant C Data is divided into 100 sec bins |
 |
 |
| Module-wise count rates for Quadrant D Data is divided into 100 sec bins |
 |
 |
| Parameter | Plot |
|---|---|
| CZT HV Monitor | 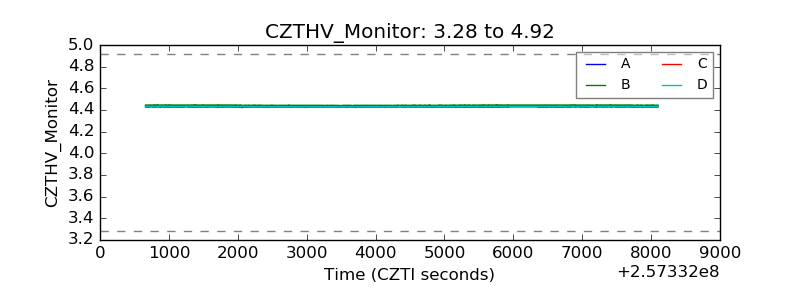 |
| D_VDD | 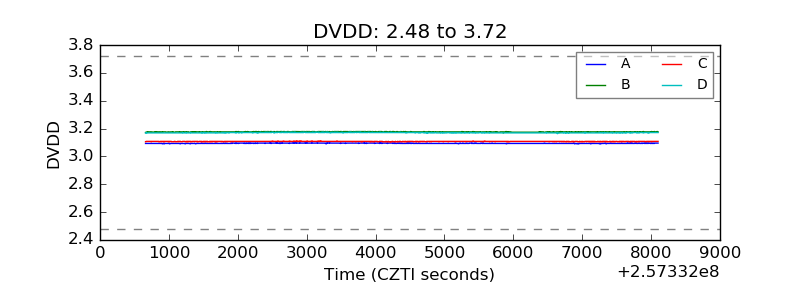 |
| Temperature 1 | 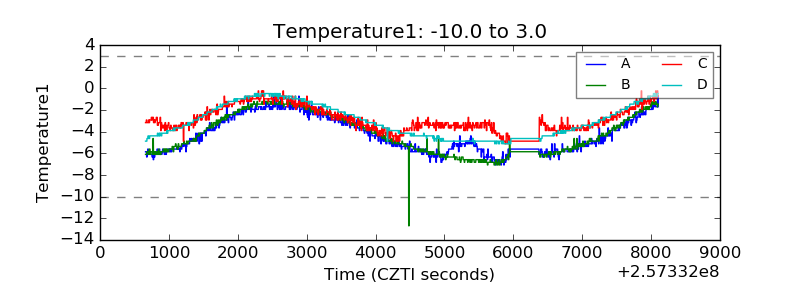 |
| Veto HV Monitor | 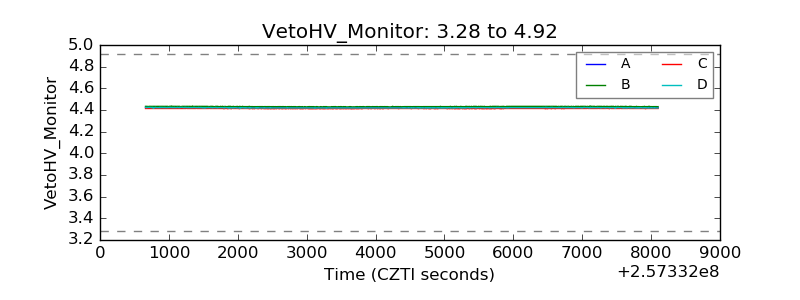 |
| Veto LLD |  |
| Alpha Counter | 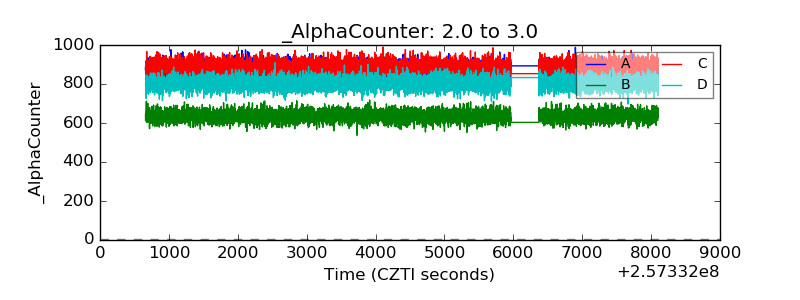 |
| _CPM_Rate | 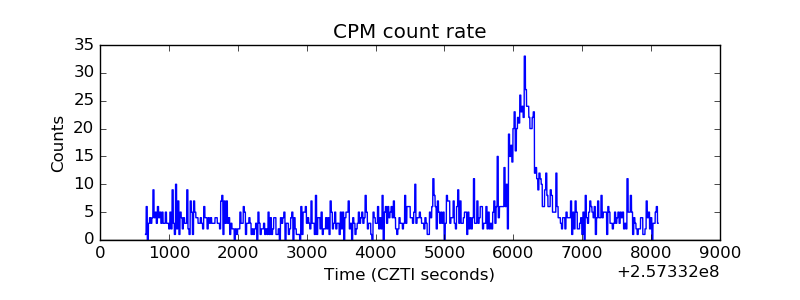 |
| CZT Counter | 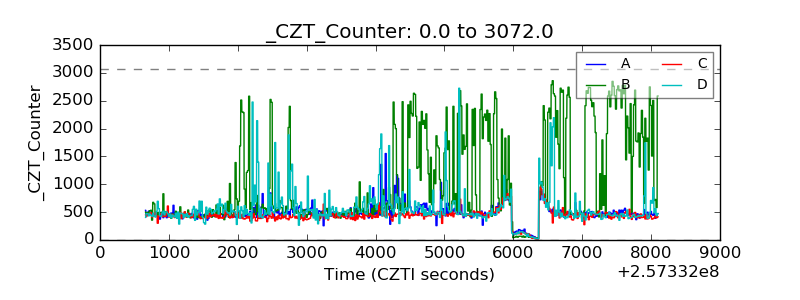 |
| +2.5 Volts monitor |  |
| +5 Volts monitor | 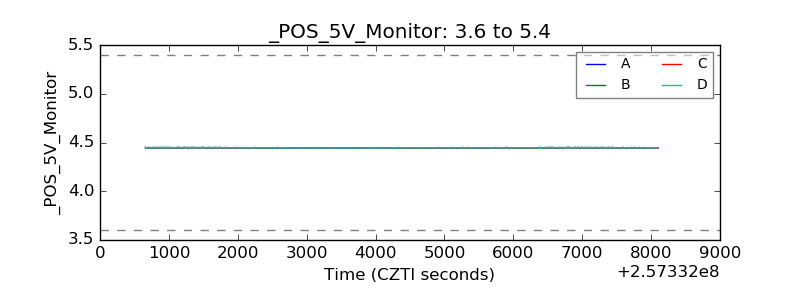 |
| _ROLL_ROT | 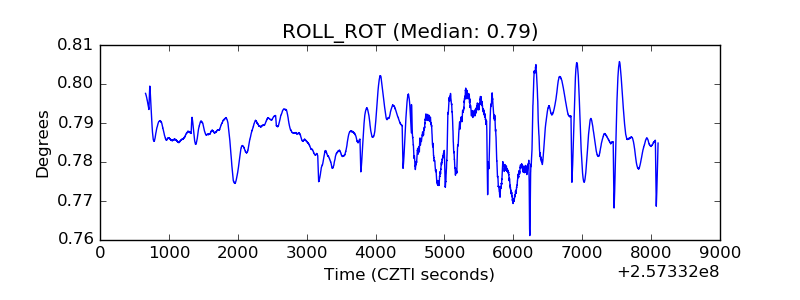 |
| _Roll_DEC | 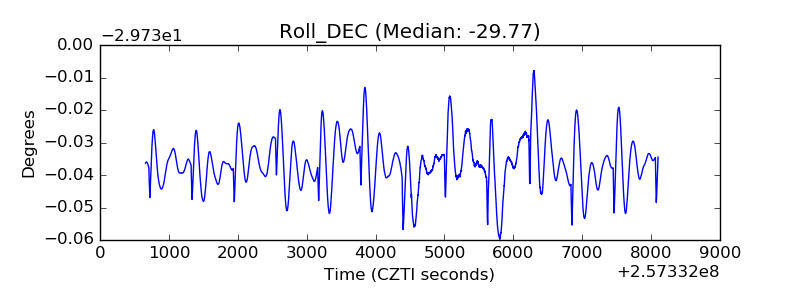 |
| _Roll_RA | 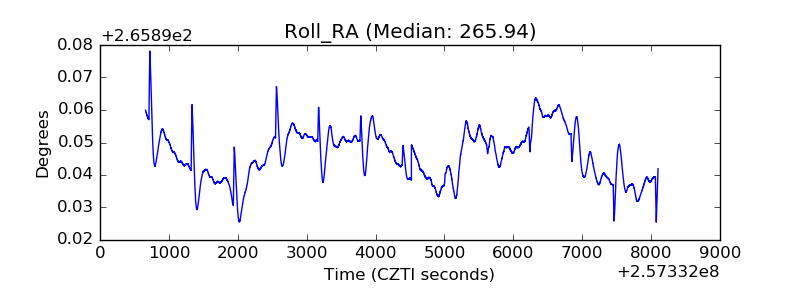 |
| Veto Counter | 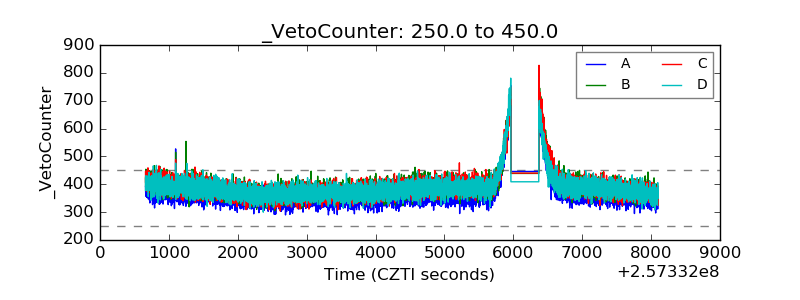 |