| Param | Original file | Final file |
|---|---|---|
| Filename | modeM0/AS1G08_045T01_9000001920_13060cztM0_level2.evt | modeM0/AS1G08_045T01_9000001920_13060cztM0_level2_quad_clean.evt |
| Size (bytes) | 381,720,960 | 43,747,200 |
| Size | 364.0 MB | 41.7 MB |
| Events in quadrant A | 2,066,870 | 272,069 |
| Events in quadrant B | 5,063,795 | 212,705 |
| Events in quadrant C | 1,869,636 | 274,360 |
| Events in quadrant D | 2,265,580 | 260,573 |
| Mode SS | |||
|---|---|---|---|
| Quadrant | BADHDUFLAG | Total packets | Discarded packets |
| A | 0 | 86 | 0 |
| B | 0 | 86 | 0 |
| C | 0 | 86 | 0 |
| D | 0 | 86 | 0 |
| Mode M0 | |||
|---|---|---|---|
| Quadrant | BADHDUFLAG | Total packets | Discarded packets |
| A | 0 | 8869 | 0 |
| B | 0 | 17875 | 0 |
| C | 0 | 8659 | 0 |
| D | 0 | 9699 | 0 |
| Quadrant | Total seconds | Saturated seconds | Saturation percentage |
|---|---|---|---|
| A | 4323 | 8 | 0.185057% |
| B | 4323 | 1362 | 31.505899% |
| C | 4323 | 3 | 0.069396% |
| D | 4323 | 39 | 0.902151% |
Noise dominated data is calculated using 1-second bins in cleaned event files. If a bin has >2000 counts, and if more than 50% of those come from <1% of pixels, then it is considered to be noise-dominated and hence unusable.
| Quadrant | # 1 sec bins | Bins with >0 counts | Bins with >2000 counts | High rate bins dominated by noise | Noise dominated (total time) | Noise dominated (detector-on time) | Marked lightcurve |
|---|---|---|---|---|---|---|---|
| A | 4324 | 4324 | 4 | 4 | 0.09% | 0.09% | 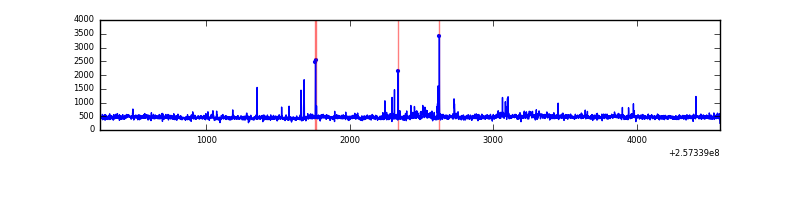 |
| B | 4324 | 4324 | 891 | 891 | 20.61% | 20.61% | 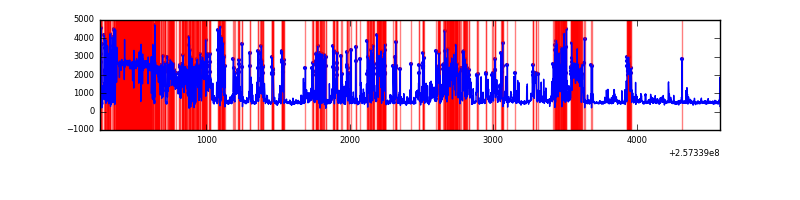 |
| C | 4324 | 4324 | 0 | 0 | 0.00% | 0.00% | 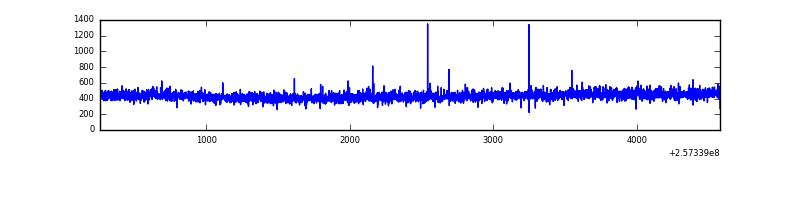 |
| D | 4324 | 4324 | 25 | 25 | 0.58% | 0.58% | 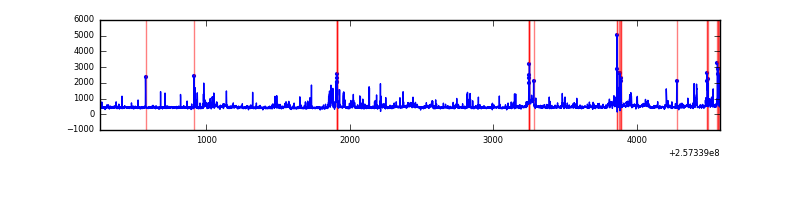 |
Top three noisy pixels from each quadrant. If the there are fewer than three noisy pixels in the level2.evt file, extra rows are filled as -1
| Pixel properties | Quadrant properties | ||||||
|---|---|---|---|---|---|---|---|
| Quadrant | DetID | PixID | Counts | Sigma | Mean | Median | Sigma |
| A | 12 | 189 | 73795 | 728.6 | 488 | 478 | 100.6 |
| A | 8 | 15 | 38600 | 378.84 | 488 | 478 | 100.6 |
| A | 8 | 192 | 26056 | 254.19 | 488 | 478 | 100.6 |
| B | 4 | 239 | 3111221 | 41279.57 | 387 | 377 | 75.4 |
| B | 3 | 64 | 160875 | 2129.74 | 387 | 377 | 75.4 |
| B | 0 | 85 | 97322 | 1286.42 | 387 | 377 | 75.4 |
| C | 13 | 61 | 3479 | 27.02 | 477 | 481 | 111.0 |
| C | 3 | 248 | 3203 | 24.53 | 477 | 481 | 111.0 |
| C | 14 | 234 | 2910 | 21.89 | 477 | 481 | 111.0 |
| D | 1 | 52 | 252425 | 2167.46 | 474 | 459 | 116.2 |
| D | 8 | 195 | 166753 | 1430.5 | 474 | 459 | 116.2 |
| D | 1 | 7 | 30926 | 262.08 | 474 | 459 | 116.2 |
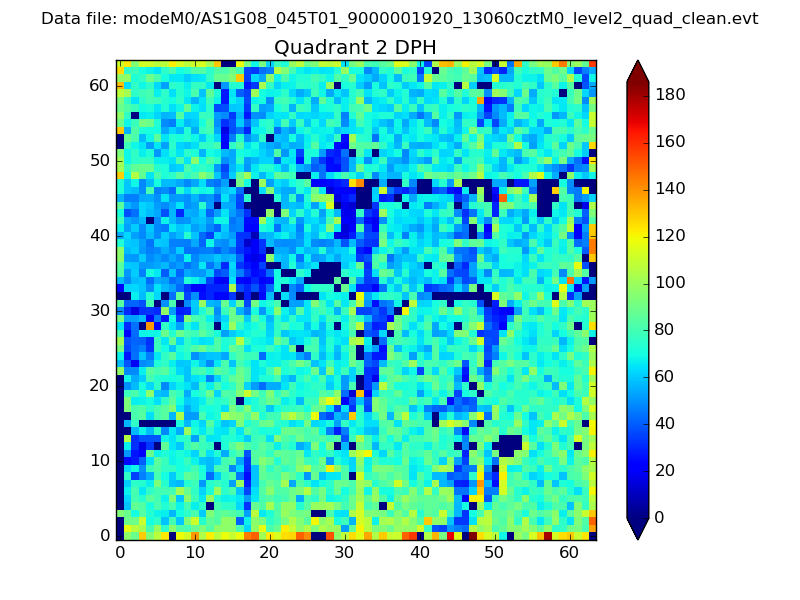
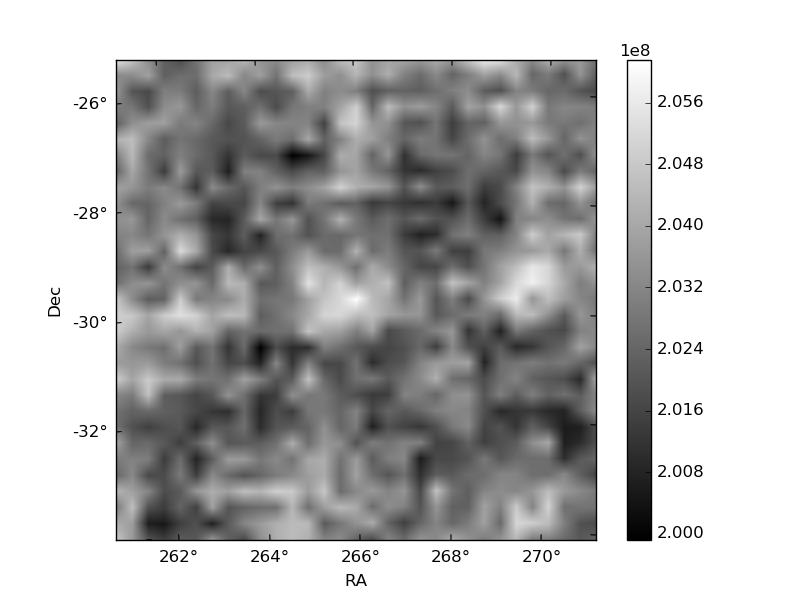
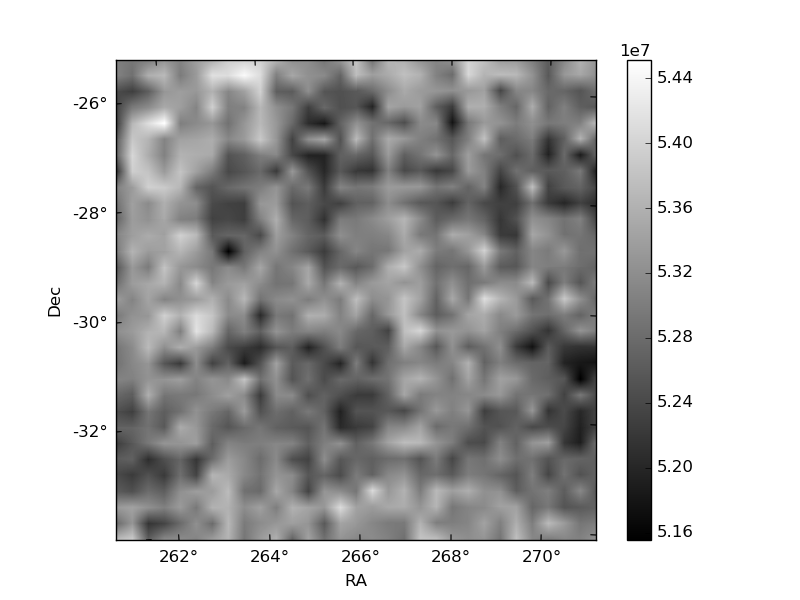
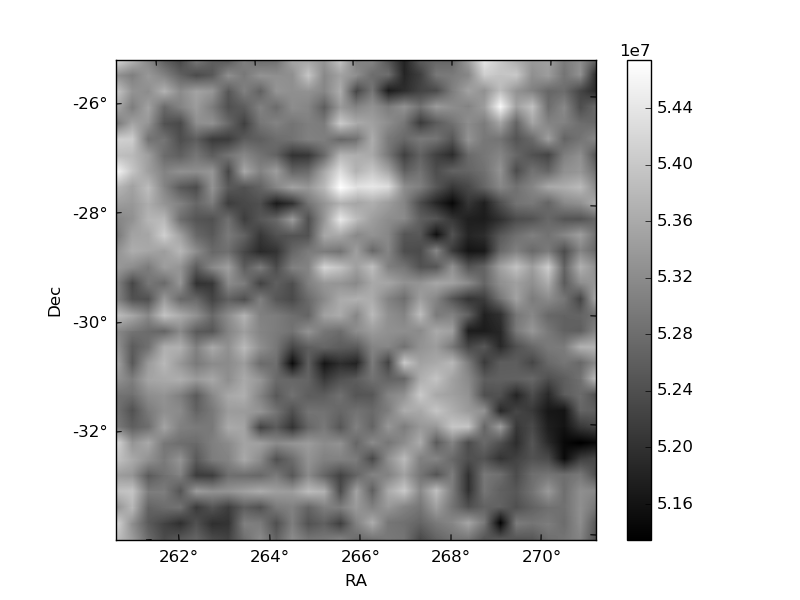
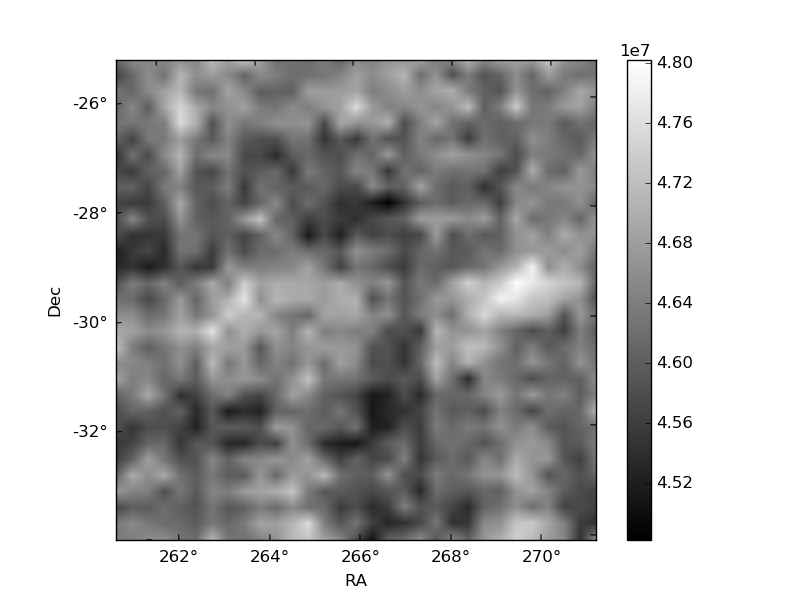
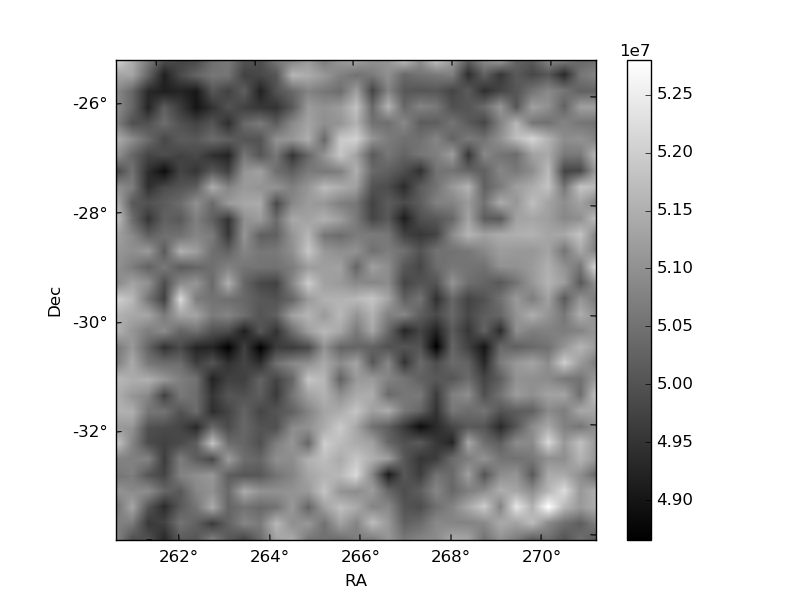
Histogram calculated using DETX and DETY for each event in the final _common_clean file
| Quadrant A | 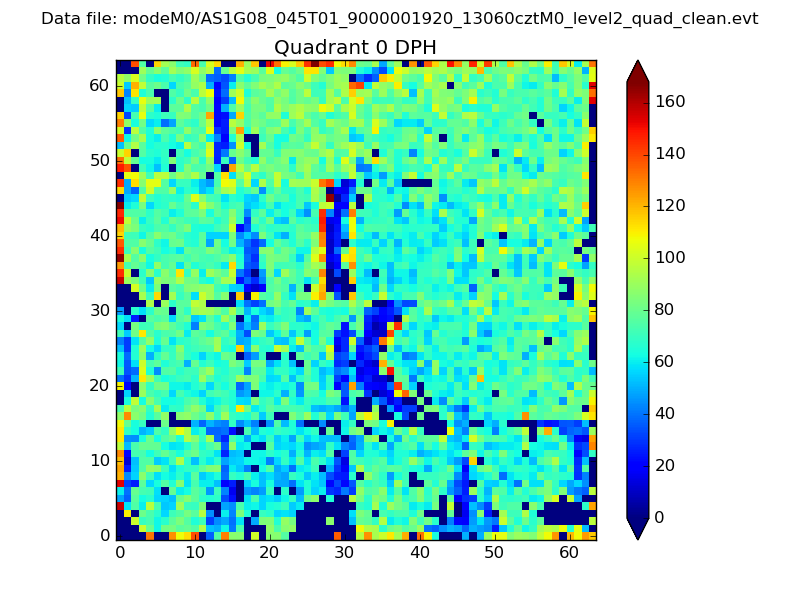 |
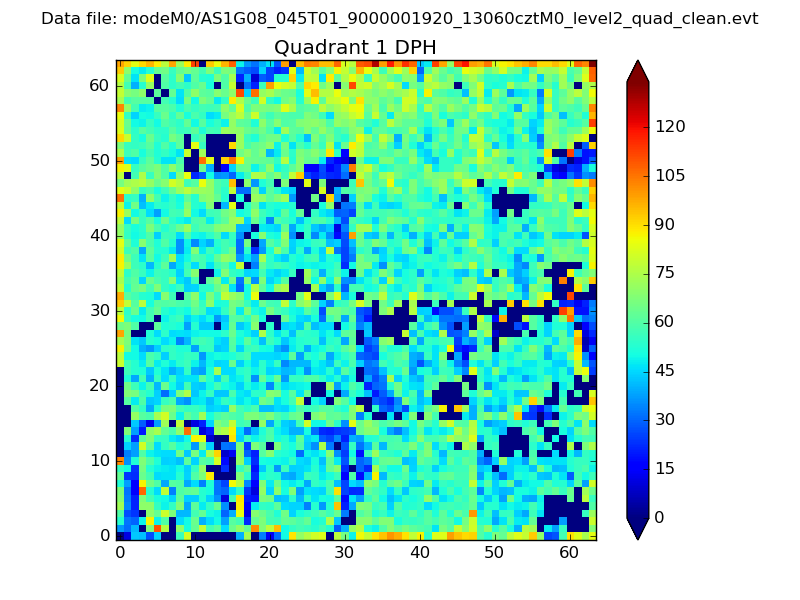 |
Quadrant B |
|---|---|---|---|
| Quadrant D | 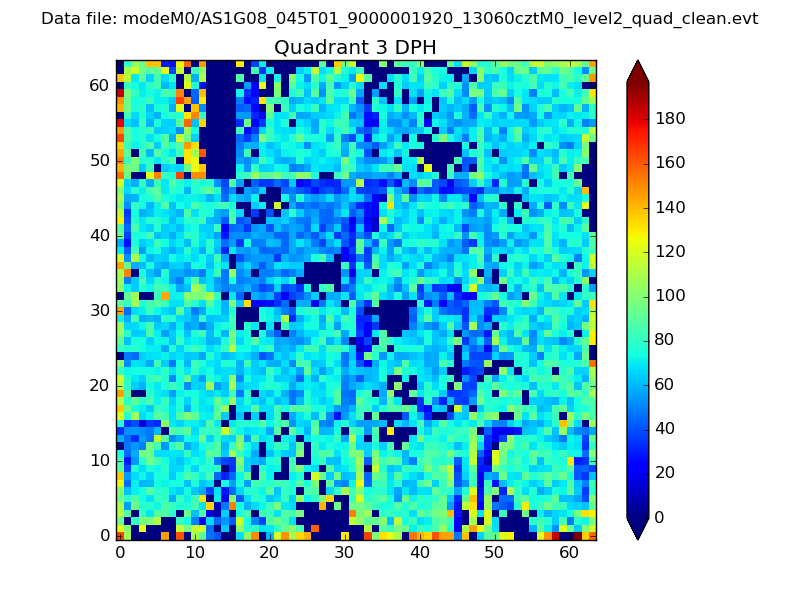 |
 |
Quadrant C |
| Plot type | Count rate plots | Images |
|---|---|---|
| Comparison with Poisson distribution Blue bars denote a histogram of data divided into 1 sec bins. Red curve is a Poisson curve with rate = median count rate of data. |
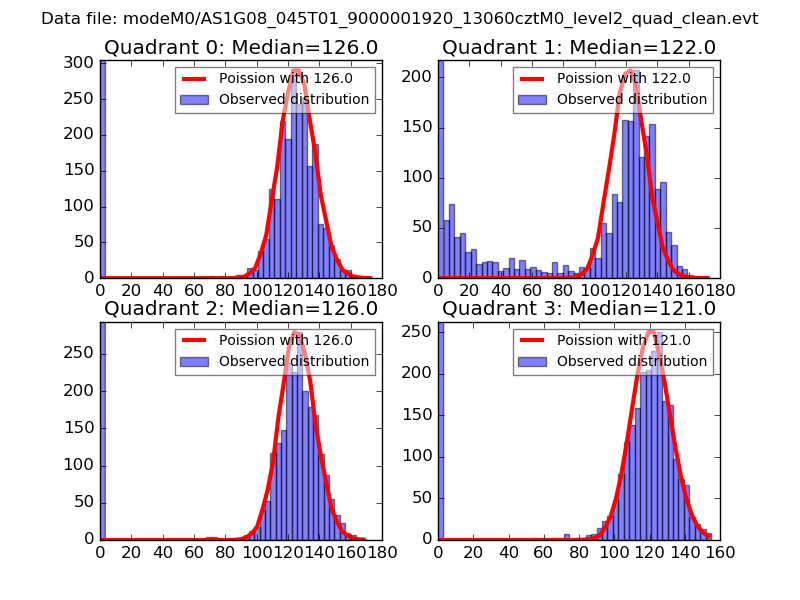 |
 |
| Quadrant-wise count rates Data is divided into 100 sec bins |
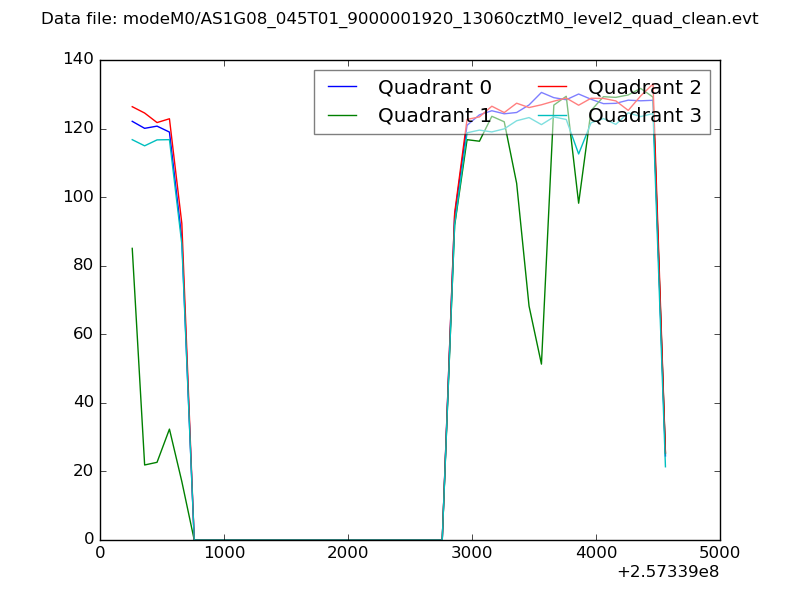 |
|
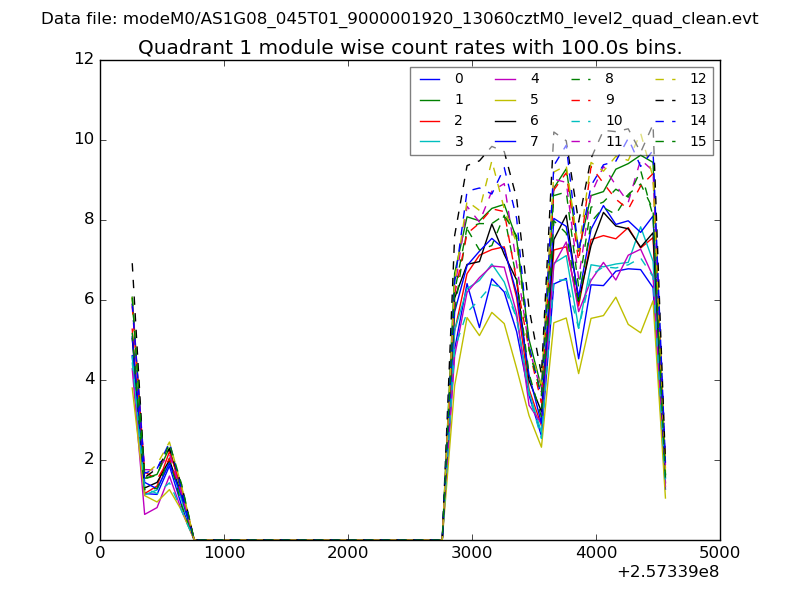
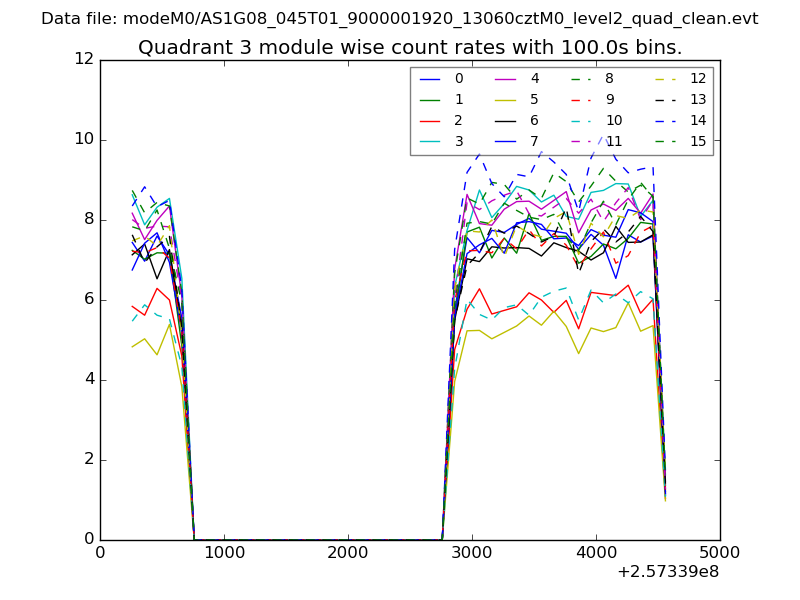
| Module-wise count rates for Quadrant A Data is divided into 100 sec bins |
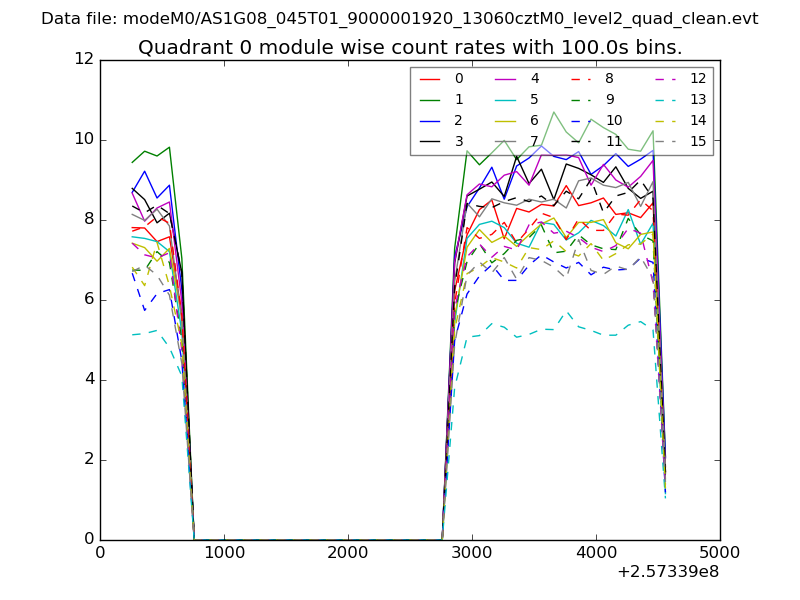 |
 |
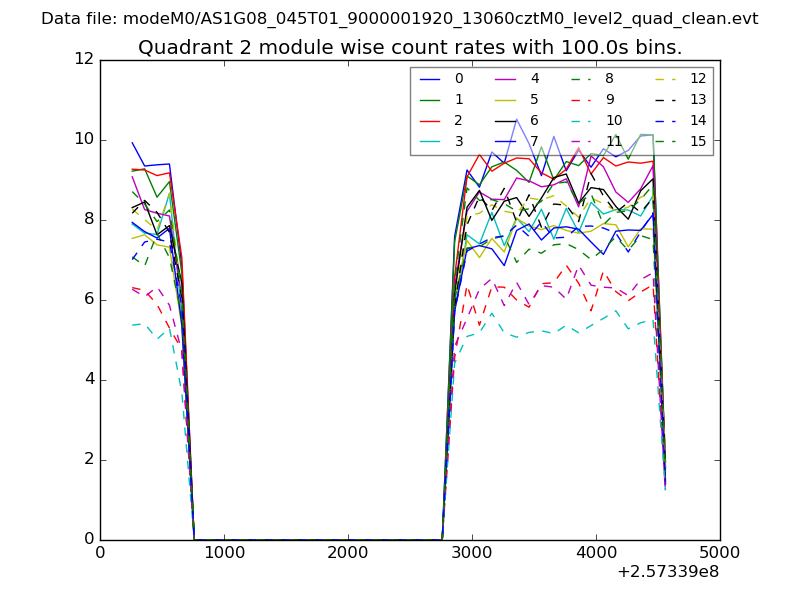
| Module-wise count rates for Quadrant B Data is divided into 100 sec bins |
 |
 |
| Module-wise count rates for Quadrant C Data is divided into 100 sec bins |
 |
 |
| Module-wise count rates for Quadrant D Data is divided into 100 sec bins |
 |
 |
| Parameter | Plot |
|---|---|
| CZT HV Monitor | 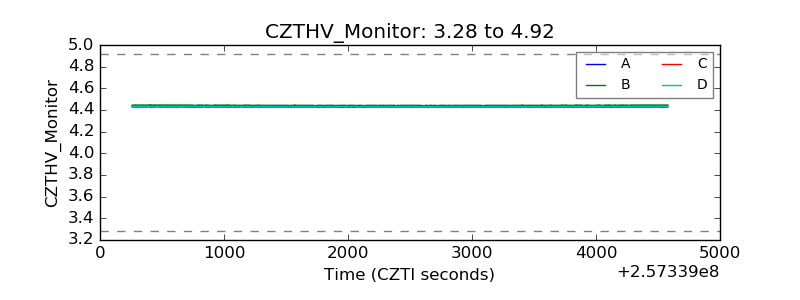 |
| D_VDD | 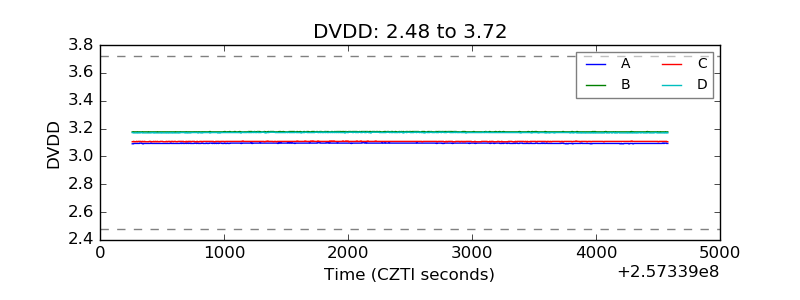 |
| Temperature 1 | 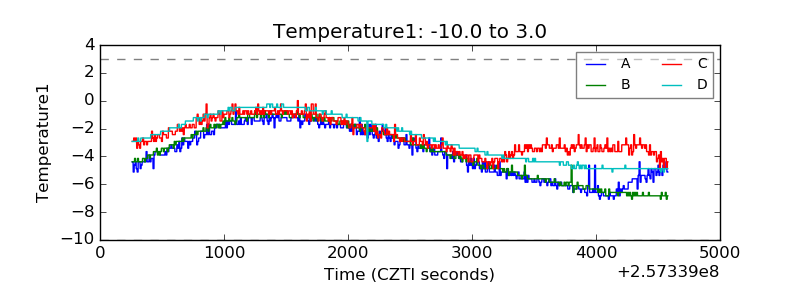 |
| Veto HV Monitor |  |
| Veto LLD | 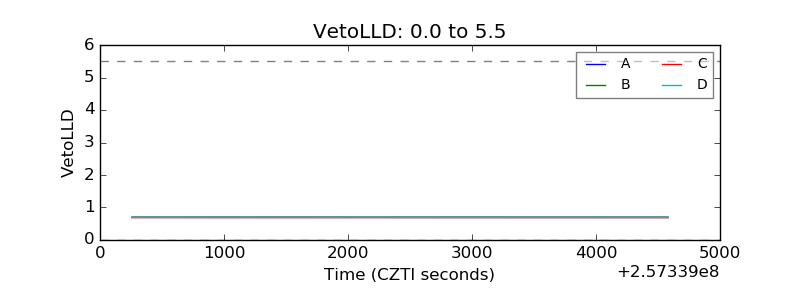 |
| Alpha Counter | 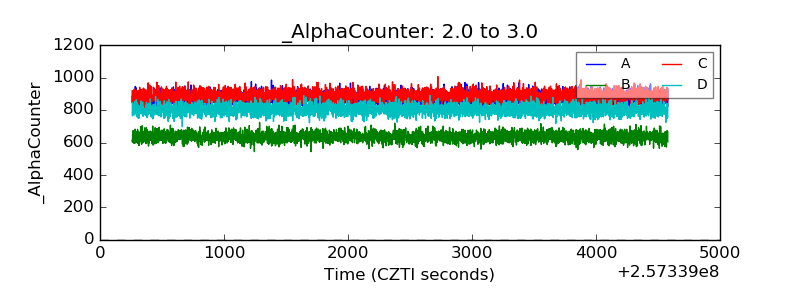 |
| _CPM_Rate | 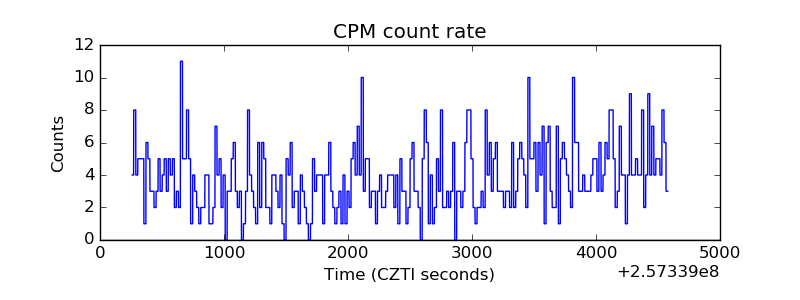 |
| CZT Counter | 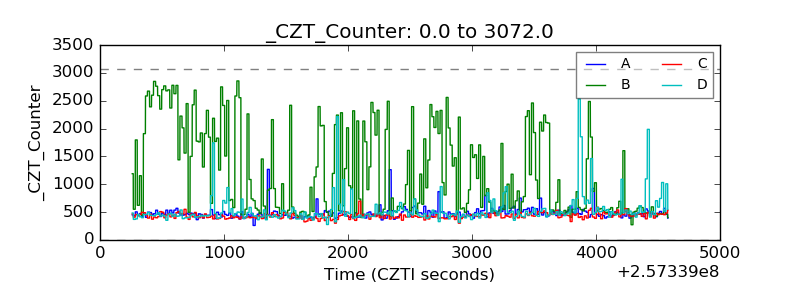 |
| +2.5 Volts monitor |  |
| +5 Volts monitor |  |
| _ROLL_ROT | 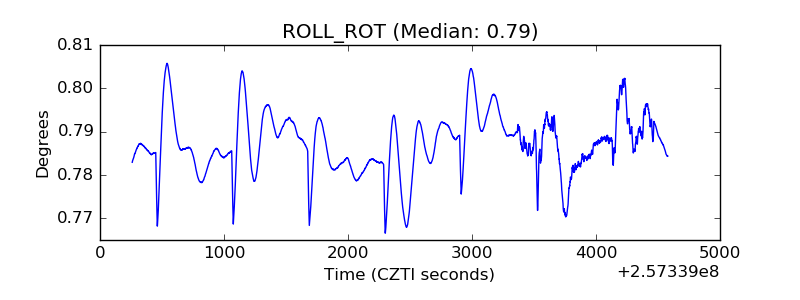 |
| _Roll_DEC | 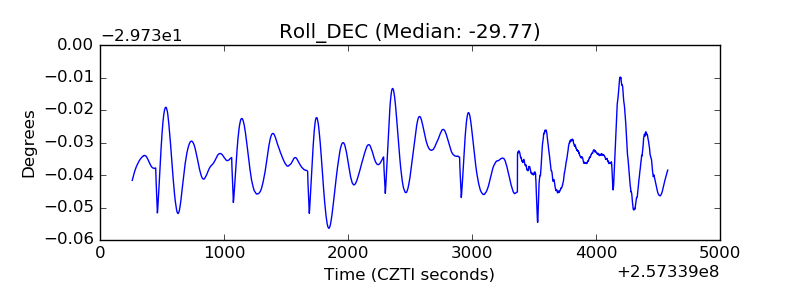 |
| _Roll_RA | 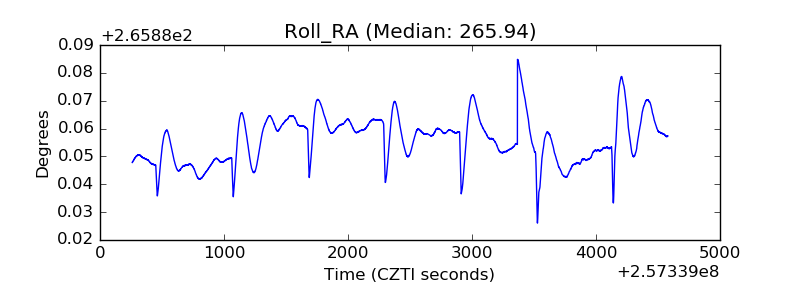 |
| Veto Counter | 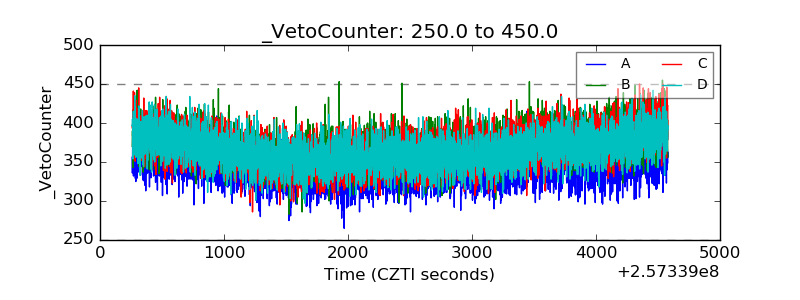 |