| Param | Original file | Final file |
|---|---|---|
| Filename | modeM0/AS1G08_068T01_9000001922cztM0_level2.fits | modeM0/AS1G08_068T01_9000001922cztM0_level2_quad_clean.evt |
| Size (bytes) | 353,070,720 | 367,934,400 |
| Size | 336.7 MB | 350.9 MB |
| Events in quadrant A | 2,194,516 | 2,327,904 |
| Events in quadrant B | 1,900,696 | 2,125,375 |
| Events in quadrant C | 2,209,278 | 2,249,238 |
| Events in quadrant D | 1,694,434 | 1,752,542 |
| Mode M0 | |||
|---|---|---|---|
| Quadrant | BADHDUFLAG | Total packets | Discarded packets |
| A | 0 | 83855 | 0 |
| B | 0 | 130682 | 0 |
| C | 0 | 80234 | 0 |
| D | 0 | 130762 | 0 |
| Mode M9 | |||
|---|---|---|---|
| Quadrant | BADHDUFLAG | Total packets | Discarded packets |
| A | 0 | 68 | 0 |
| B | 0 | 68 | 0 |
| C | 0 | 68 | 0 |
| D | 0 | 68 | 0 |
| Mode SS | |||
|---|---|---|---|
| Quadrant | BADHDUFLAG | Total packets | Discarded packets |
| A | 0 | 798 | 0 |
| B | 0 | 796 | 0 |
| C | 0 | 798 | 0 |
| D | 0 | 796 | 0 |
| Quadrant | Total seconds | Saturated seconds | Saturation percentage |
|---|---|---|---|
| A | 39148 | 622 | 1.588842% |
| B | 39145 | 7185 | 18.354835% |
| C | 39143 | 325 | 0.830289% |
| D | 39140 | 6603 | 16.870210% |
Noise dominated data is calculated using 1-second bins in cleaned event files. If a bin has >2000 counts, and if more than 50% of those come from <1% of pixels, then it is considered to be noise-dominated and hence unusable.
| Quadrant | # 1 sec bins | Bins with >0 counts | Bins with >2000 counts | High rate bins dominated by noise | Noise dominated (total time) | Noise dominated (detector-on time) | Marked lightcurve |
|---|---|---|---|---|---|---|---|
| A | 51077 | 39200 | 0 | 0 | 0.00% | 0.00% | 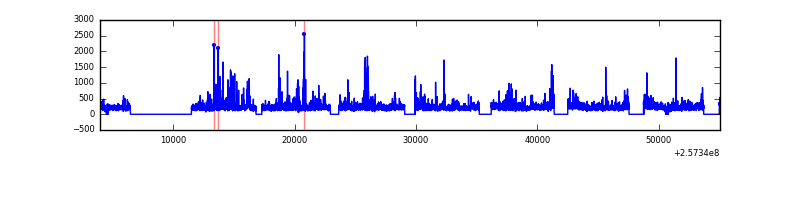 |
| B | 51077 | 38596 | 0 | 0 | 0.00% | 0.00% | 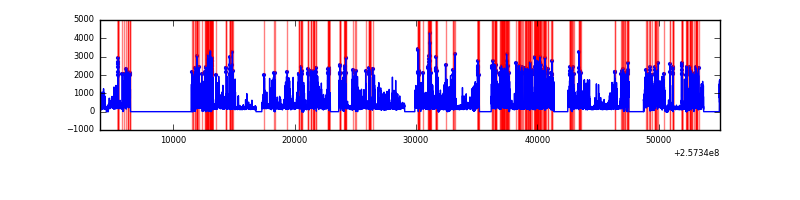 |
| C | 51077 | 39188 | 0 | 0 | 0.00% | 0.00% | 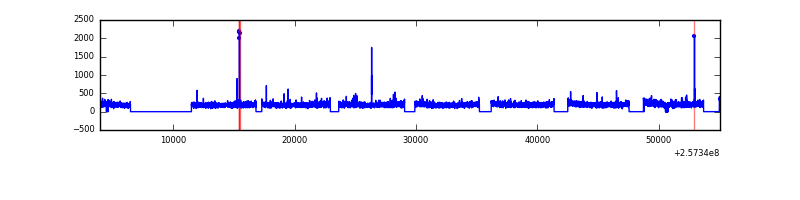 |
| D | 51077 | 39161 | 0 | 0 | 0.00% | 0.00% |  |
Top three noisy pixels from each quadrant. If the there are fewer than three noisy pixels in the level2.evt file, extra rows are filled as -1
| Pixel properties | Quadrant properties | ||||||
|---|---|---|---|---|---|---|---|
| Quadrant | DetID | PixID | Counts | Sigma | Mean | Median | Sigma |
| A | 0 | 29 | 2137 | 11.24 | 572 | 535 | 142.5 |
| A | 7 | 110 | 1834 | 9.12 | 572 | 535 | 142.5 |
| A | 0 | 30 | 1629 | 7.68 | 572 | 535 | 142.5 |
| B | 2 | 9 | 1669 | 11.95 | 500 | 475 | 99.9 |
| B | 3 | 17 | 1317 | 8.43 | 500 | 475 | 99.9 |
| B | 12 | 226 | 1284 | 8.1 | 500 | 475 | 99.9 |
| C | 1 | 81 | 1621 | 7.12 | 583 | 542 | 151.5 |
| C | 1 | 80 | 1611 | 7.06 | 583 | 542 | 151.5 |
| C | 2 | 191 | 1534 | 6.55 | 583 | 542 | 151.5 |
| D | 3 | 14 | 1284 | 6.42 | 483 | 440 | 131.4 |
| D | 6 | 231 | 1208 | 5.85 | 483 | 440 | 131.4 |
| D | 3 | 31 | 1179 | 5.62 | 483 | 440 | 131.4 |
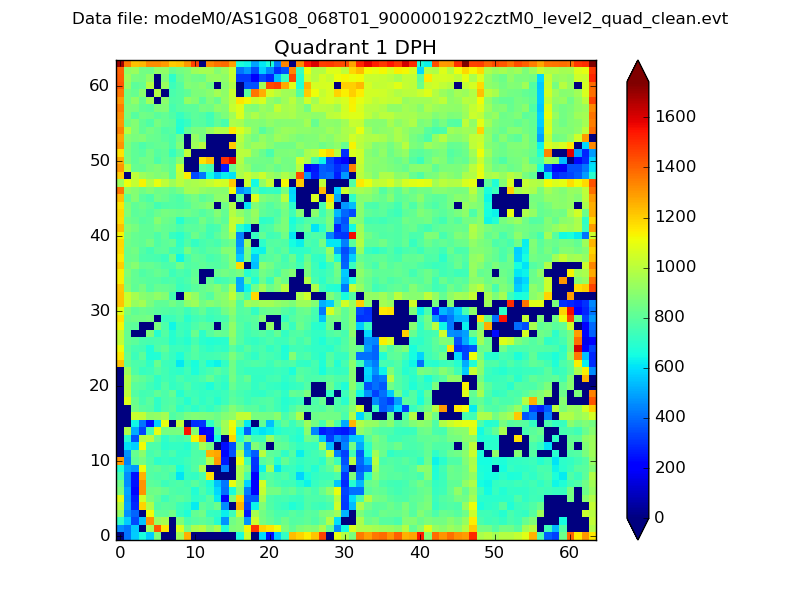
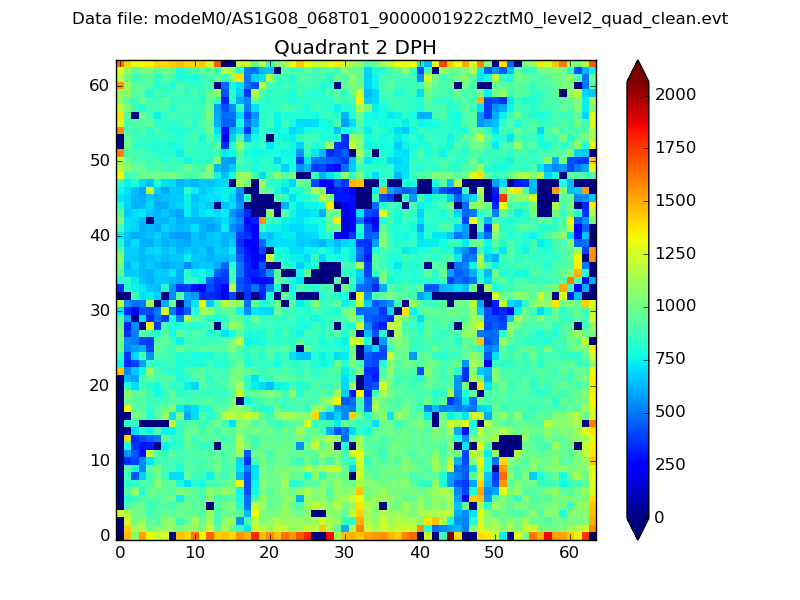
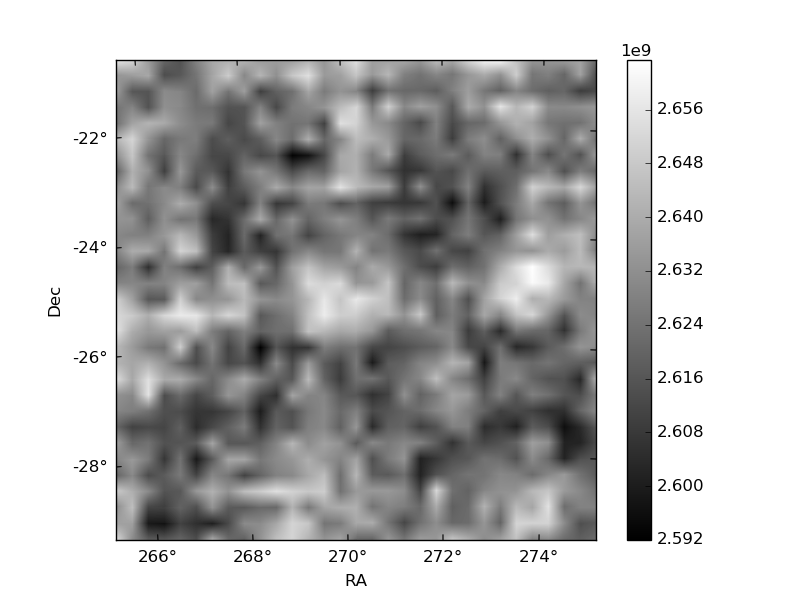
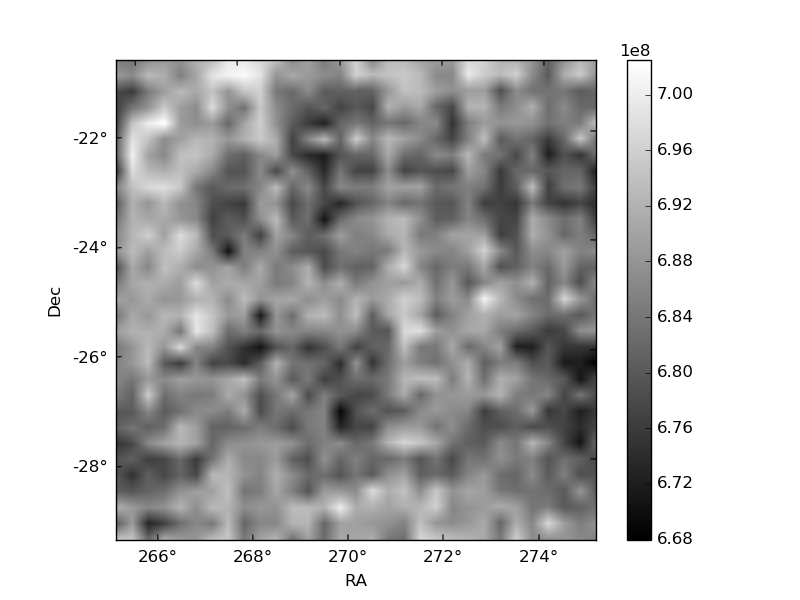
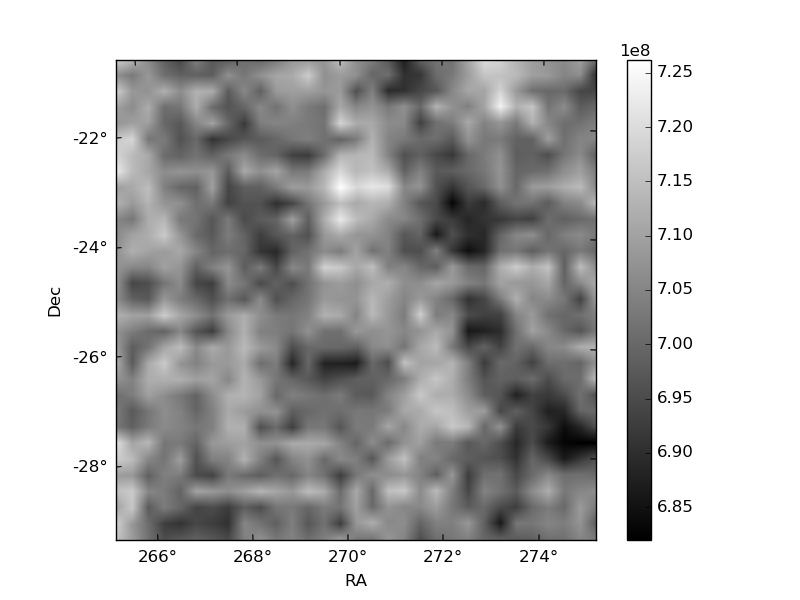
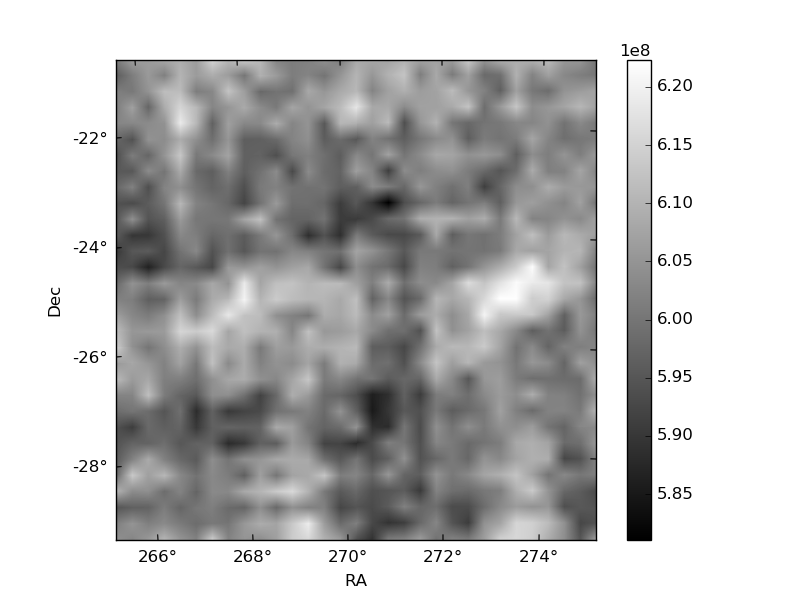
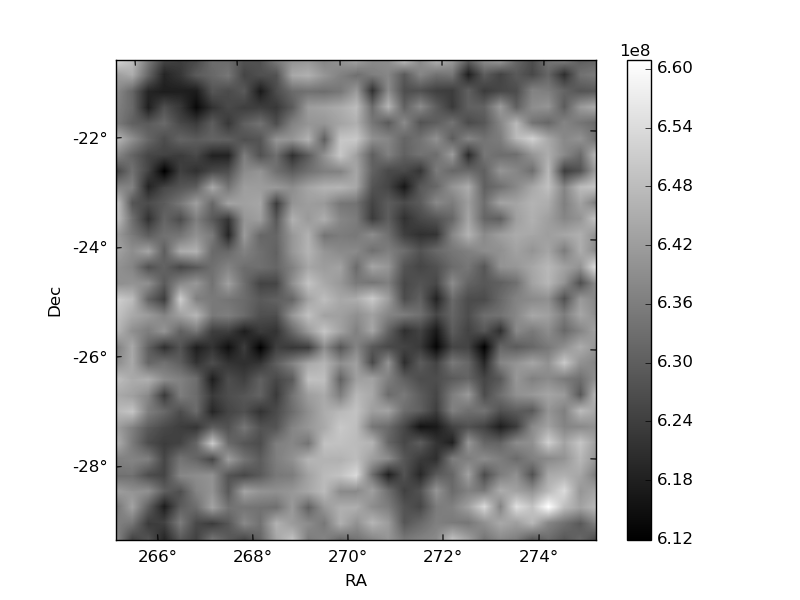
Histogram calculated using DETX and DETY for each event in the final _common_clean file
| Quadrant A | 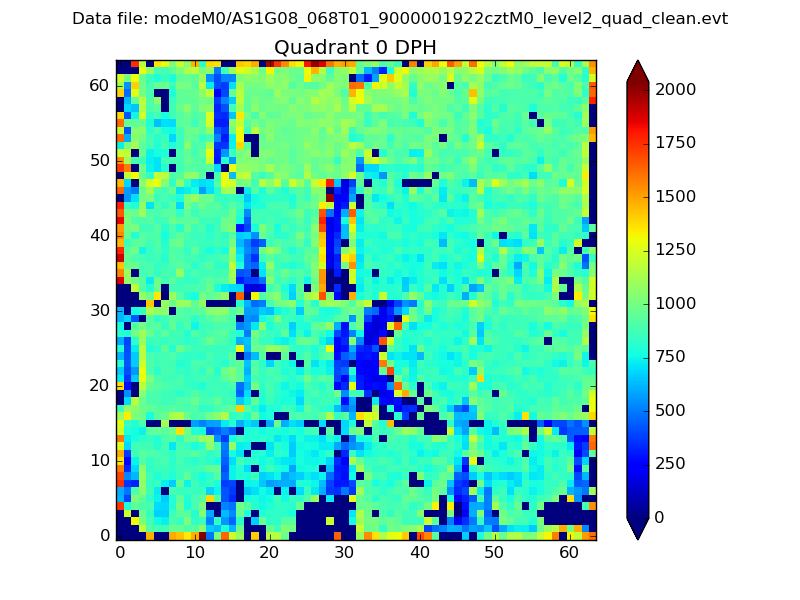 |
 |
Quadrant B |
|---|---|---|---|
| Quadrant D | 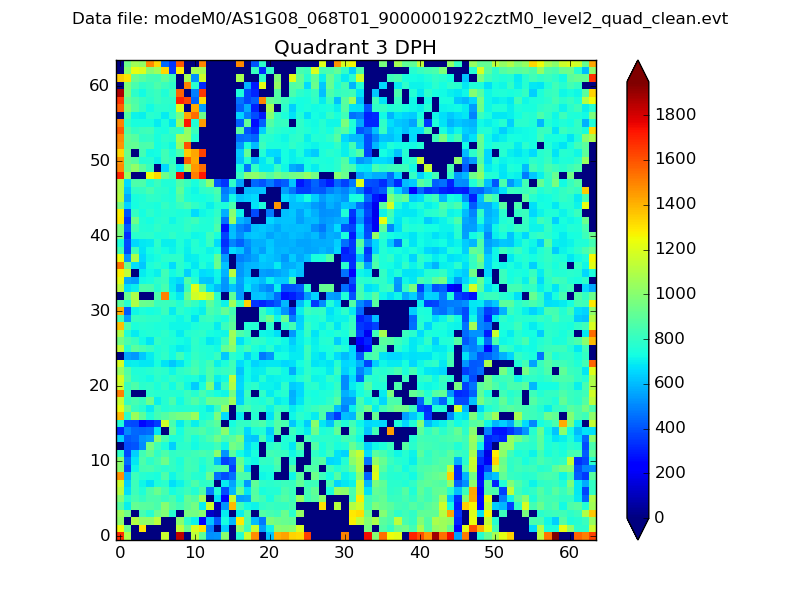 |
 |
Quadrant C |
| Plot type | Count rate plots | Images |
|---|---|---|
| Comparison with Poisson distribution Blue bars denote a histogram of data divided into 1 sec bins. Red curve is a Poisson curve with rate = median count rate of data. |
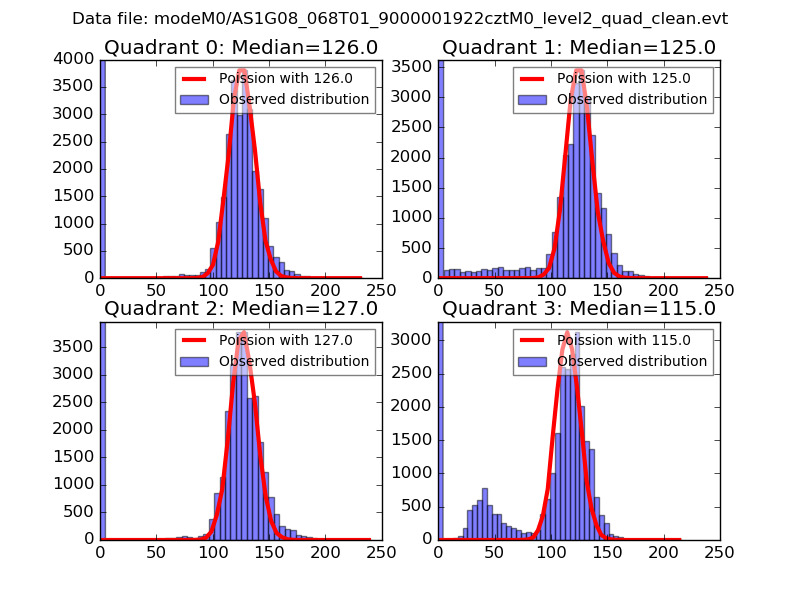 |
 |
| Quadrant-wise count rates Data is divided into 100 sec bins |
 |
|
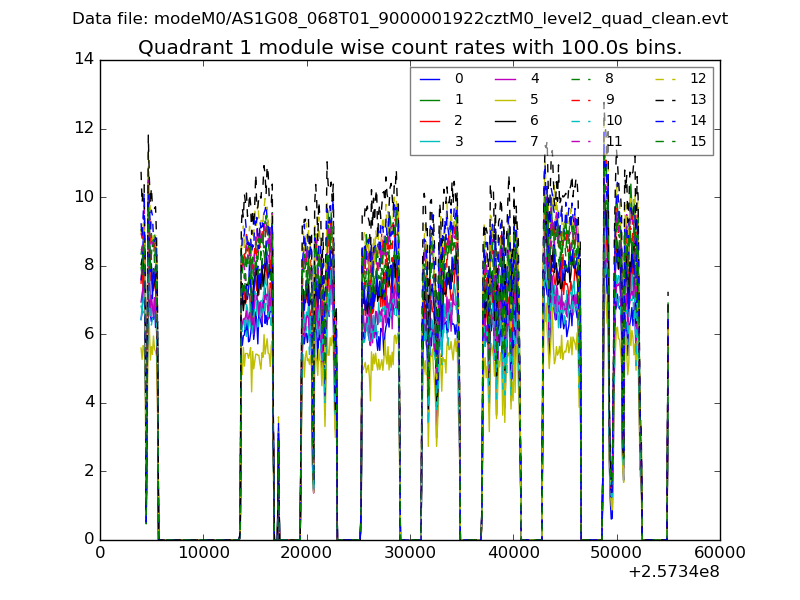
| Module-wise count rates for Quadrant A Data is divided into 100 sec bins |
 |
 |
| Module-wise count rates for Quadrant B Data is divided into 100 sec bins |
 |
 |
| Module-wise count rates for Quadrant C Data is divided into 100 sec bins |
 |
 |
| Module-wise count rates for Quadrant D Data is divided into 100 sec bins |
 |
 |
| Parameter | Plot |
|---|---|
| CZT HV Monitor | 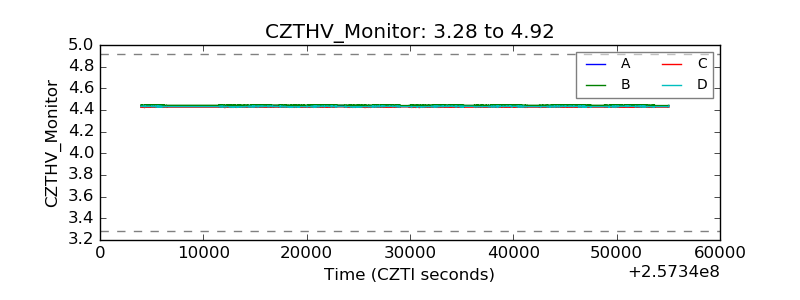 |
| D_VDD | 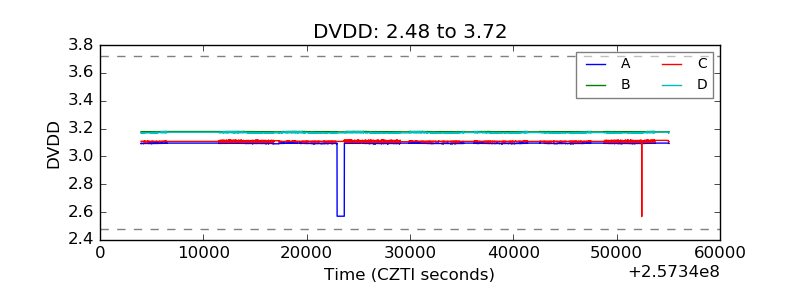 |
| Temperature 1 | 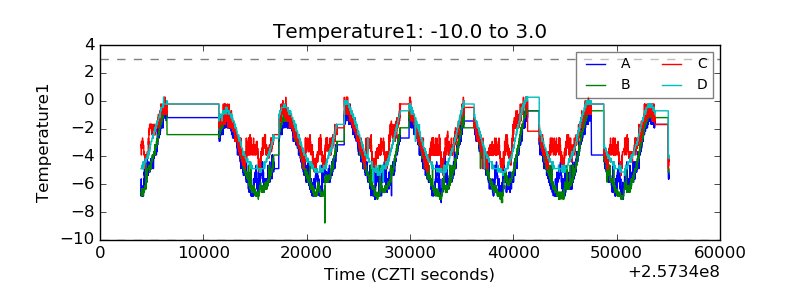 |
| Veto HV Monitor |  |
| Veto LLD | 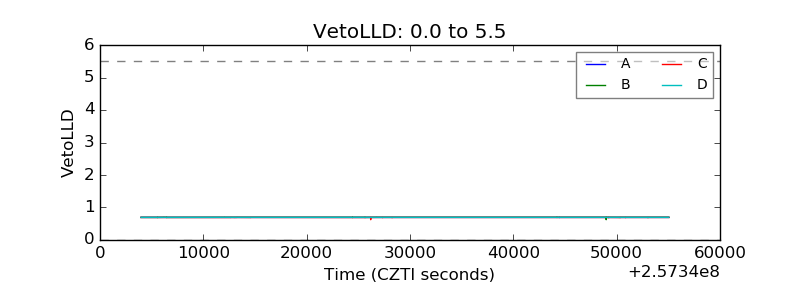 |
| Alpha Counter | 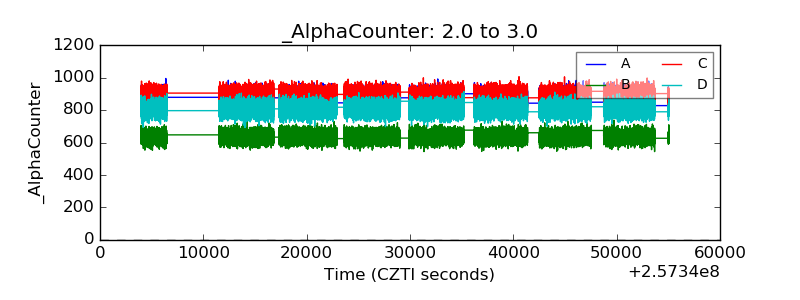 |
| _CPM_Rate | 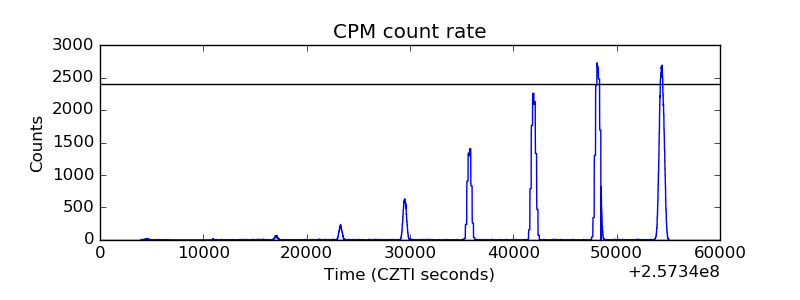 |
| CZT Counter |  |
| +2.5 Volts monitor | 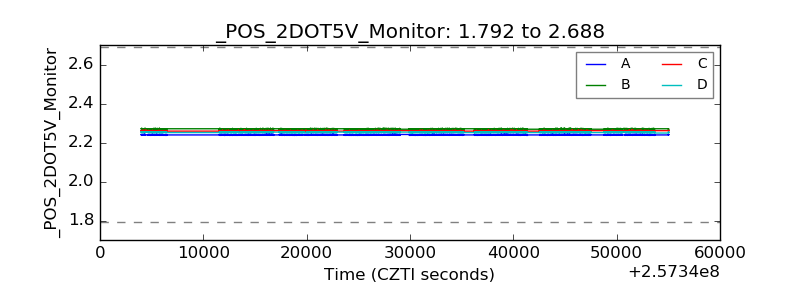 |
| +5 Volts monitor | 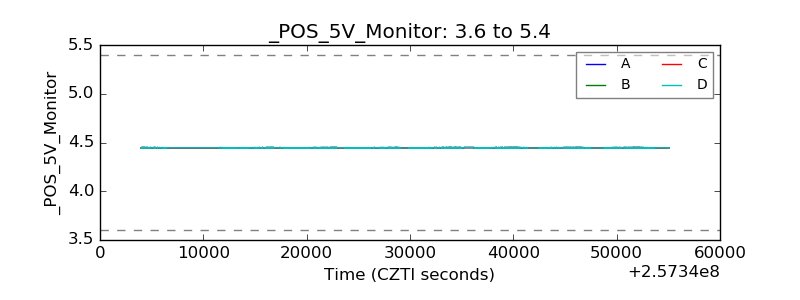 |
| _ROLL_ROT | 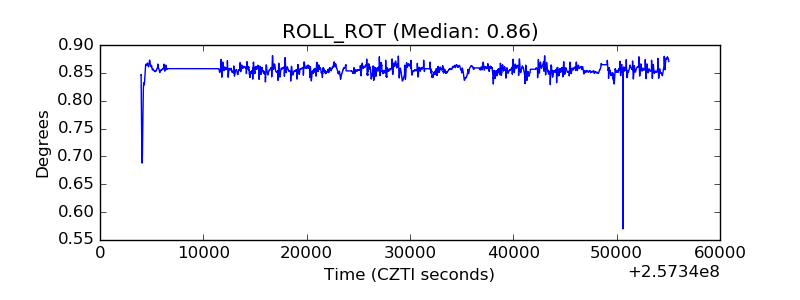 |
| _Roll_DEC | 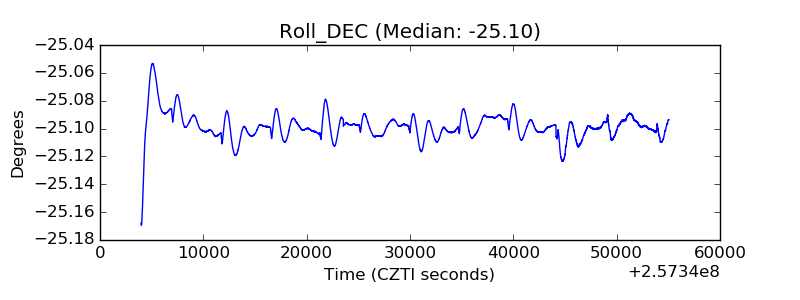 |
| _Roll_RA | 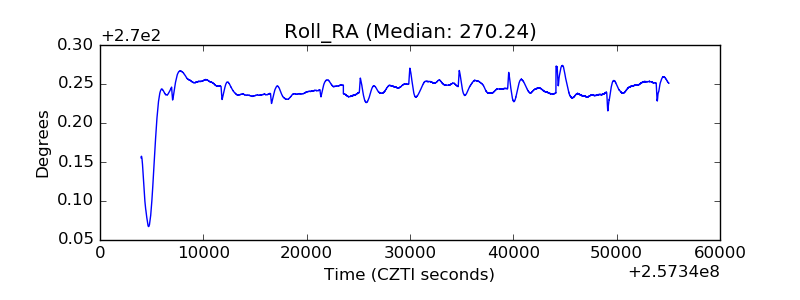 |
| Veto Counter | 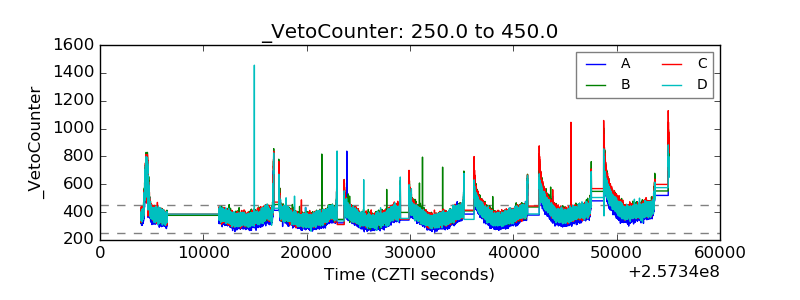 |