| Param | Original file | Final file |
|---|---|---|
| Filename | modeM0/AS1G08_068T01_9000001922_13060cztM0_level2.evt | modeM0/AS1G08_068T01_9000001922_13060cztM0_level2_quad_clean.evt |
| Size (bytes) | 203,088,960 | 31,328,640 |
| Size | 193.7 MB | 29.9 MB |
| Events in quadrant A | 1,265,473 | 193,428 |
| Events in quadrant B | 1,931,374 | 197,741 |
| Events in quadrant C | 1,217,123 | 203,327 |
| Events in quadrant D | 1,572,237 | 181,833 |
| Mode M0 | |||
|---|---|---|---|
| Quadrant | BADHDUFLAG | Total packets | Discarded packets |
| A | 0 | 5259 | 3 |
| B | 0 | 7319 | 2 |
| C | 0 | 5251 | 2 |
| D | 0 | 6259 | 2 |
| Mode M9 | |||
|---|---|---|---|
| Quadrant | BADHDUFLAG | Total packets | Discarded packets |
| A | 0 | 1 | 0 |
| B | 0 | 1 | 0 |
| C | 0 | 1 | 0 |
| D | 0 | 1 | 0 |
| Mode SS | |||
|---|---|---|---|
| Quadrant | BADHDUFLAG | Total packets | Discarded packets |
| A | 0 | 50 | 0 |
| B | 0 | 50 | 0 |
| C | 0 | 50 | 0 |
| D | 0 | 50 | 0 |
| Quadrant | Total seconds | Saturated seconds | Saturation percentage |
|---|---|---|---|
| A | 2381 | 238 | 9.995800% |
| B | 2381 | 433 | 18.185636% |
| C | 2381 | 182 | 7.643847% |
| D | 2381 | 298 | 12.515750% |
Noise dominated data is calculated using 1-second bins in cleaned event files. If a bin has >2000 counts, and if more than 50% of those come from <1% of pixels, then it is considered to be noise-dominated and hence unusable.
| Quadrant | # 1 sec bins | Bins with >0 counts | Bins with >2000 counts | High rate bins dominated by noise | Noise dominated (total time) | Noise dominated (detector-on time) | Marked lightcurve |
|---|---|---|---|---|---|---|---|
| A | 2507 | 2384 | 0 | 0 | 0.00% | 0.00% | 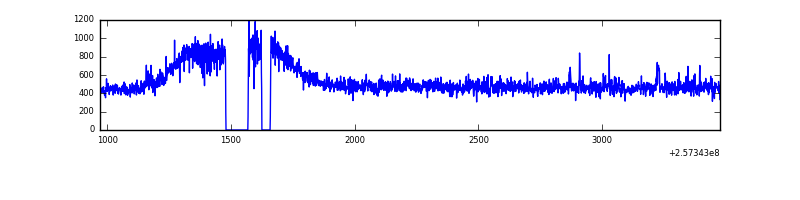 |
| B | 2507 | 2384 | 118 | 118 | 4.71% | 4.95% | 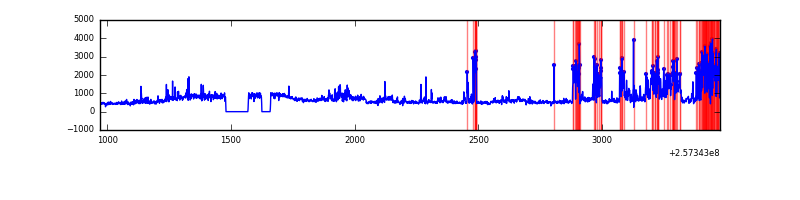 |
| C | 2507 | 2384 | 0 | 0 | 0.00% | 0.00% | 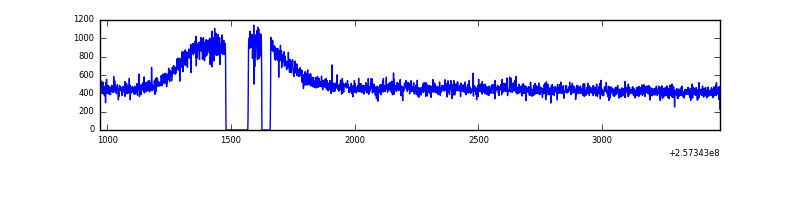 |
| D | 2507 | 2383 | 81 | 81 | 3.23% | 3.40% | 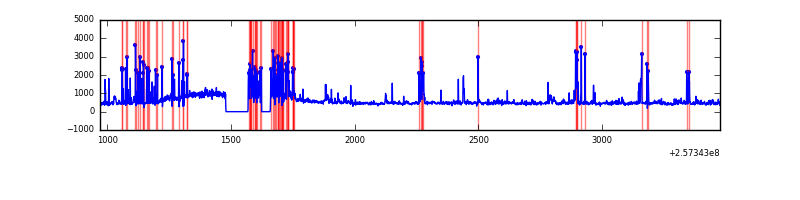 |
Top three noisy pixels from each quadrant. If the there are fewer than three noisy pixels in the level2.evt file, extra rows are filled as -1
| Pixel properties | Quadrant properties | ||||||
|---|---|---|---|---|---|---|---|
| Quadrant | DetID | PixID | Counts | Sigma | Mean | Median | Sigma |
| A | 12 | 189 | 27118 | 397.29 | 315 | 306 | 67.5 |
| A | 8 | 192 | 13784 | 199.71 | 315 | 306 | 67.5 |
| A | 1 | 162 | 4391 | 60.53 | 315 | 306 | 67.5 |
| B | 0 | 85 | 366270 | 5893.44 | 301 | 292 | 62.1 |
| B | 4 | 239 | 146450 | 2353.62 | 301 | 292 | 62.1 |
| B | 3 | 64 | 113321 | 1820.14 | 301 | 292 | 62.1 |
| C | 13 | 61 | 2215 | 25.57 | 312 | 312 | 74.4 |
| C | 8 | 222 | 821 | 6.84 | 312 | 312 | 74.4 |
| C | 3 | 202 | 688 | 5.05 | 312 | 312 | 74.4 |
| D | 1 | 52 | 374507 | 4978.85 | 302 | 292 | 75.2 |
| D | 8 | 195 | 54700 | 723.89 | 302 | 292 | 75.2 |
| D | 2 | 234 | 7689 | 98.42 | 302 | 292 | 75.2 |
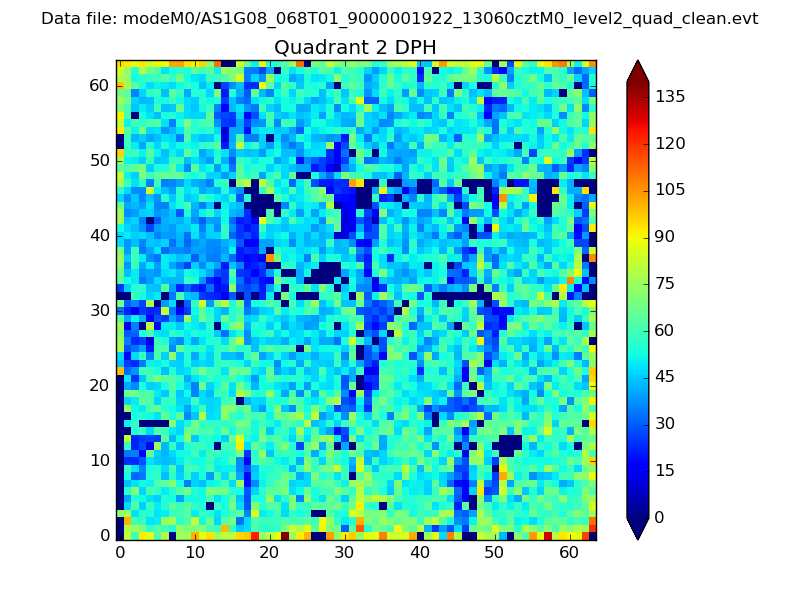
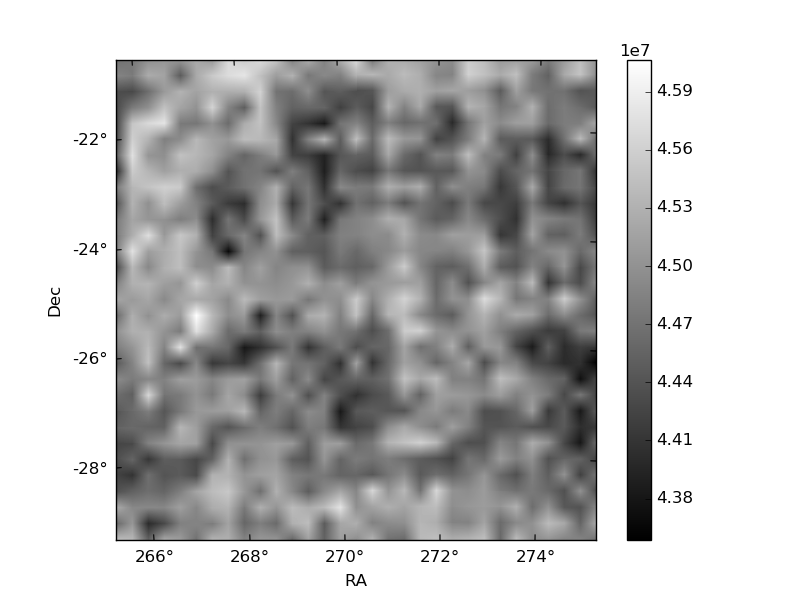
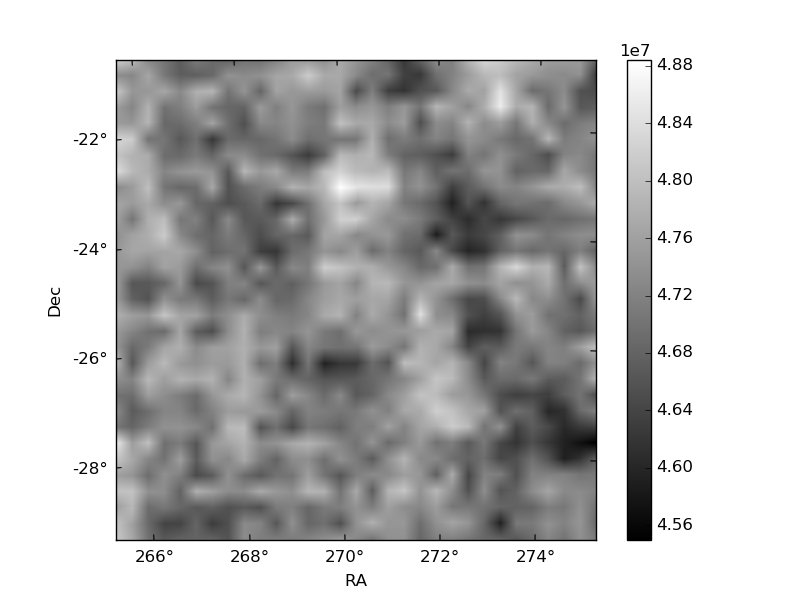
Histogram calculated using DETX and DETY for each event in the final _common_clean file
| Quadrant A | 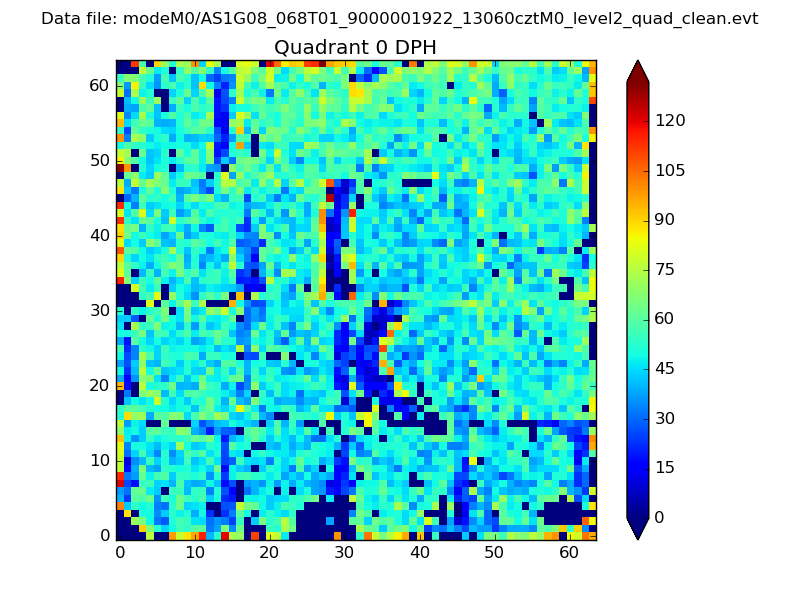 |
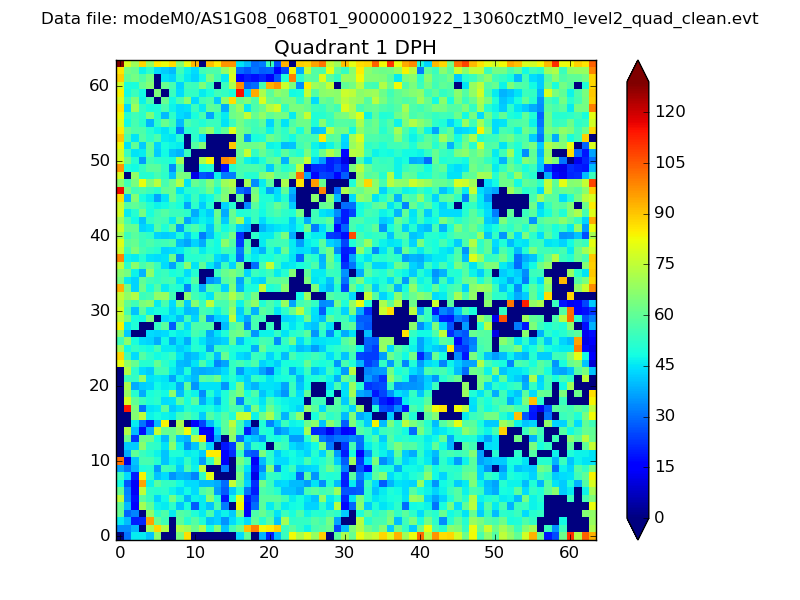 |
Quadrant B |
|---|---|---|---|
| Quadrant D | 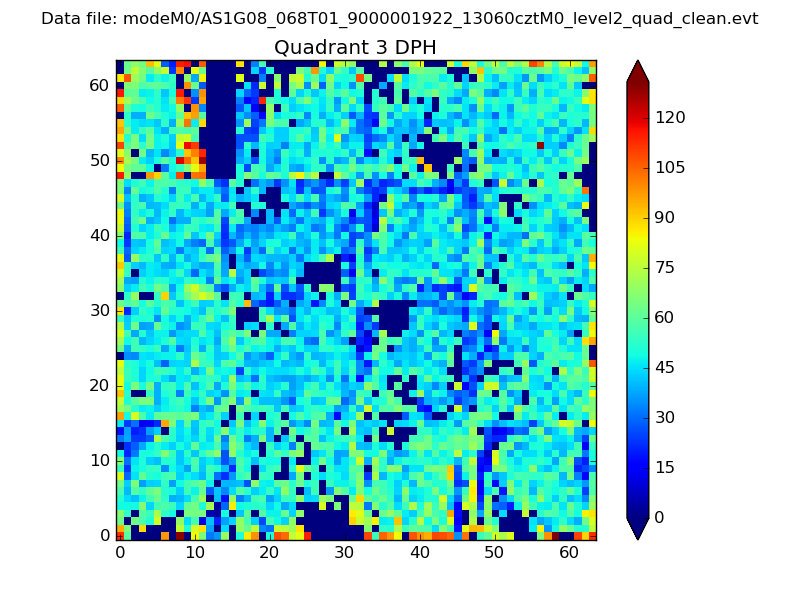 |
 |
Quadrant C |
| Plot type | Count rate plots | Images |
|---|---|---|
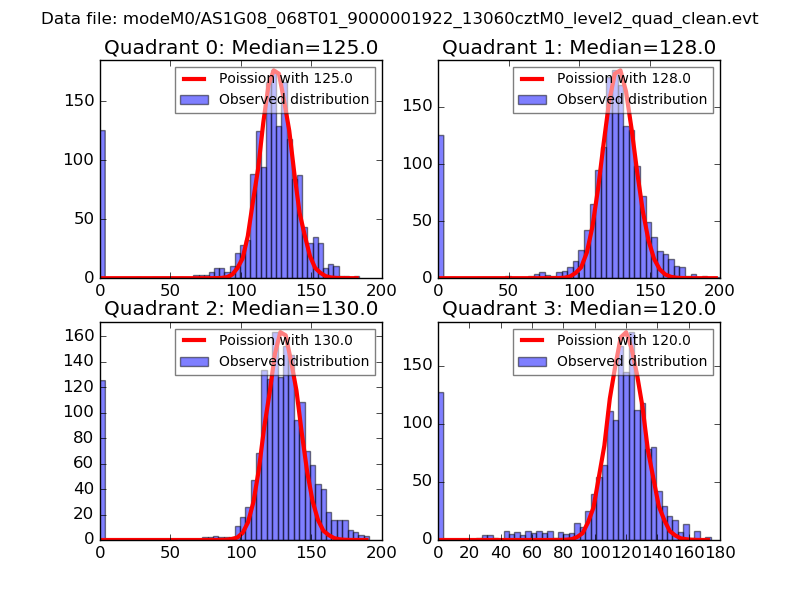
| Comparison with Poisson distribution Blue bars denote a histogram of data divided into 1 sec bins. Red curve is a Poisson curve with rate = median count rate of data. |
 |
 |
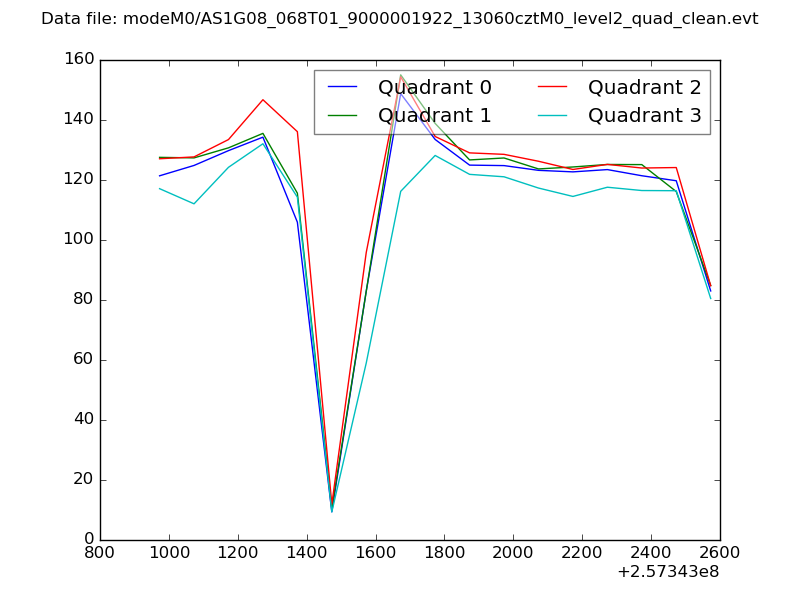
| Quadrant-wise count rates Data is divided into 100 sec bins |
 |
|
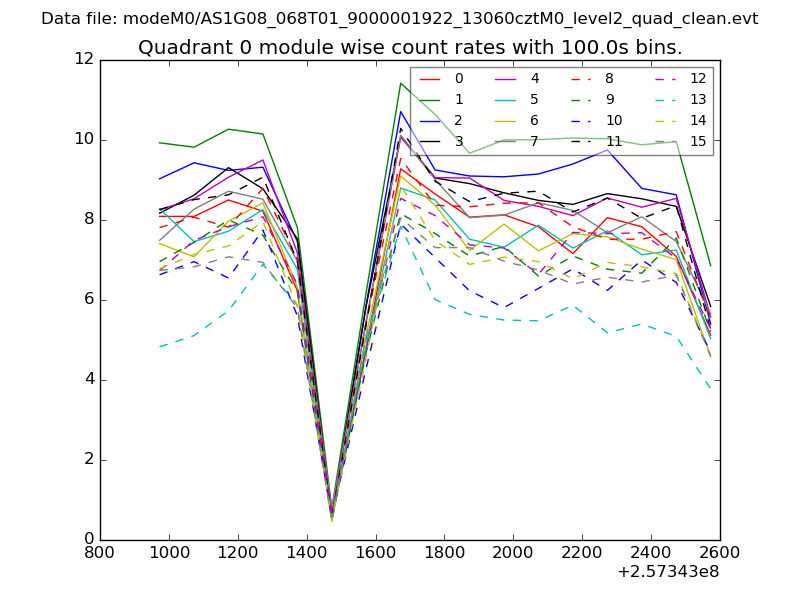
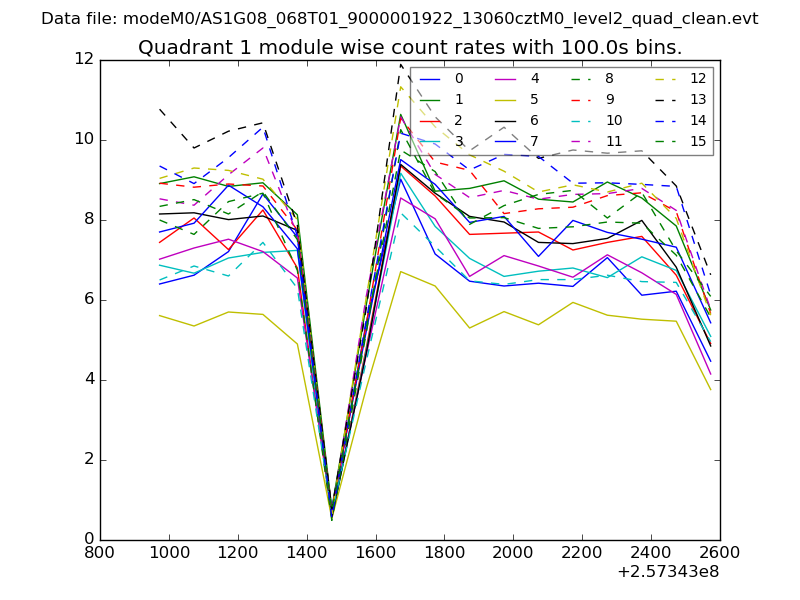
| Module-wise count rates for Quadrant A Data is divided into 100 sec bins |
 |
 |
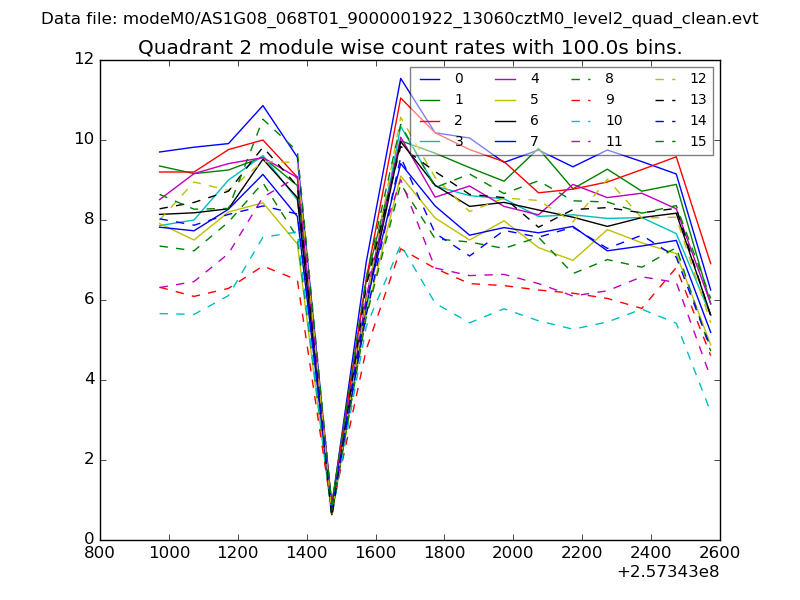
| Module-wise count rates for Quadrant B Data is divided into 100 sec bins |
 |
 |
| Module-wise count rates for Quadrant C Data is divided into 100 sec bins |
 |
 |
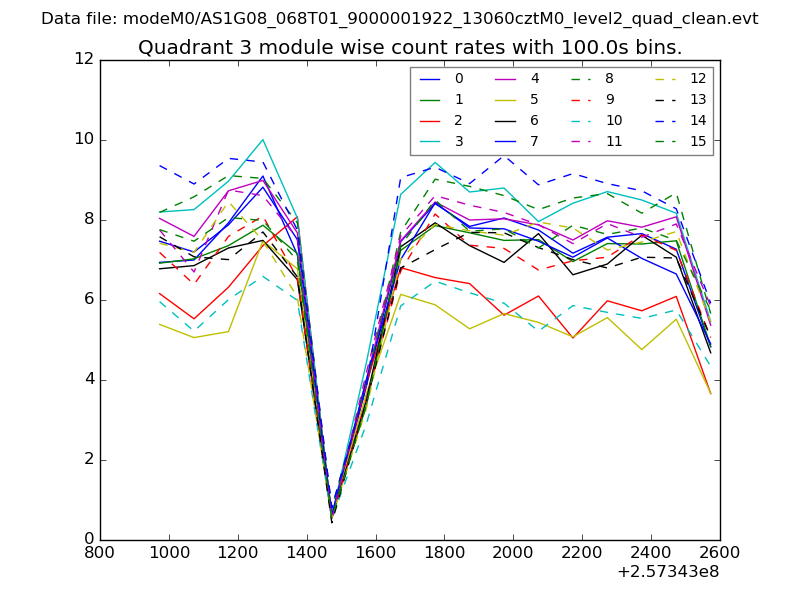
| Module-wise count rates for Quadrant D Data is divided into 100 sec bins |
 |
 |
| Parameter | Plot |
|---|---|
| CZT HV Monitor | 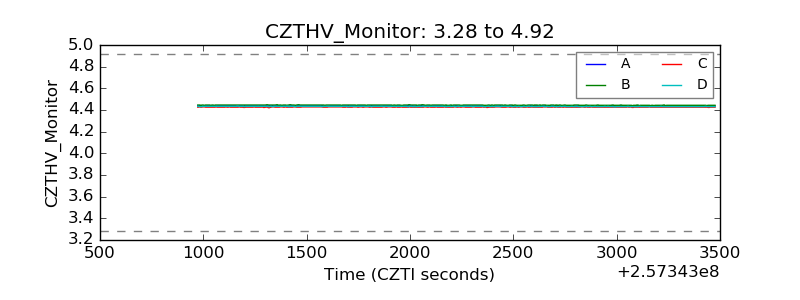 |
| D_VDD | 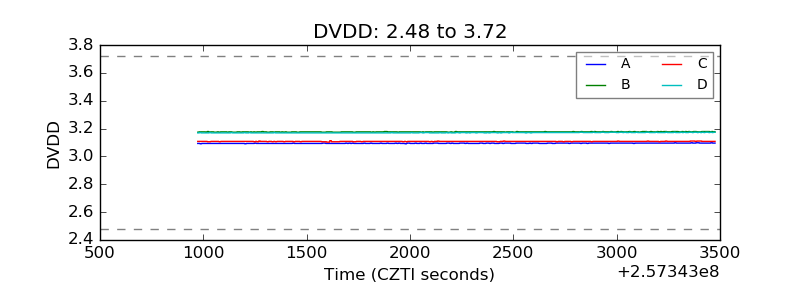 |
| Temperature 1 | 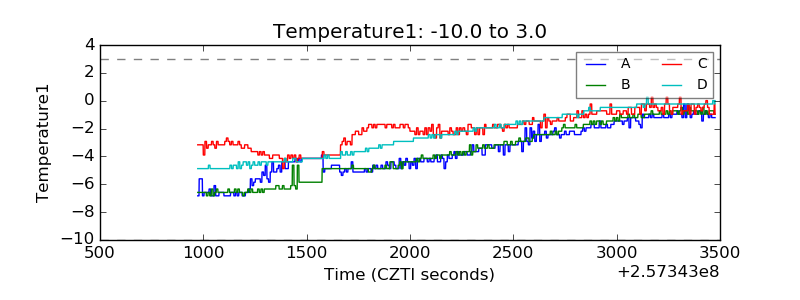 |
| Veto HV Monitor | 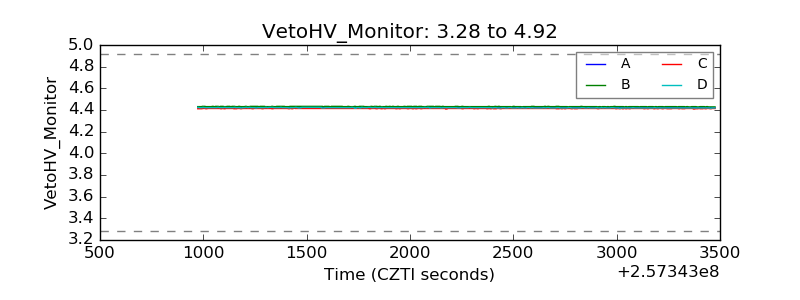 |
| Veto LLD | 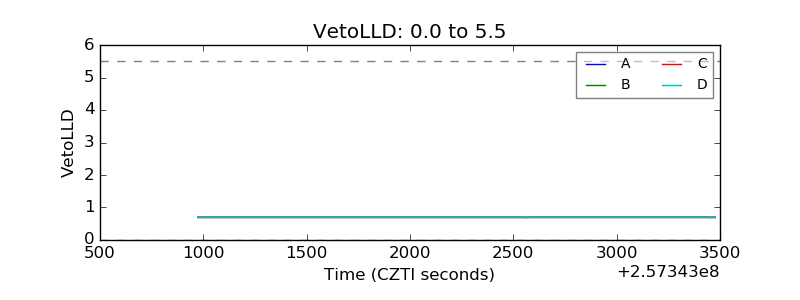 |
| Alpha Counter | 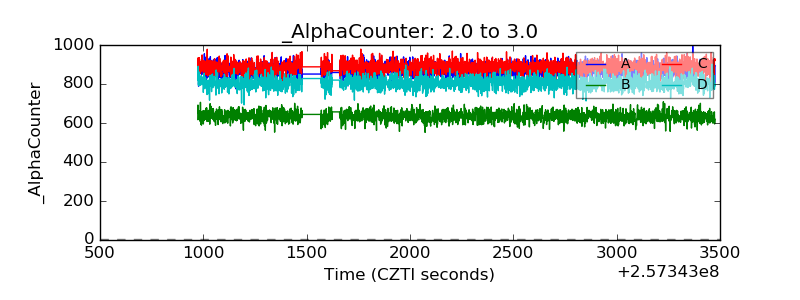 |
| _CPM_Rate | 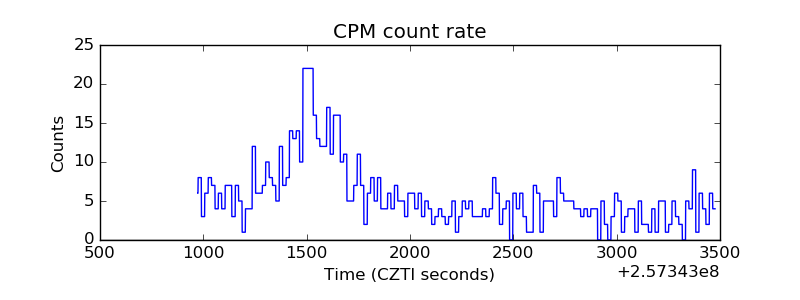 |
| CZT Counter | 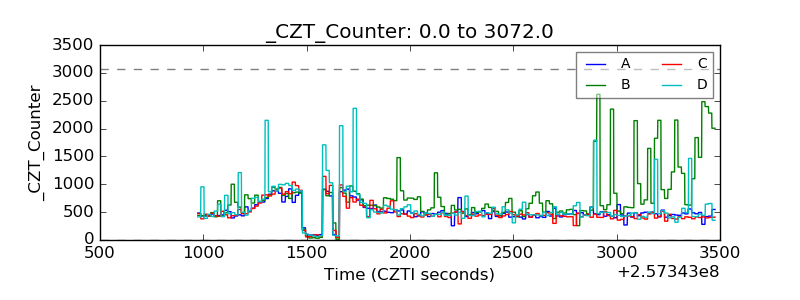 |
| +2.5 Volts monitor |  |
| +5 Volts monitor | 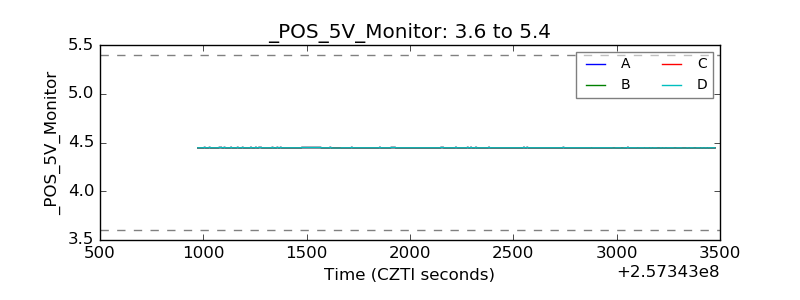 |
| _ROLL_ROT | 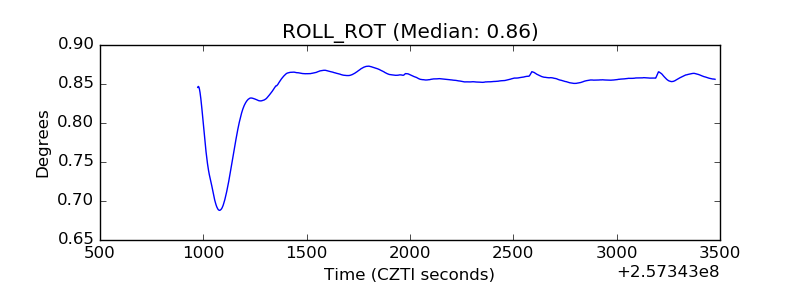 |
| _Roll_DEC | 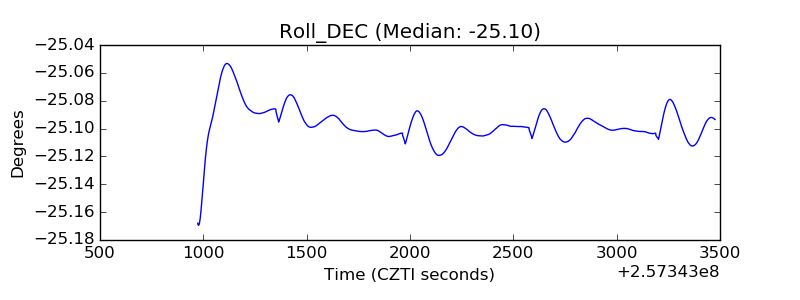 |
| _Roll_RA |  |
| Veto Counter | 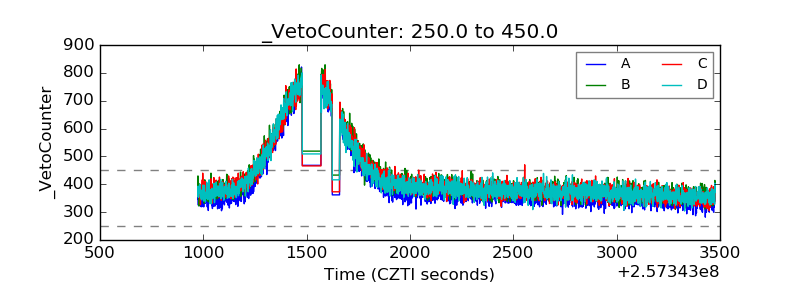 |