| Param | Original file | Final file |
|---|---|---|
| Filename | modeM0/AS1G08_068T01_9000001922_13068cztM0_level2.evt | modeM0/AS1G08_068T01_9000001922_13068cztM0_level2_quad_clean.evt |
| Size (bytes) | 944,285,760 | 88,928,640 |
| Size | 900.5 MB | 84.8 MB |
| Events in quadrant A | 3,276,990 | 681,794 |
| Events in quadrant B | 6,606,641 | 610,484 |
| Events in quadrant C | 3,072,055 | 691,432 |
| Events in quadrant D | 15,213,105 | 263,209 |
| Mode M0 | |||
|---|---|---|---|
| Quadrant | BADHDUFLAG | Total packets | Discarded packets |
| A | 0 | 13792 | 3 |
| B | 0 | 23917 | 2 |
| C | 0 | 13203 | 2 |
| D | 0 | 49536 | 2 |
| Mode M9 | |||
|---|---|---|---|
| Quadrant | BADHDUFLAG | Total packets | Discarded packets |
| A | 0 | 15 | 0 |
| B | 0 | 15 | 0 |
| C | 0 | 15 | 0 |
| D | 0 | 16 | 0 |
| Mode SS | |||
|---|---|---|---|
| Quadrant | BADHDUFLAG | Total packets | Discarded packets |
| A | 0 | 128 | 0 |
| B | 0 | 128 | 0 |
| C | 0 | 128 | 0 |
| D | 0 | 128 | 0 |
| Quadrant | Total seconds | Saturated seconds | Saturation percentage |
|---|---|---|---|
| A | 6361 | 47 | 0.738878% |
| B | 6361 | 1534 | 24.115705% |
| C | 6361 | 26 | 0.408741% |
| D | 6361 | 5441 | 85.536865% |
Noise dominated data is calculated using 1-second bins in cleaned event files. If a bin has >2000 counts, and if more than 50% of those come from <1% of pixels, then it is considered to be noise-dominated and hence unusable.
| Quadrant | # 1 sec bins | Bins with >0 counts | Bins with >2000 counts | High rate bins dominated by noise | Noise dominated (total time) | Noise dominated (detector-on time) | Marked lightcurve |
|---|---|---|---|---|---|---|---|
| A | 7572 | 6364 | 2 | 2 | 0.03% | 0.03% | 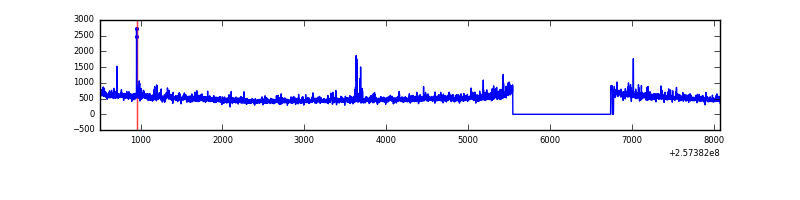 |
| B | 7572 | 6364 | 1088 | 1088 | 14.37% | 17.10% | 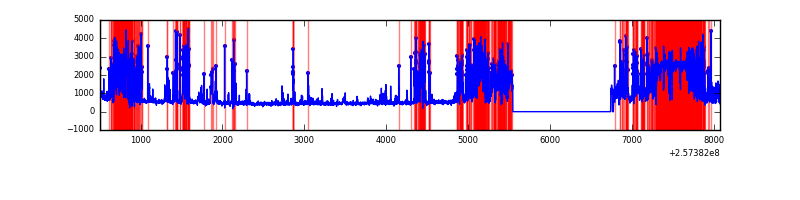 |
| C | 7572 | 6364 | 0 | 0 | 0.00% | 0.00% | 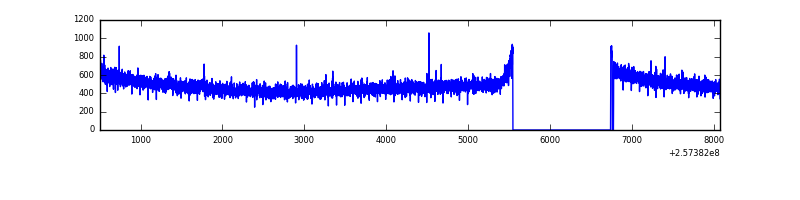 |
| D | 7572 | 6363 | 5156 | 5156 | 68.09% | 81.03% | 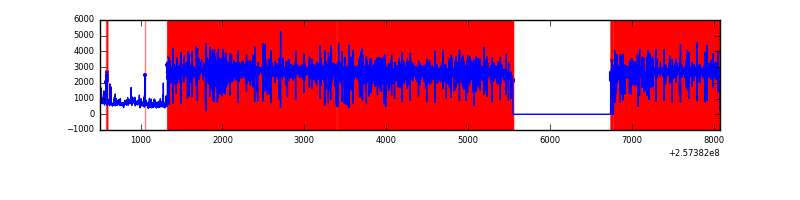 |
Top three noisy pixels from each quadrant. If the there are fewer than three noisy pixels in the level2.evt file, extra rows are filled as -1
| Pixel properties | Quadrant properties | ||||||
|---|---|---|---|---|---|---|---|
| Quadrant | DetID | PixID | Counts | Sigma | Mean | Median | Sigma |
| A | 12 | 189 | 88922 | 546.69 | 794 | 776 | 161.2 |
| A | 8 | 15 | 49509 | 302.25 | 794 | 776 | 161.2 |
| A | 13 | 248 | 26342 | 158.56 | 794 | 776 | 161.2 |
| B | 4 | 239 | 1910925 | 14921.57 | 686 | 671 | 128.0 |
| B | 0 | 85 | 1819836 | 14210.04 | 686 | 671 | 128.0 |
| B | 3 | 64 | 64203 | 496.27 | 686 | 671 | 128.0 |
| C | 13 | 61 | 5569 | 26.21 | 786 | 794 | 182.2 |
| C | 8 | 128 | 3757 | 16.26 | 786 | 794 | 182.2 |
| C | 8 | 222 | 2476 | 9.23 | 786 | 794 | 182.2 |
| D | 1 | 52 | 13454605 | 135887.47 | 409 | 398 | 99.0 |
| D | 10 | 157 | 121819 | 1226.35 | 409 | 398 | 99.0 |
| D | 9 | 85 | 36062 | 360.21 | 409 | 398 | 99.0 |
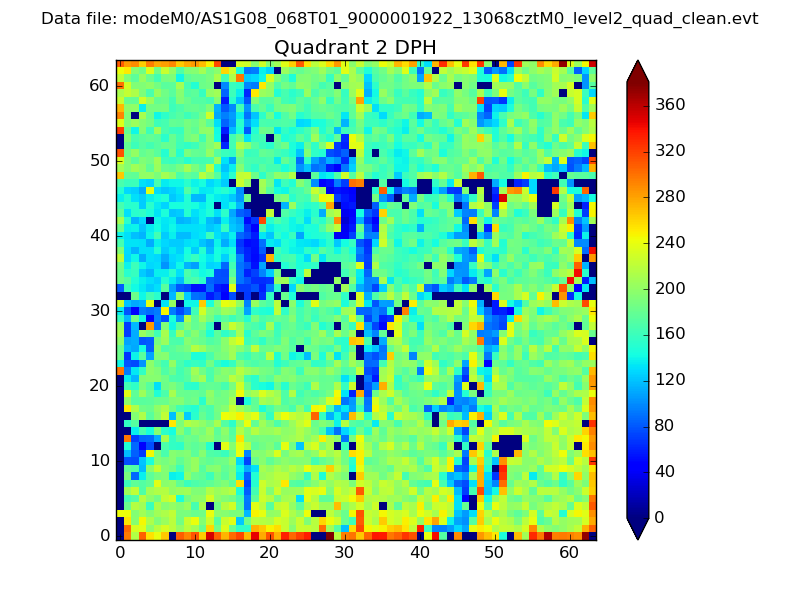
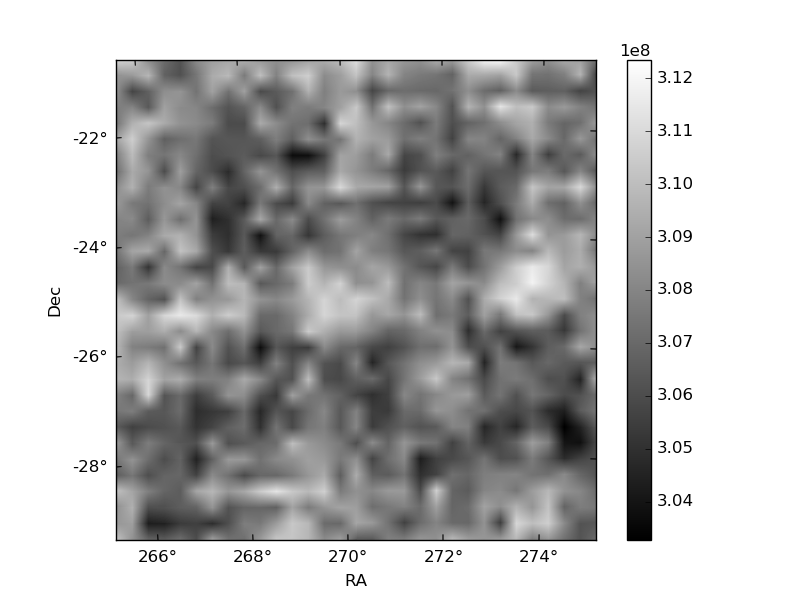
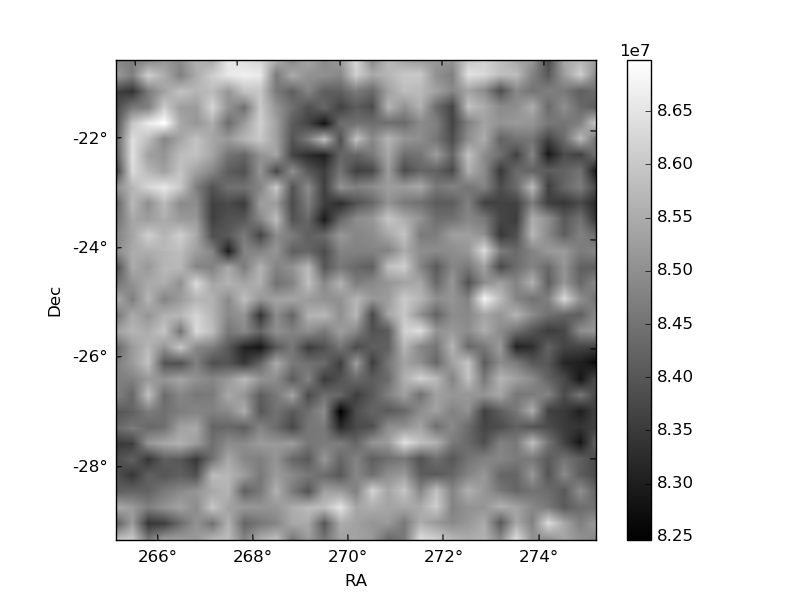
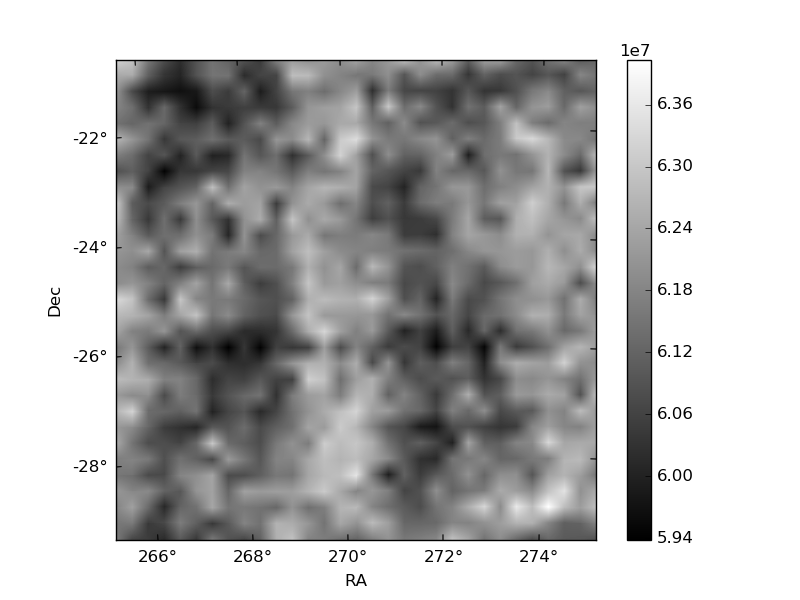
Histogram calculated using DETX and DETY for each event in the final _common_clean file
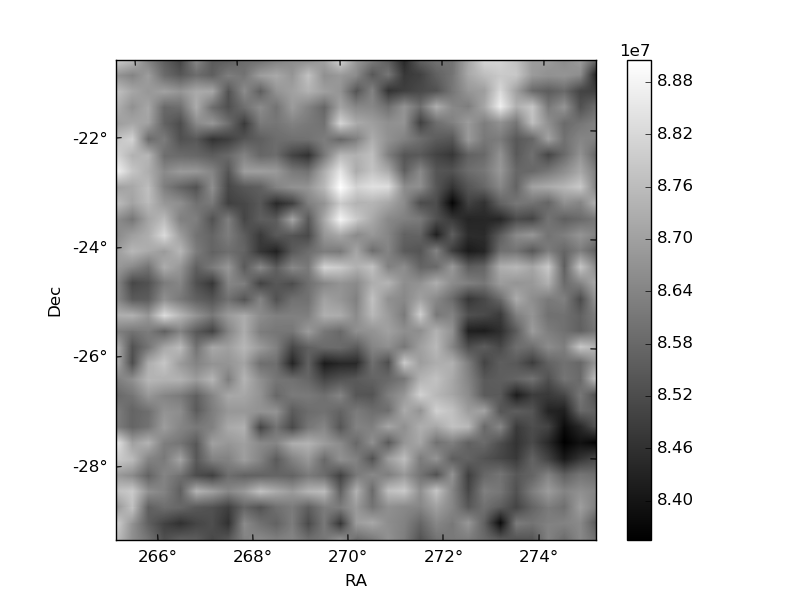
| Quadrant A | 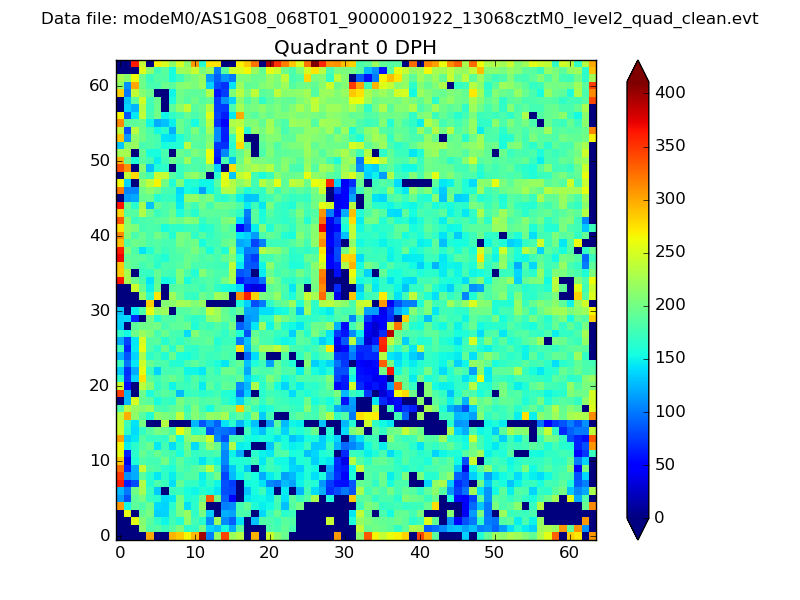 |
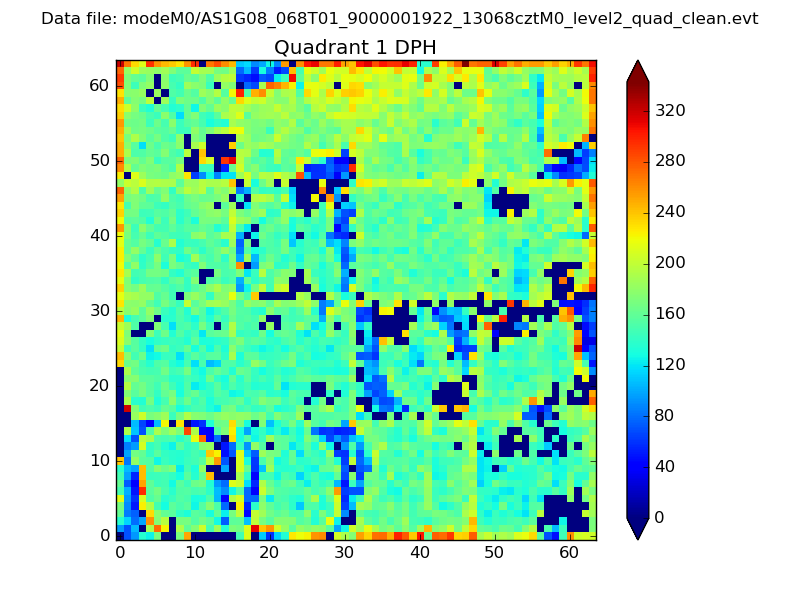 |
Quadrant B |
|---|---|---|---|
| Quadrant D | 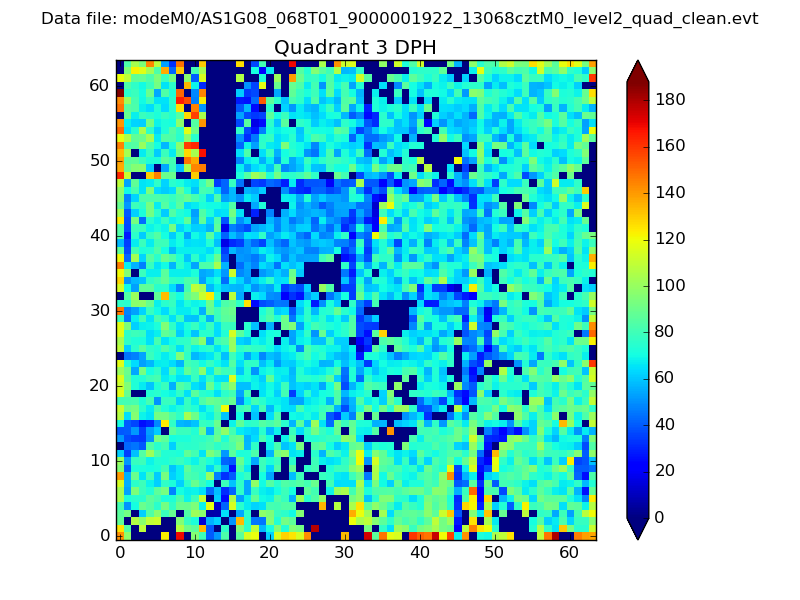 |
 |
Quadrant C |
| Plot type | Count rate plots | Images |
|---|---|---|
| Comparison with Poisson distribution Blue bars denote a histogram of data divided into 1 sec bins. Red curve is a Poisson curve with rate = median count rate of data. |
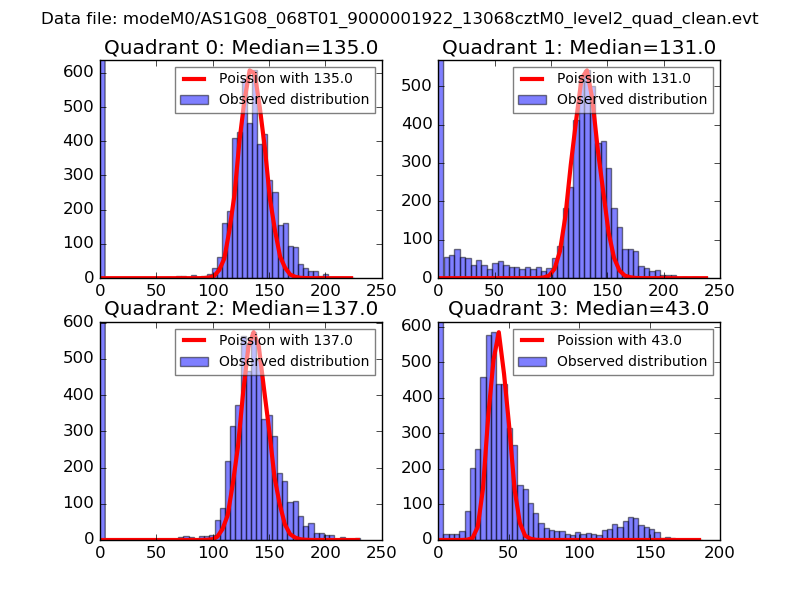 |
 |
| Quadrant-wise count rates Data is divided into 100 sec bins |
 |
|
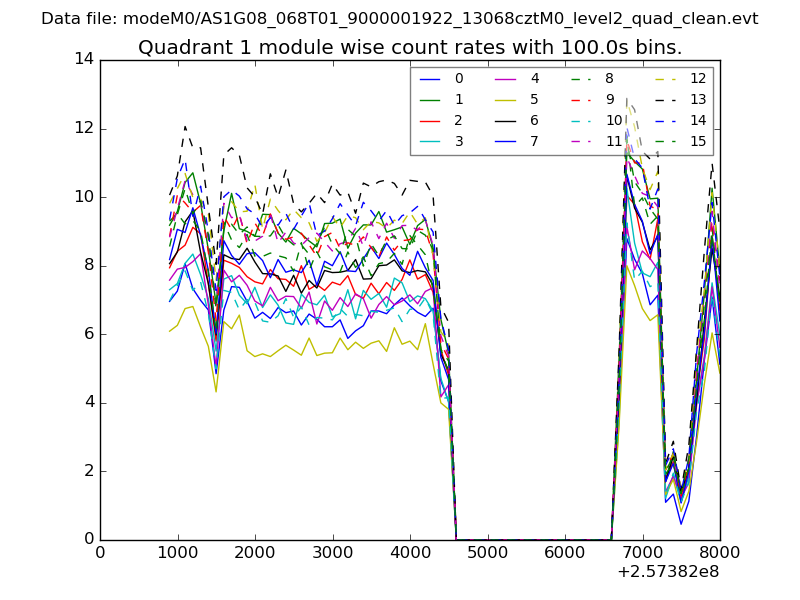
| Module-wise count rates for Quadrant A Data is divided into 100 sec bins |
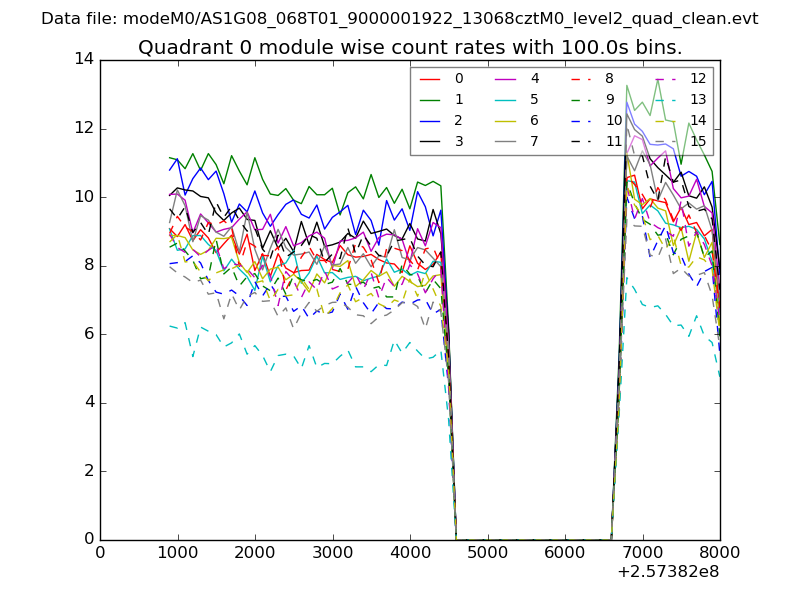 |
 |
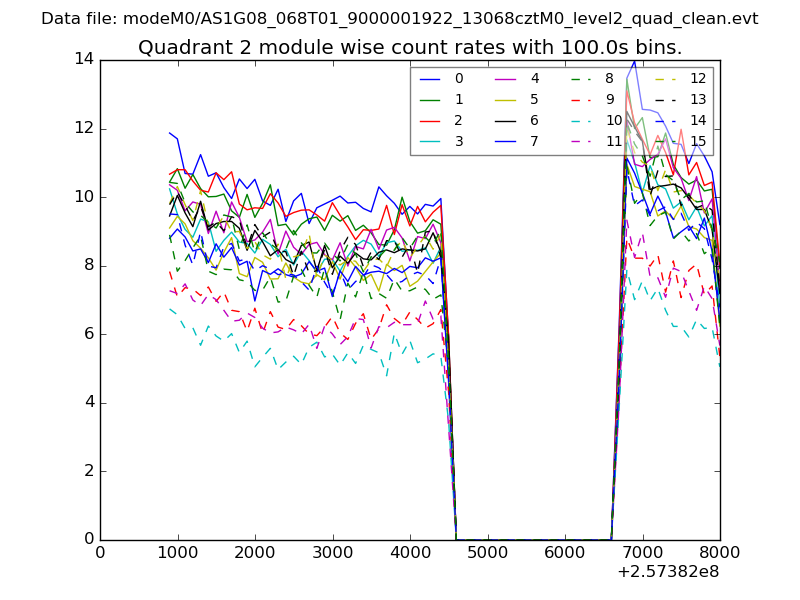
| Module-wise count rates for Quadrant B Data is divided into 100 sec bins |
 |
 |
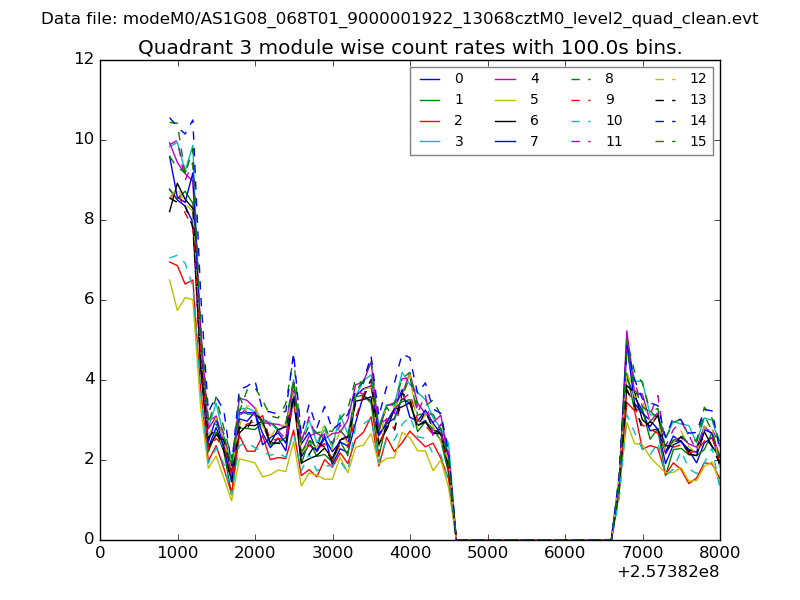
| Module-wise count rates for Quadrant C Data is divided into 100 sec bins |
 |
 |
| Module-wise count rates for Quadrant D Data is divided into 100 sec bins |
 |
 |
| Parameter | Plot |
|---|---|
| CZT HV Monitor | 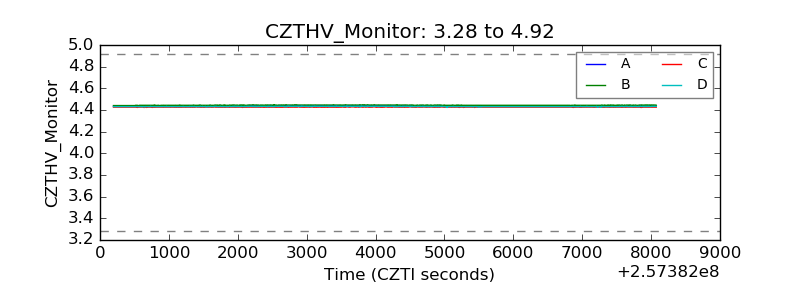 |
| D_VDD | 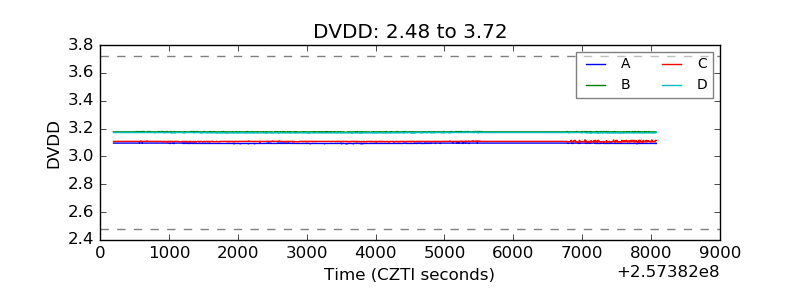 |
| Temperature 1 | 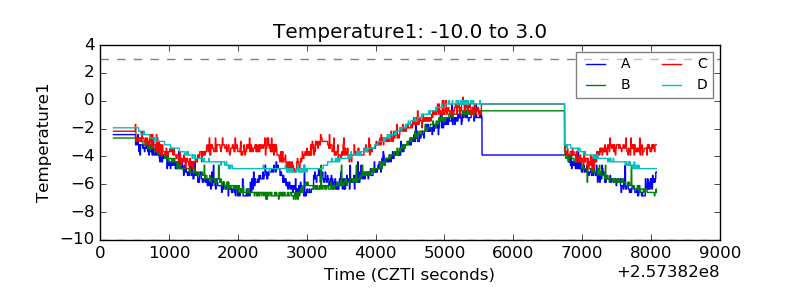 |
| Veto HV Monitor |  |
| Veto LLD | 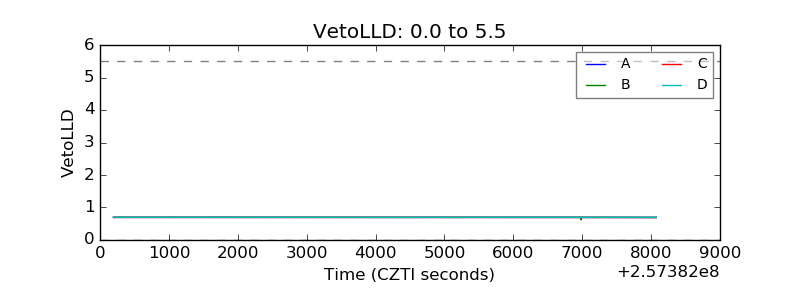 |
| Alpha Counter | 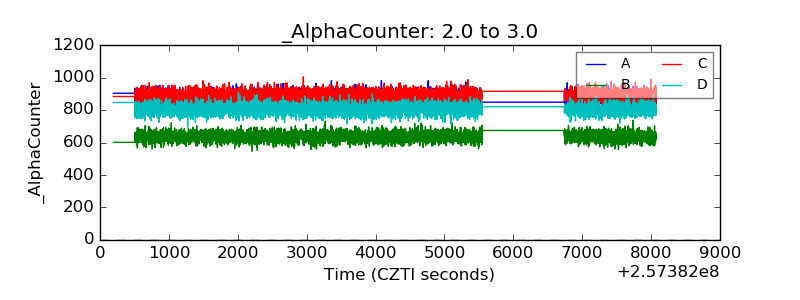 |
| _CPM_Rate | 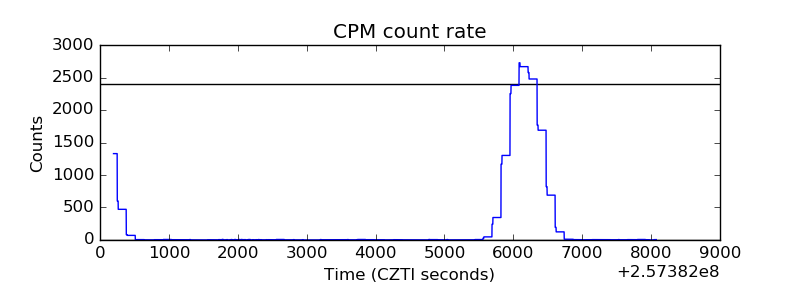 |
| CZT Counter | 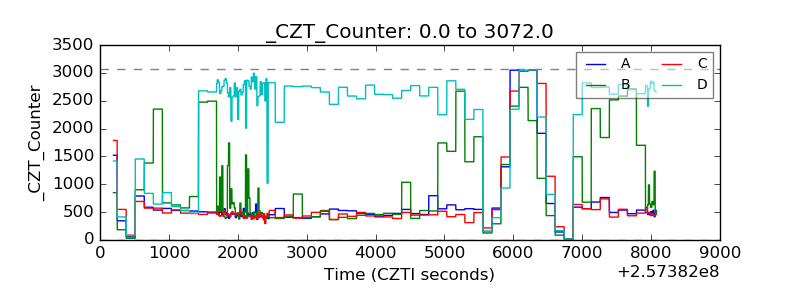 |
| +2.5 Volts monitor |  |
| +5 Volts monitor |  |
| _ROLL_ROT | 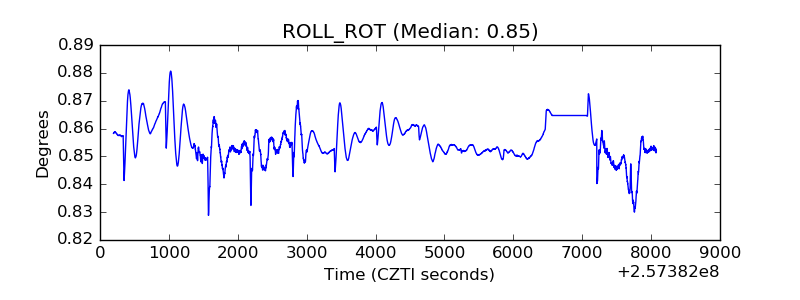 |
| _Roll_DEC | 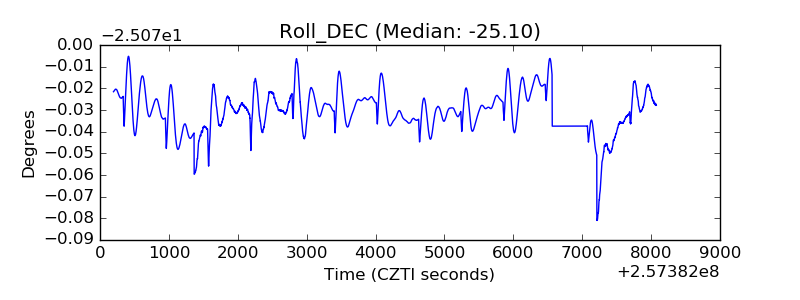 |
| _Roll_RA | 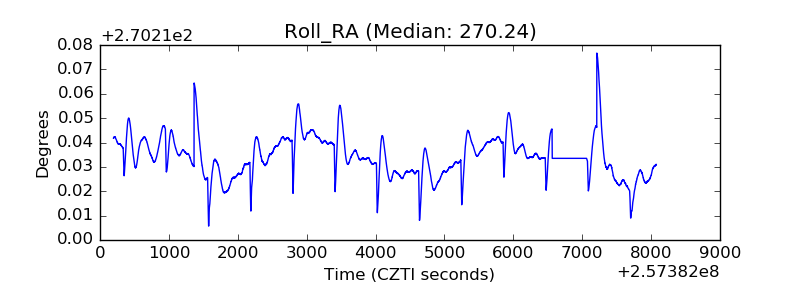 |
| Veto Counter | 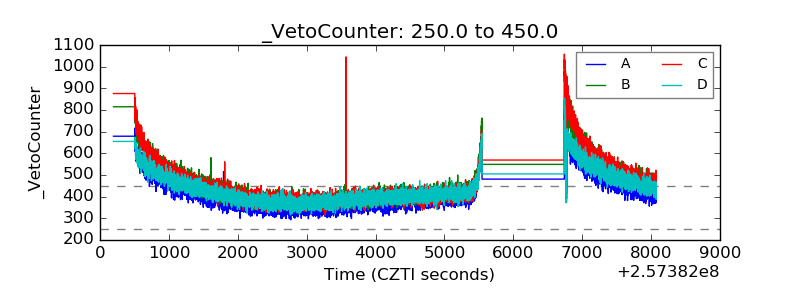 |