| Param | Original file | Final file |
|---|---|---|
| Filename | modeM0/AS1G08_068T01_9000001922_13071cztM0_level2.evt | modeM0/AS1G08_068T01_9000001922_13071cztM0_level2_quad_clean.evt |
| Size (bytes) | 367,176,960 | 51,125,760 |
| Size | 350.2 MB | 48.8 MB |
| Events in quadrant A | 1,921,930 | 340,960 |
| Events in quadrant B | 3,826,753 | 310,264 |
| Events in quadrant C | 1,809,121 | 347,081 |
| Events in quadrant D | 3,298,582 | 276,243 |
| Mode M0 | |||
|---|---|---|---|
| Quadrant | BADHDUFLAG | Total packets | Discarded packets |
| A | 0 | 8394 | 273 |
| B | 0 | 14209 | 254 |
| C | 0 | 8110 | 263 |
| D | 0 | 12549 | 285 |
| Mode M9 | |||
|---|---|---|---|
| Quadrant | BADHDUFLAG | Total packets | Discarded packets |
| A | 0 | 7 | 0 |
| B | 0 | 8 | 2 |
| C | 0 | 7 | 0 |
| D | 0 | 7 | 1 |
| Mode SS | |||
|---|---|---|---|
| Quadrant | BADHDUFLAG | Total packets | Discarded packets |
| A | 0 | 84 | 4 |
| B | 0 | 83 | 3 |
| C | 0 | 84 | 4 |
| D | 0 | 81 | 1 |
| Quadrant | Total seconds | Saturated seconds | Saturation percentage |
|---|---|---|---|
| A | 3857 | 29 | 0.751880% |
| B | 3866 | 870 | 22.503880% |
| C | 3861 | 12 | 0.310800% |
| D | 3860 | 521 | 13.497409% |
Noise dominated data is calculated using 1-second bins in cleaned event files. If a bin has >2000 counts, and if more than 50% of those come from <1% of pixels, then it is considered to be noise-dominated and hence unusable.
| Quadrant | # 1 sec bins | Bins with >0 counts | Bins with >2000 counts | High rate bins dominated by noise | Noise dominated (total time) | Noise dominated (detector-on time) | Marked lightcurve |
|---|---|---|---|---|---|---|---|
| A | 4048 | 3869 | 2 | 2 | 0.05% | 0.05% | 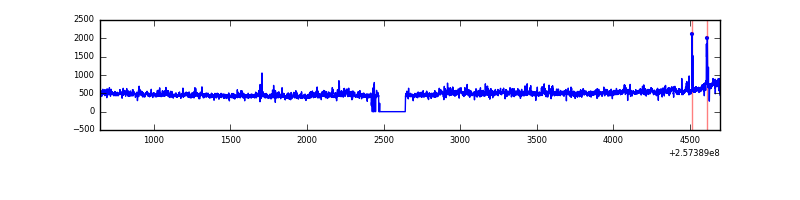 |
| B | 4048 | 3882 | 569 | 569 | 14.06% | 14.66% | 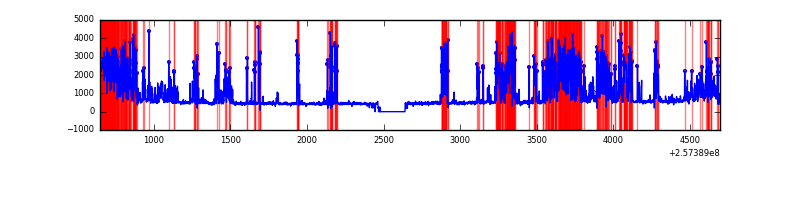 |
| C | 4048 | 3876 | 1 | 1 | 0.02% | 0.03% | 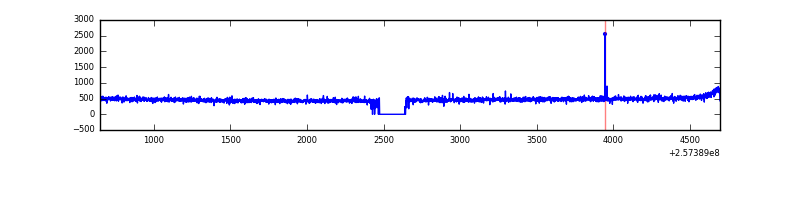 |
| D | 4048 | 3874 | 501 | 501 | 12.38% | 12.93% | 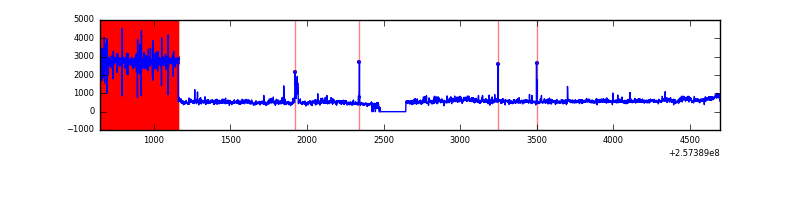 |
Top three noisy pixels from each quadrant. If the there are fewer than three noisy pixels in the level2.evt file, extra rows are filled as -1
| Pixel properties | Quadrant properties | ||||||
|---|---|---|---|---|---|---|---|
| Quadrant | DetID | PixID | Counts | Sigma | Mean | Median | Sigma |
| A | 12 | 189 | 80404 | 838.22 | 464 | 453 | 95.4 |
| A | 1 | 162 | 20449 | 209.64 | 464 | 453 | 95.4 |
| A | 15 | 223 | 9940 | 99.46 | 464 | 453 | 95.4 |
| B | 4 | 239 | 1646947 | 20957.16 | 413 | 404 | 78.6 |
| B | 0 | 85 | 491417 | 6249.6 | 413 | 404 | 78.6 |
| B | 3 | 209 | 25516 | 319.62 | 413 | 404 | 78.6 |
| C | 8 | 128 | 6881 | 60.29 | 459 | 463 | 106.4 |
| C | 8 | 112 | 3851 | 31.83 | 459 | 463 | 106.4 |
| C | 12 | 4 | 3725 | 30.64 | 459 | 463 | 106.4 |
| D | 1 | 52 | 1644036 | 16399.38 | 417 | 405 | 100.2 |
| D | 14 | 34 | 53046 | 525.23 | 417 | 405 | 100.2 |
| D | 2 | 234 | 13800 | 133.65 | 417 | 405 | 100.2 |
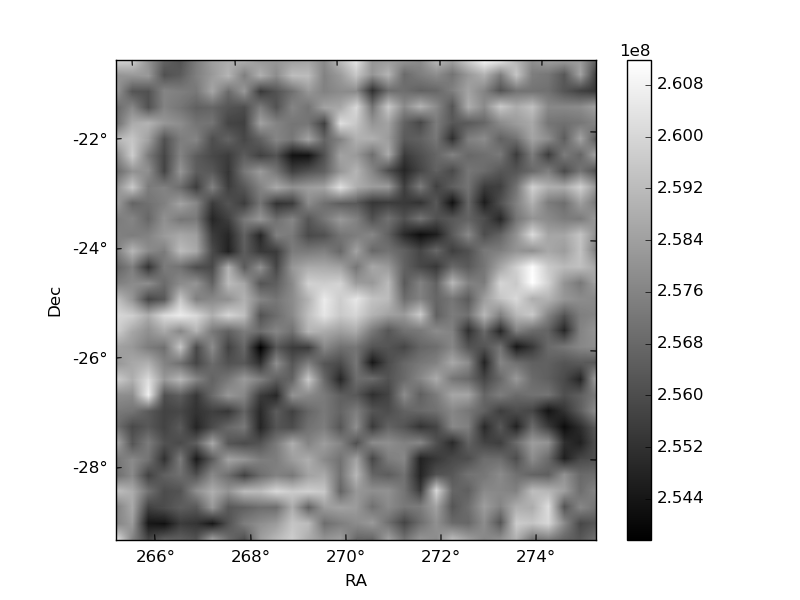
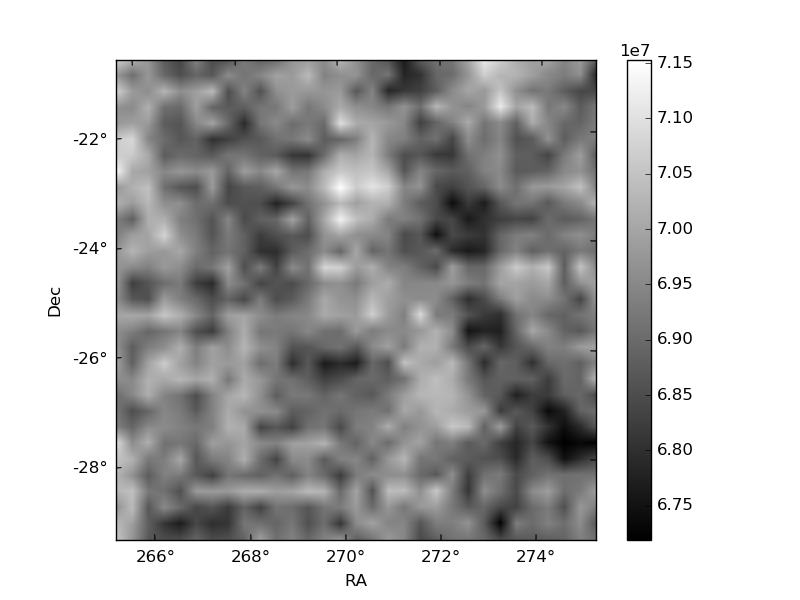
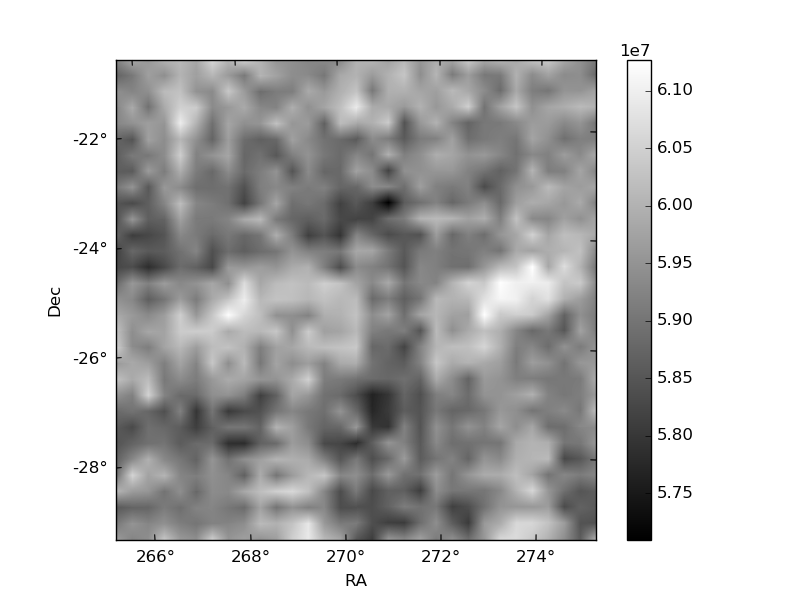
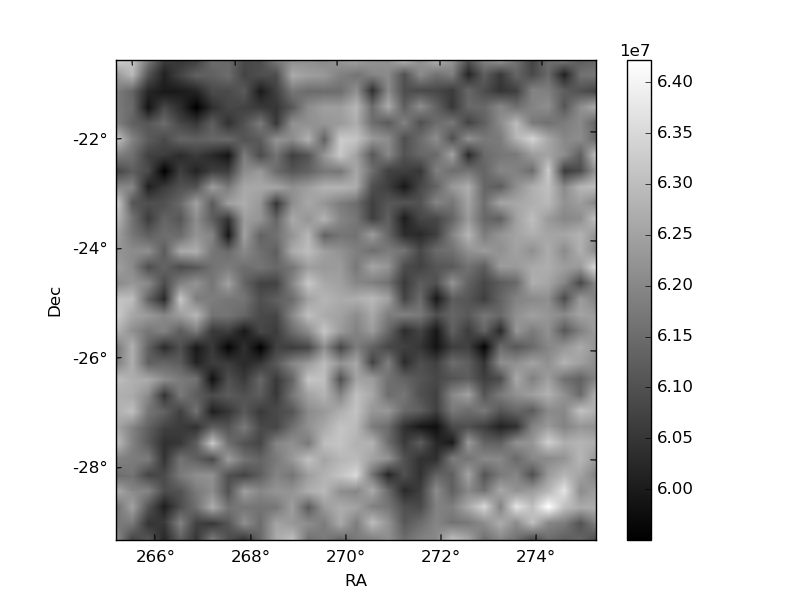
Histogram calculated using DETX and DETY for each event in the final _common_clean file
| Quadrant A | 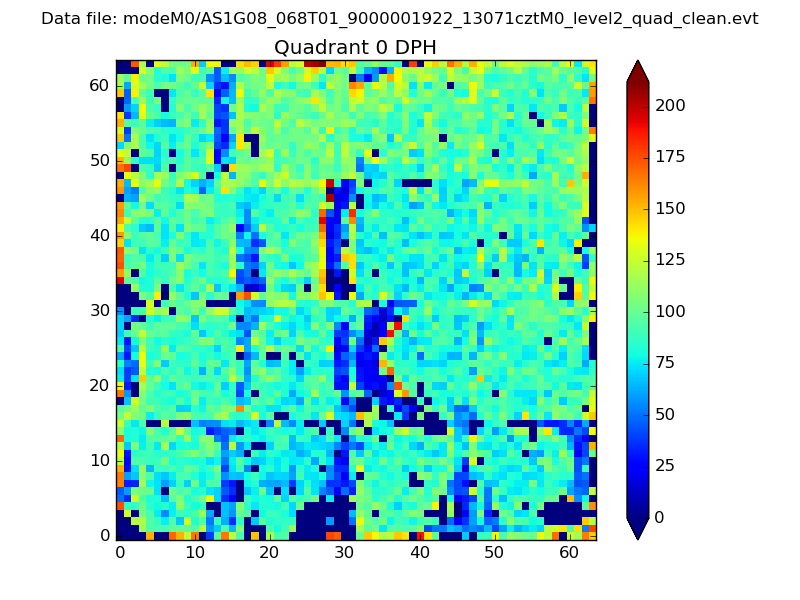 |
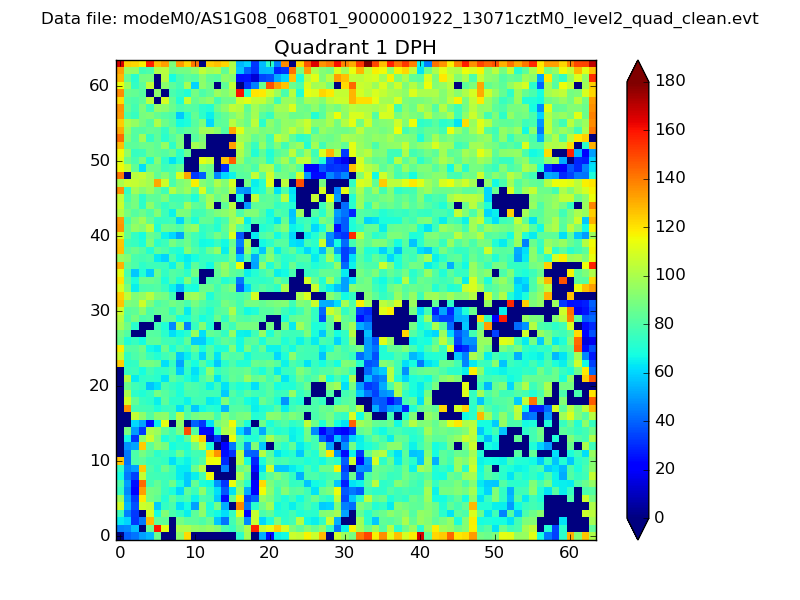 |
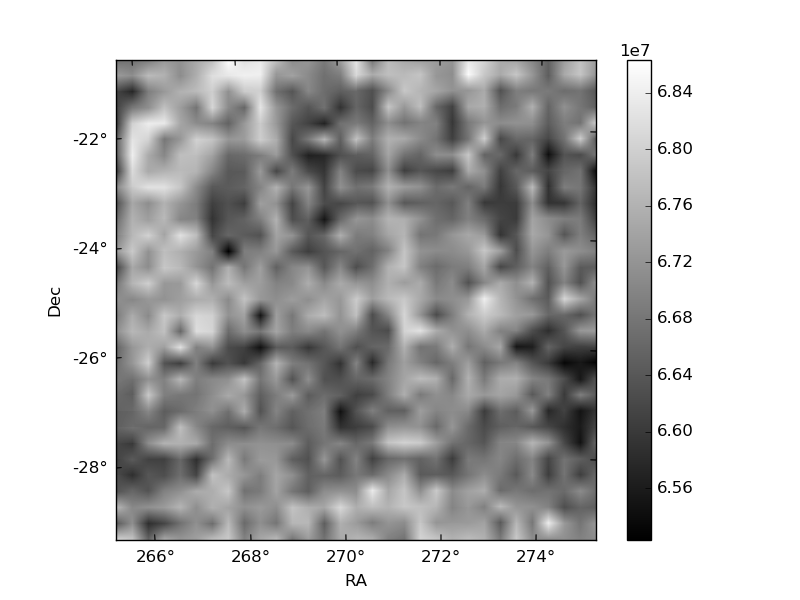
Quadrant B |
|---|---|---|---|
| Quadrant D | 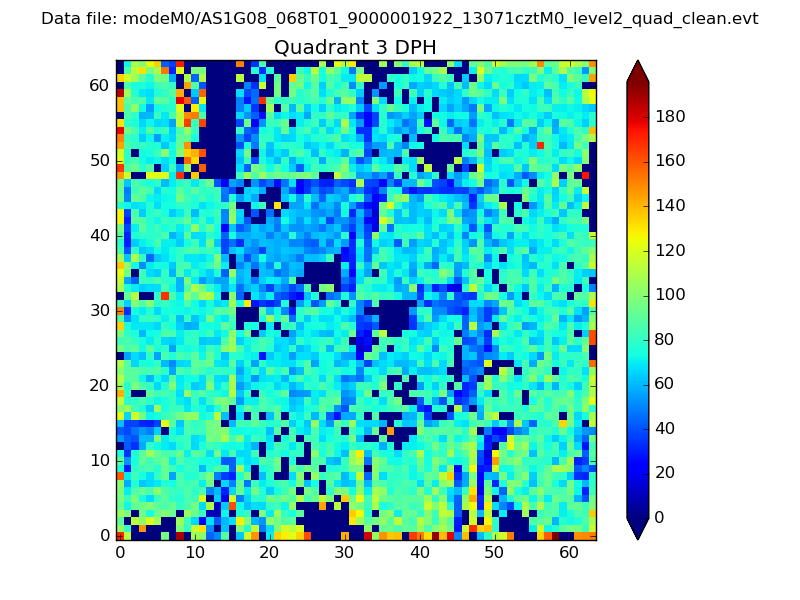 |
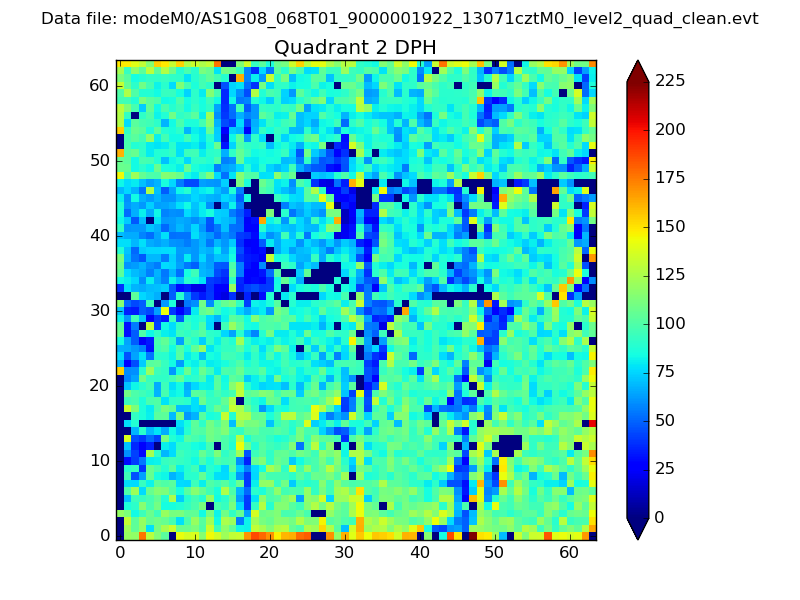 |
Quadrant C |
| Plot type | Count rate plots | Images |
|---|---|---|
| Comparison with Poisson distribution Blue bars denote a histogram of data divided into 1 sec bins. Red curve is a Poisson curve with rate = median count rate of data. |
 |
 |
| Quadrant-wise count rates Data is divided into 100 sec bins |
 |
|
| Module-wise count rates for Quadrant A Data is divided into 100 sec bins |
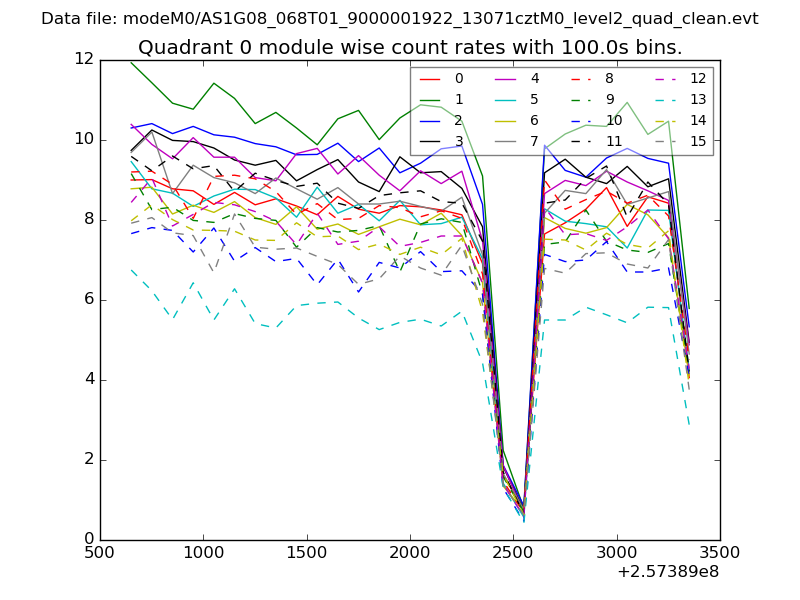 |
 |
| Module-wise count rates for Quadrant B Data is divided into 100 sec bins |
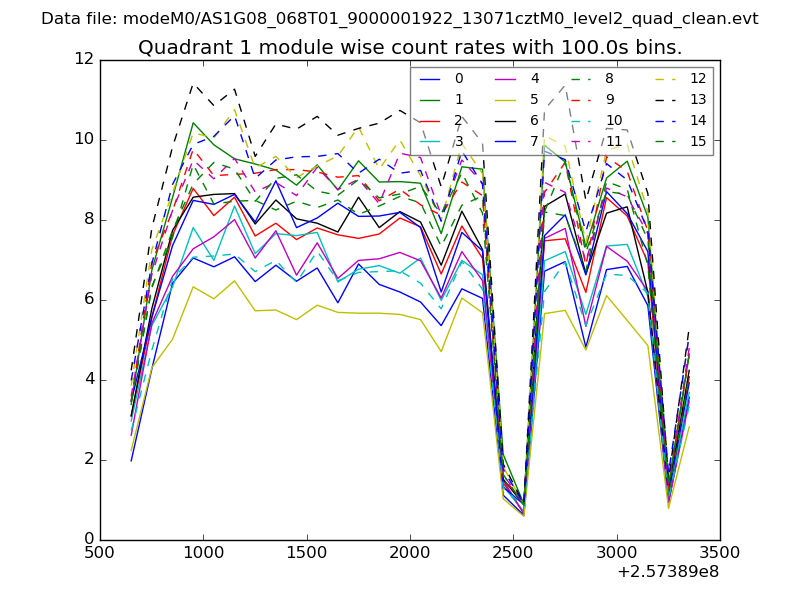 |
 |
| Module-wise count rates for Quadrant C Data is divided into 100 sec bins |
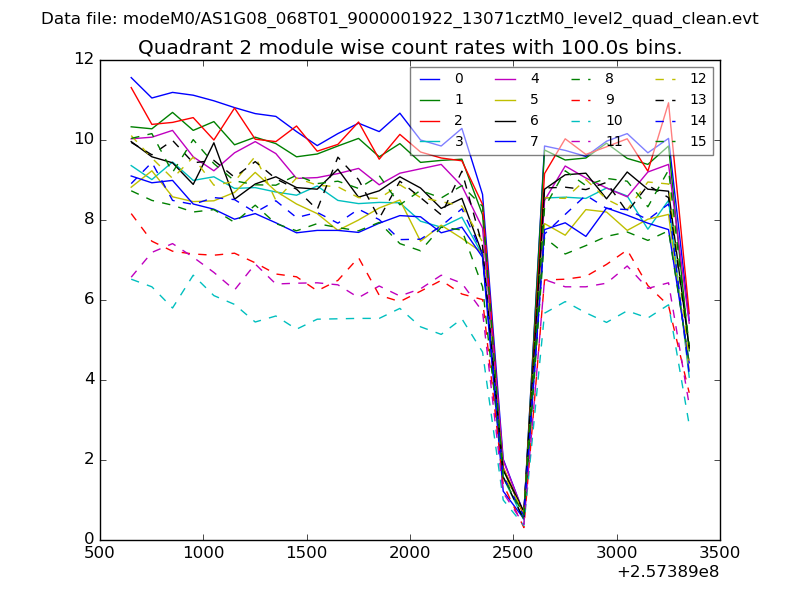 |
 |
| Module-wise count rates for Quadrant D Data is divided into 100 sec bins |
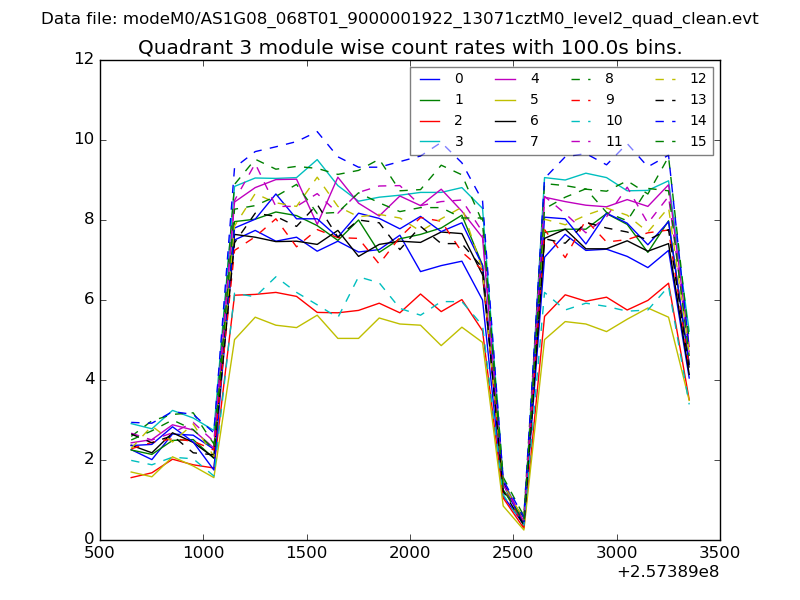 |
 |
| Parameter | Plot |
|---|---|
| CZT HV Monitor | 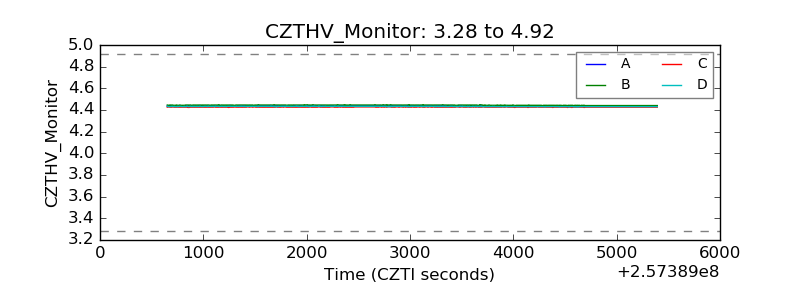 |
| D_VDD | 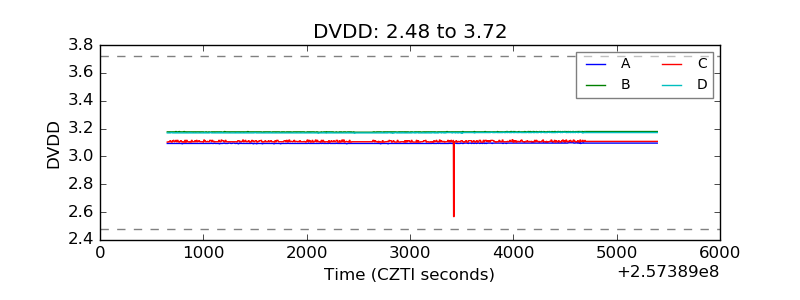 |
| Temperature 1 | 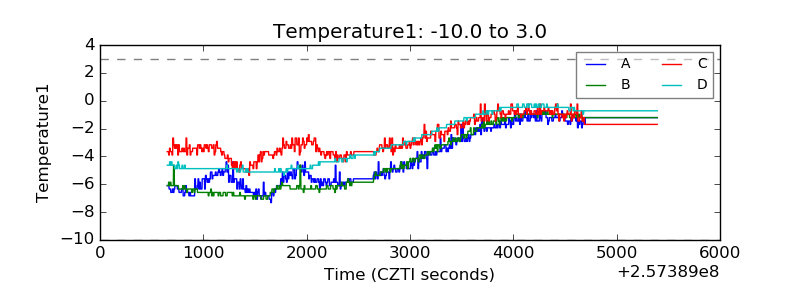 |
| Veto HV Monitor | 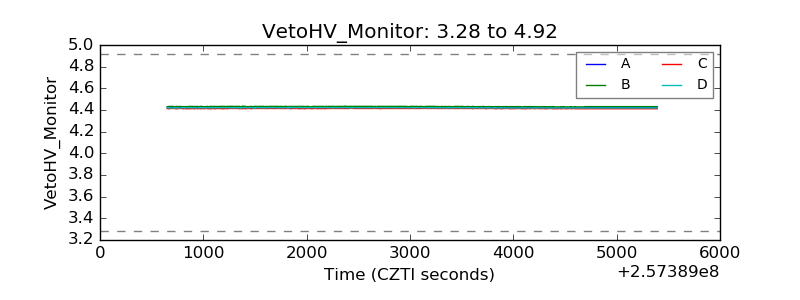 |
| Veto LLD | 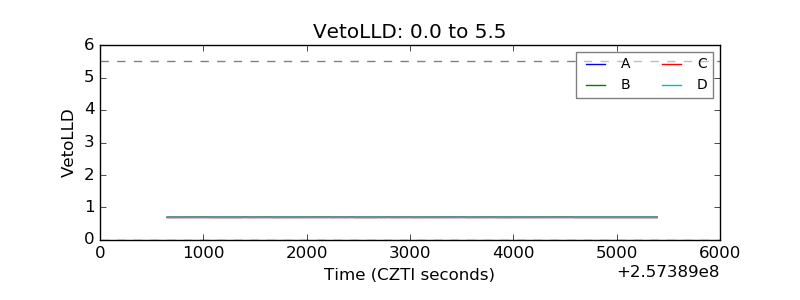 |
| Alpha Counter |  |
| _CPM_Rate |  |
| CZT Counter | 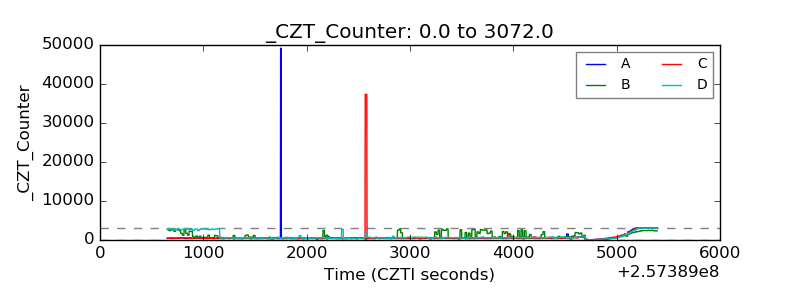 |
| +2.5 Volts monitor |  |
| +5 Volts monitor |  |
| _ROLL_ROT | 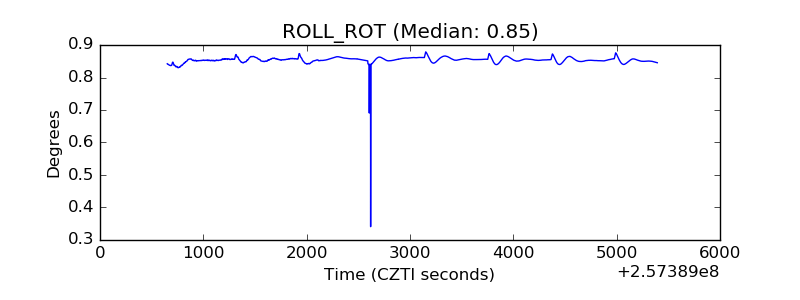 |
| _Roll_DEC | 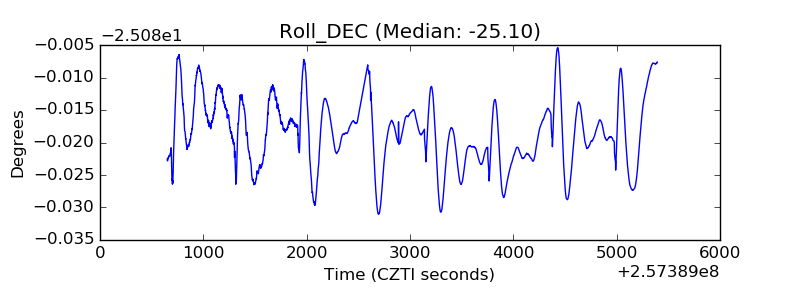 |
| _Roll_RA | 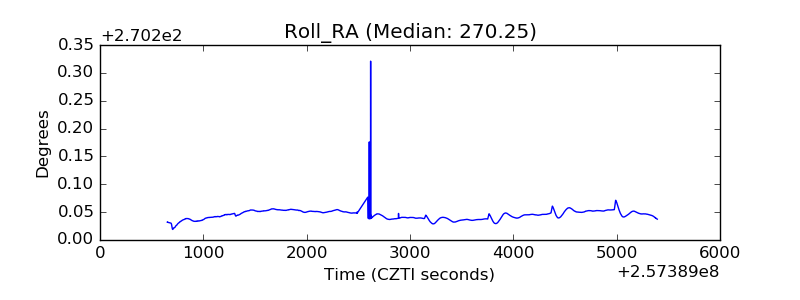 |
| Veto Counter | 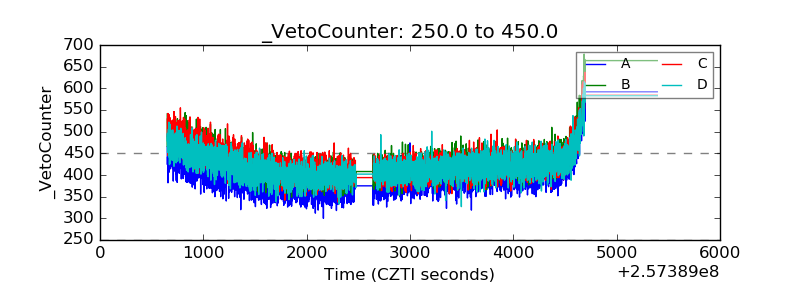 |