| Param | Original file | Final file |
|---|---|---|
| Filename | modeM0/AS1A04_067T01_9000001926cztM0_level2.fits | modeM0/AS1A04_067T01_9000001926cztM0_level2_quad_clean.evt |
| Size (bytes) | 566,815,680 | 513,682,560 |
| Size | 540.6 MB | 489.9 MB |
| Events in quadrant A | 3,482,708 | 3,033,096 |
| Events in quadrant B | 3,040,610 | 2,669,612 |
| Events in quadrant C | 3,431,670 | 2,934,406 |
| Events in quadrant D | 2,958,866 | 2,671,576 |
| Mode M9 | |||
|---|---|---|---|
| Quadrant | BADHDUFLAG | Total packets | Discarded packets |
| A | 0 | 101 | 0 |
| B | 0 | 100 | 0 |
| C | 0 | 102 | 0 |
| D | 0 | 103 | 0 |
| Mode SS | |||
|---|---|---|---|
| Quadrant | BADHDUFLAG | Total packets | Discarded packets |
| A | 0 | 1120 | 0 |
| B | 0 | 1286 | 0 |
| C | 0 | 1284 | 0 |
| D | 0 | 1282 | 0 |
| Mode M0 | |||
|---|---|---|---|
| Quadrant | BADHDUFLAG | Total packets | Discarded packets |
| A | 0 | 130126 | 0 |
| B | 0 | 182323 | 0 |
| C | 0 | 136124 | 0 |
| D | 0 | 155957 | 0 |
| Quadrant | Total seconds | Saturated seconds | Saturation percentage |
|---|---|---|---|
| A | 62003 | 554 | 0.893505% |
| B | 61937 | 8978 | 14.495374% |
| C | 61995 | 906 | 1.461408% |
| D | 61964 | 1987 | 3.206701% |
Noise dominated data is calculated using 1-second bins in cleaned event files. If a bin has >2000 counts, and if more than 50% of those come from <1% of pixels, then it is considered to be noise-dominated and hence unusable.
| Quadrant | # 1 sec bins | Bins with >0 counts | Bins with >2000 counts | High rate bins dominated by noise | Noise dominated (total time) | Noise dominated (detector-on time) | Marked lightcurve |
|---|---|---|---|---|---|---|---|
| A | 75203 | 62277 | 0 | 0 | 0.00% | 0.00% | 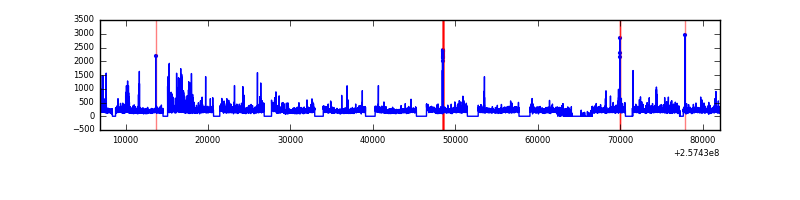 |
| B | 75203 | 60254 | 0 | 0 | 0.00% | 0.00% | 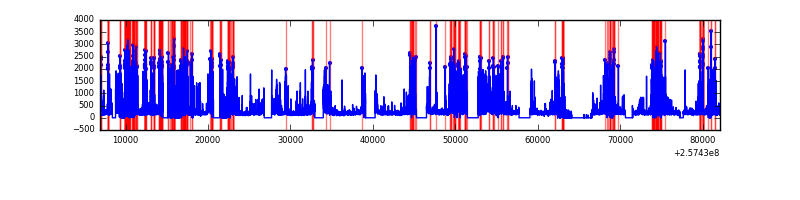 |
| C | 75203 | 62282 | 0 | 0 | 0.00% | 0.00% |  |
| D | 75203 | 62244 | 0 | 0 | 0.00% | 0.00% |  |
Top three noisy pixels from each quadrant. If the there are fewer than three noisy pixels in the level2.evt file, extra rows are filled as -1
| Pixel properties | Quadrant properties | ||||||
|---|---|---|---|---|---|---|---|
| Quadrant | DetID | PixID | Counts | Sigma | Mean | Median | Sigma |
| A | 0 | 29 | 3349 | 11.13 | 906 | 853 | 224.2 |
| A | 7 | 110 | 2976 | 9.47 | 906 | 853 | 224.2 |
| A | 9 | 19 | 2726 | 8.36 | 906 | 853 | 224.2 |
| B | 2 | 9 | 2669 | 12.13 | 801 | 766 | 156.8 |
| B | 2 | 8 | 2041 | 8.13 | 801 | 766 | 156.8 |
| B | 3 | 17 | 2035 | 8.09 | 801 | 766 | 156.8 |
| C | 1 | 81 | 2567 | 7.36 | 906 | 846 | 233.9 |
| C | 1 | 80 | 2544 | 7.26 | 906 | 846 | 233.9 |
| C | 12 | 241 | 2485 | 7.01 | 906 | 846 | 233.9 |
| D | 6 | 231 | 2183 | 6.22 | 844 | 767 | 227.7 |
| D | 1 | 19 | 2082 | 5.78 | 844 | 767 | 227.7 |
| D | 6 | 67 | 2081 | 5.77 | 844 | 767 | 227.7 |
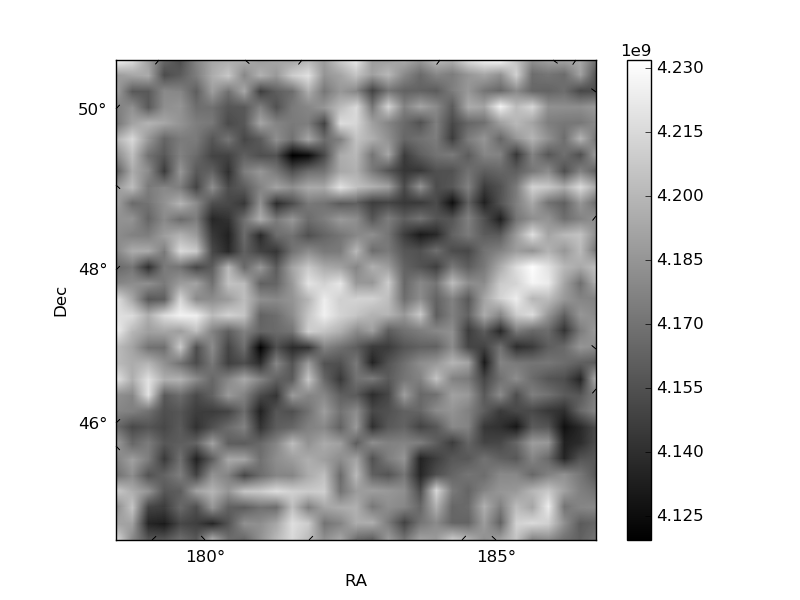
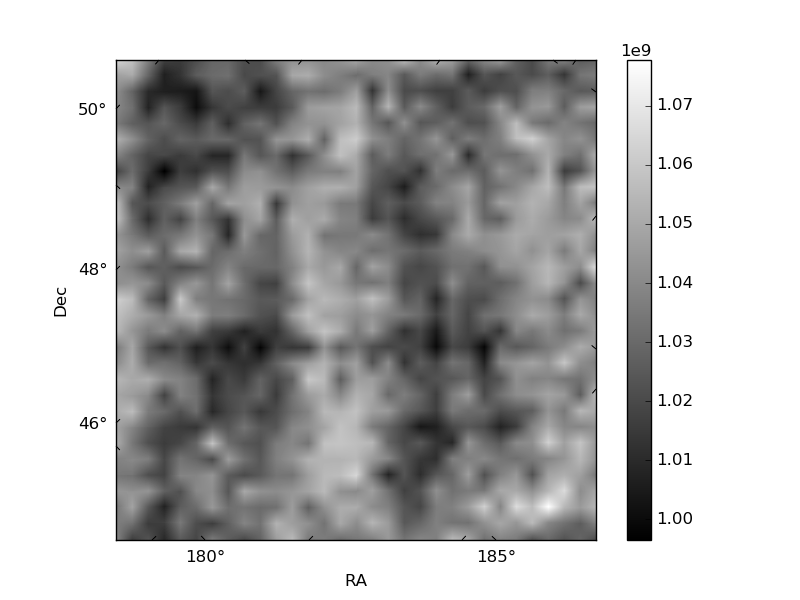
Histogram calculated using DETX and DETY for each event in the final _common_clean file
| Quadrant A |  |
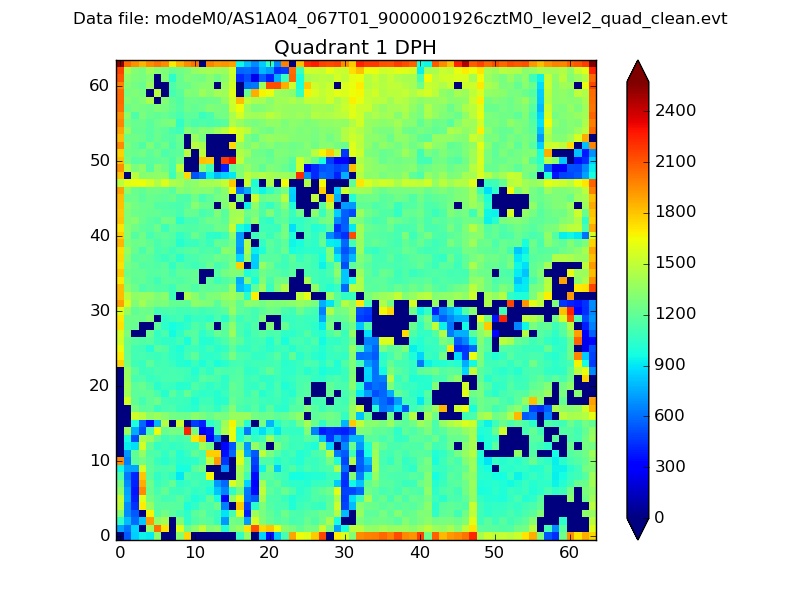 |
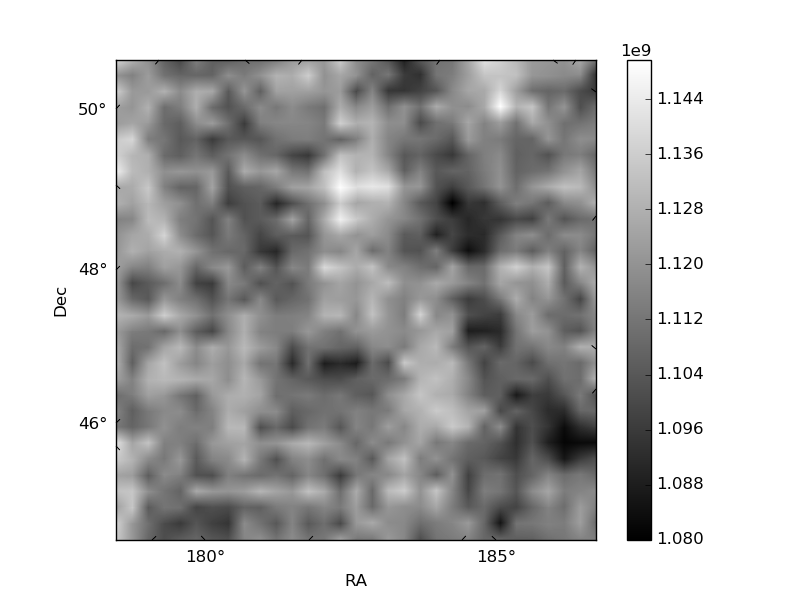
Quadrant B |
|---|---|---|---|
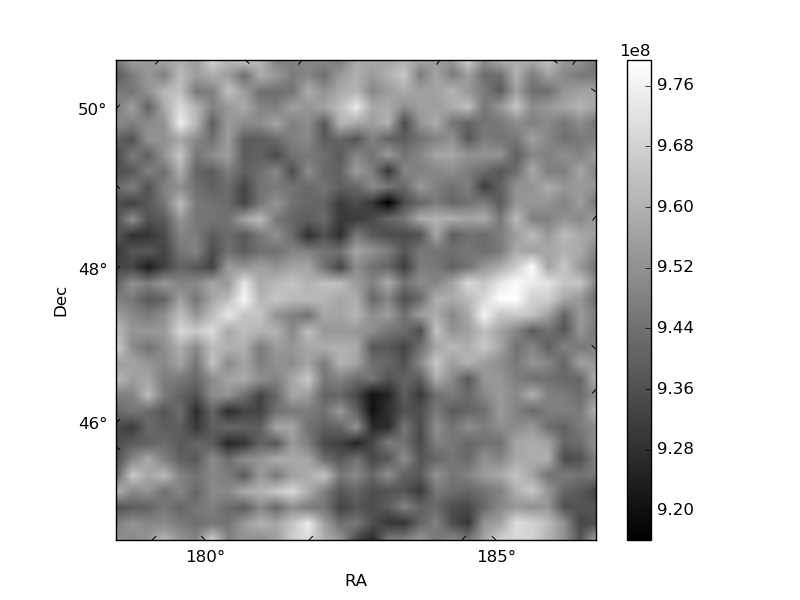
| Quadrant D |  |
 |
Quadrant C |
| Plot type | Count rate plots | Images |
|---|---|---|
| Comparison with Poisson distribution Blue bars denote a histogram of data divided into 1 sec bins. Red curve is a Poisson curve with rate = median count rate of data. |
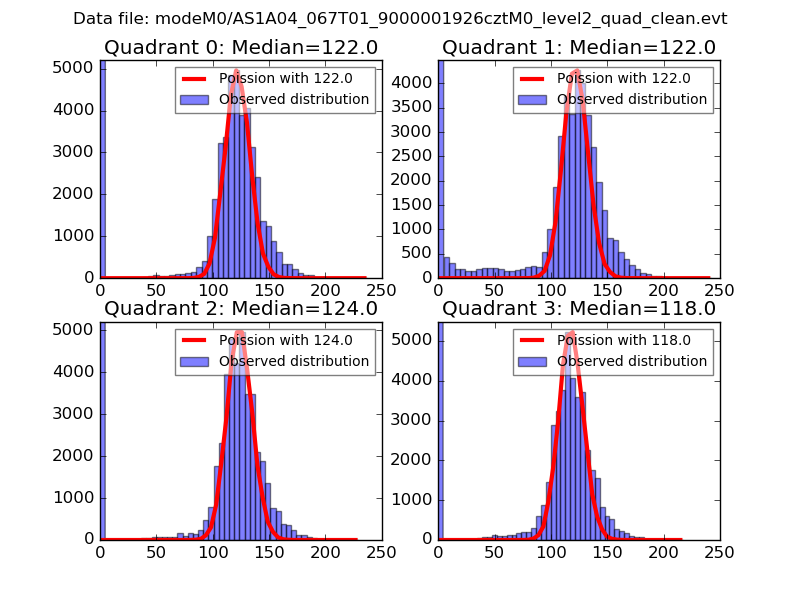 |
 |
| Quadrant-wise count rates Data is divided into 100 sec bins |
 |
|
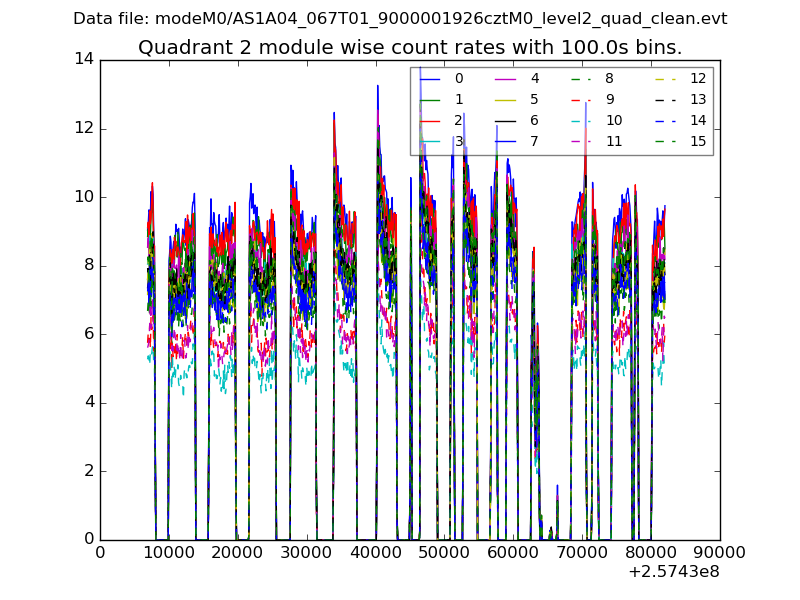
| Module-wise count rates for Quadrant A Data is divided into 100 sec bins |
 |
 |
| Module-wise count rates for Quadrant B Data is divided into 100 sec bins |
 |
 |
| Module-wise count rates for Quadrant C Data is divided into 100 sec bins |
 |
 |
| Module-wise count rates for Quadrant D Data is divided into 100 sec bins |
 |
 |
| Parameter | Plot |
|---|---|
| CZT HV Monitor |  |
| D_VDD | 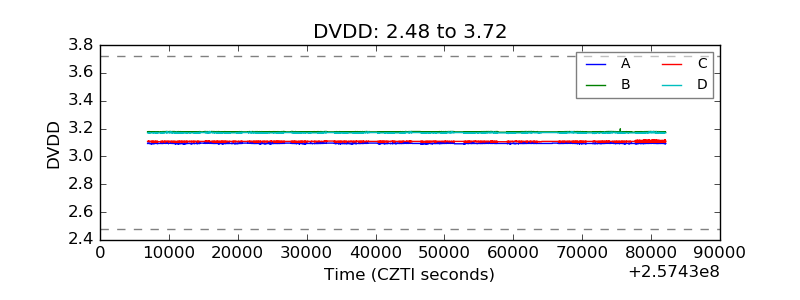 |
| Temperature 1 |  |
| Veto HV Monitor |  |
| Veto LLD |  |
| Alpha Counter | 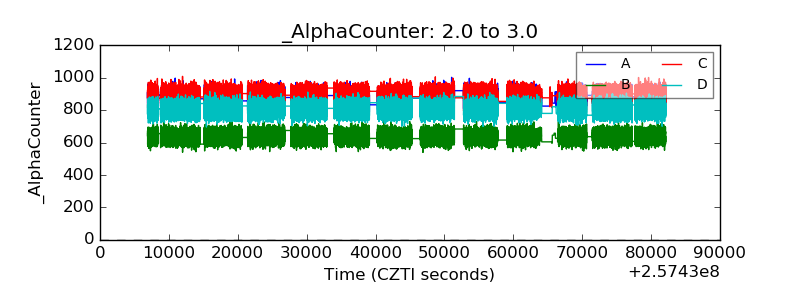 |
| _CPM_Rate |  |
| CZT Counter |  |
| +2.5 Volts monitor |  |
| +5 Volts monitor |  |
| _ROLL_ROT |  |
| _Roll_DEC |  |
| _Roll_RA | 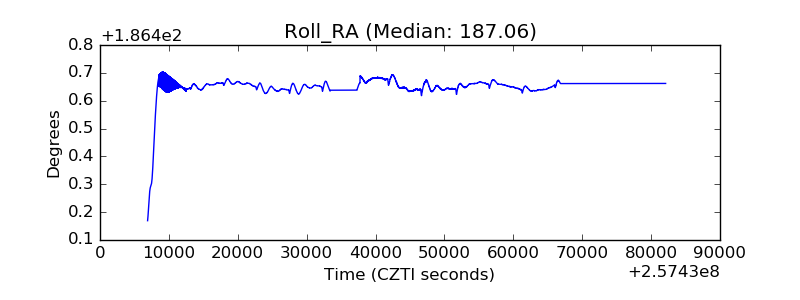 |
| Veto Counter |  |