| Param | Original file | Final file |
|---|---|---|
| Filename | modeM0/AS1A04_067T01_9000001926_13078cztM0_level2.evt | modeM0/AS1A04_067T01_9000001926_13078cztM0_level2_quad_clean.evt |
| Size (bytes) | 37,520,640 | 8,709,120 |
| Size | 35.8 MB | 8.3 MB |
| Events in quadrant A | 313,701 | 55,003 |
| Events in quadrant B | 317,277 | 56,356 |
| Events in quadrant C | 199,358 | 57,027 |
| Events in quadrant D | 271,057 | 54,483 |
| Mode SS | |||
|---|---|---|---|
| Quadrant | BADHDUFLAG | Total packets | Discarded packets |
| A | 0 | 8 | 0 |
| B | 0 | 8 | 0 |
| C | 0 | 8 | 0 |
| D | 0 | 8 | 0 |
| Mode M0 | |||
|---|---|---|---|
| Quadrant | BADHDUFLAG | Total packets | Discarded packets |
| A | 0 | 1223 | 1 |
| B | 0 | 1243 | 0 |
| C | 0 | 933 | 0 |
| D | 0 | 1129 | 0 |
| Quadrant | Total seconds | Saturated seconds | Saturation percentage |
|---|---|---|---|
| A | 466 | 26 | 5.579399% |
| B | 466 | 14 | 3.004292% |
| C | 466 | 0 | 0.000000% |
| D | 466 | 1 | 0.214592% |
Noise dominated data is calculated using 1-second bins in cleaned event files. If a bin has >2000 counts, and if more than 50% of those come from <1% of pixels, then it is considered to be noise-dominated and hence unusable.
| Quadrant | # 1 sec bins | Bins with >0 counts | Bins with >2000 counts | High rate bins dominated by noise | Noise dominated (total time) | Noise dominated (detector-on time) | Marked lightcurve |
|---|---|---|---|---|---|---|---|
| A | 467 | 467 | 17 | 17 | 3.64% | 3.64% | 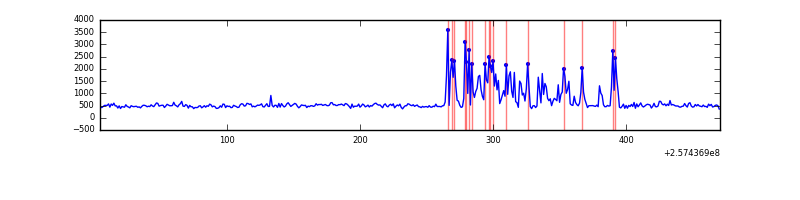 |
| B | 467 | 467 | 11 | 11 | 2.36% | 2.36% | 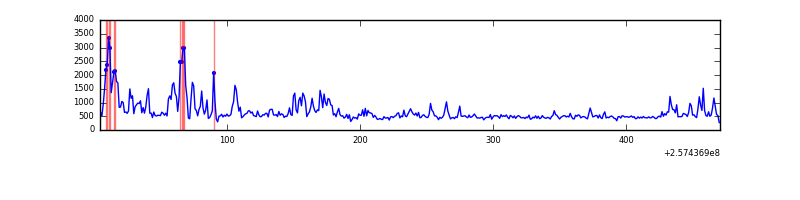 |
| C | 467 | 467 | 0 | 0 | 0.00% | 0.00% | 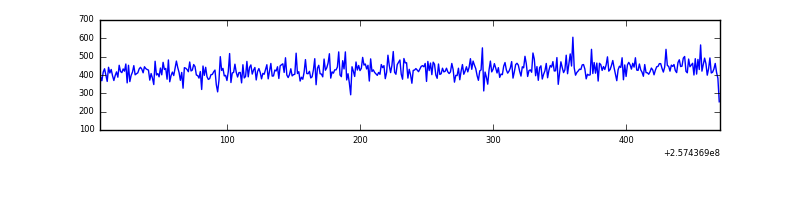 |
| D | 467 | 467 | 4 | 4 | 0.86% | 0.86% | 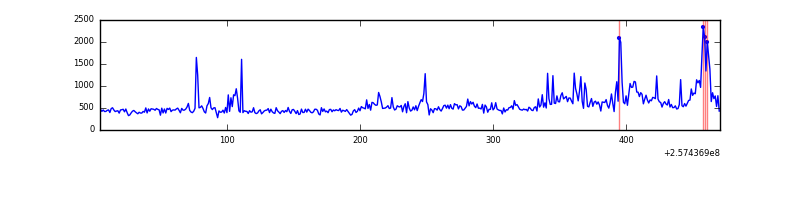 |
Top three noisy pixels from each quadrant. If the there are fewer than three noisy pixels in the level2.evt file, extra rows are filled as -1
| Pixel properties | Quadrant properties | ||||||
|---|---|---|---|---|---|---|---|
| Quadrant | DetID | PixID | Counts | Sigma | Mean | Median | Sigma |
| A | 15 | 223 | 57149 | 4518.01 | 51 | 50 | 12.6 |
| A | 15 | 239 | 27843 | 2199.14 | 51 | 50 | 12.6 |
| A | 8 | 15 | 15706 | 1238.79 | 51 | 50 | 12.6 |
| B | 4 | 239 | 102029 | 7971.58 | 52 | 51 | 12.8 |
| B | 0 | 85 | 10251 | 797.33 | 52 | 51 | 12.8 |
| B | 12 | 111 | 1213 | 90.83 | 52 | 51 | 12.8 |
| C | 15 | 208 | 680 | 45.25 | 50 | 50 | 13.9 |
| C | 13 | 61 | 403 | 25.35 | 50 | 50 | 13.9 |
| C | 8 | 222 | 206 | 11.21 | 50 | 50 | 13.9 |
| D | 1 | 52 | 71059 | 5135.94 | 49 | 48 | 13.8 |
| D | 10 | 157 | 11466 | 825.82 | 49 | 48 | 13.8 |
| D | 2 | 234 | 1961 | 138.36 | 49 | 48 | 13.8 |
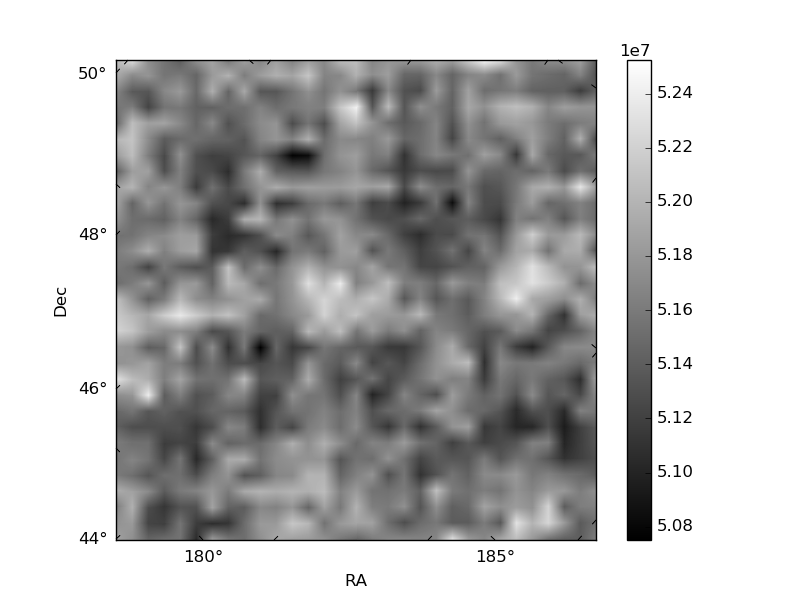
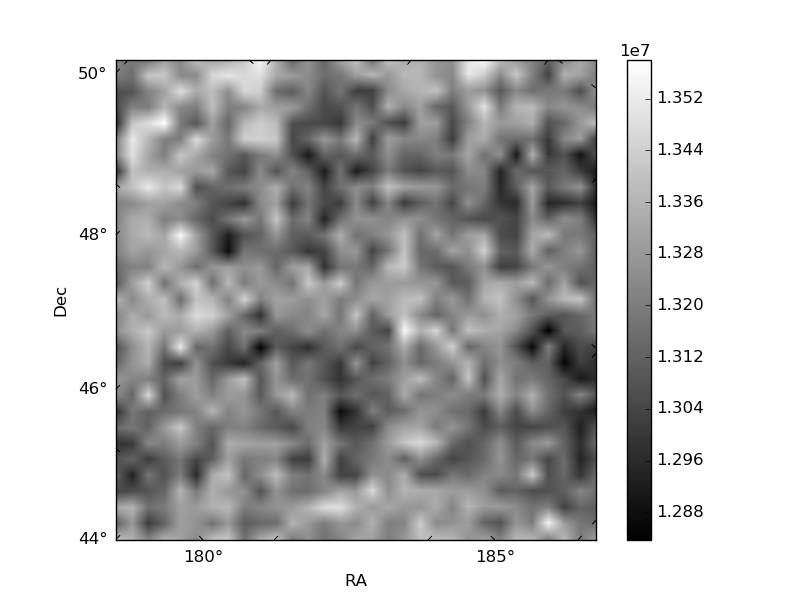
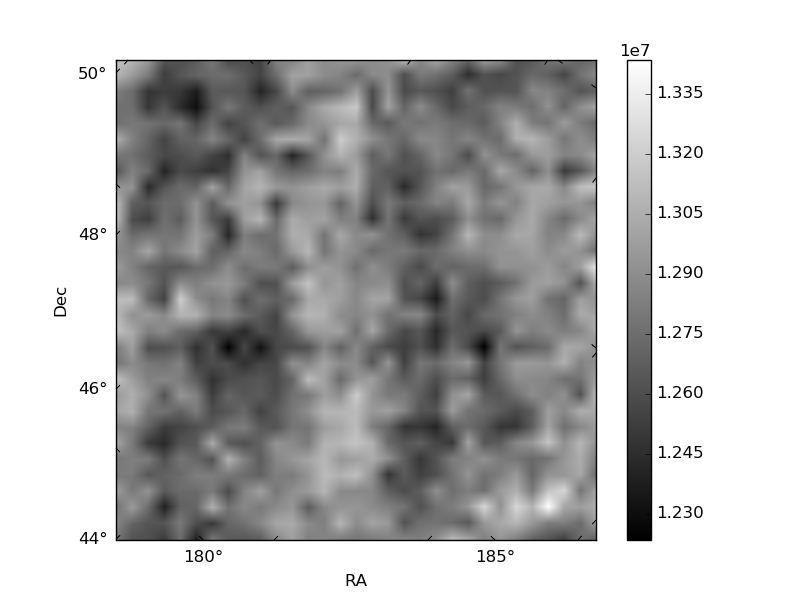
Histogram calculated using DETX and DETY for each event in the final _common_clean file
| Quadrant A | 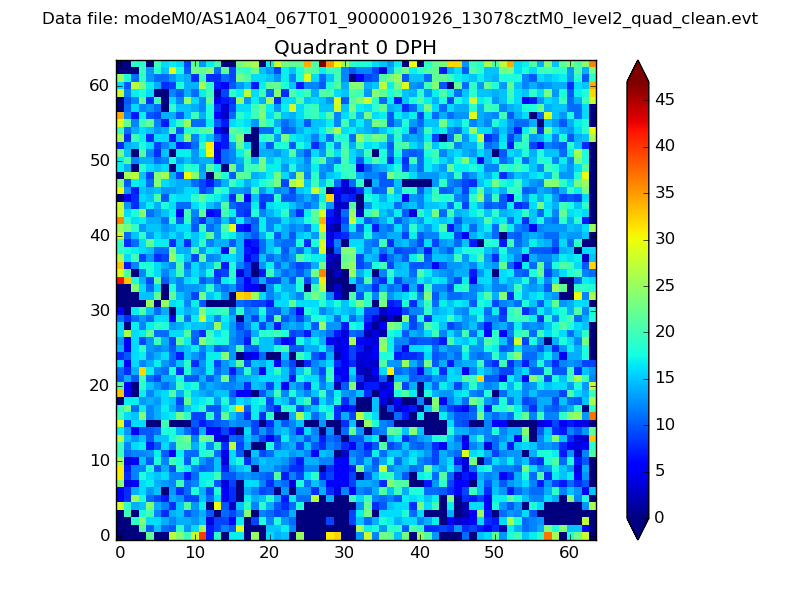 |
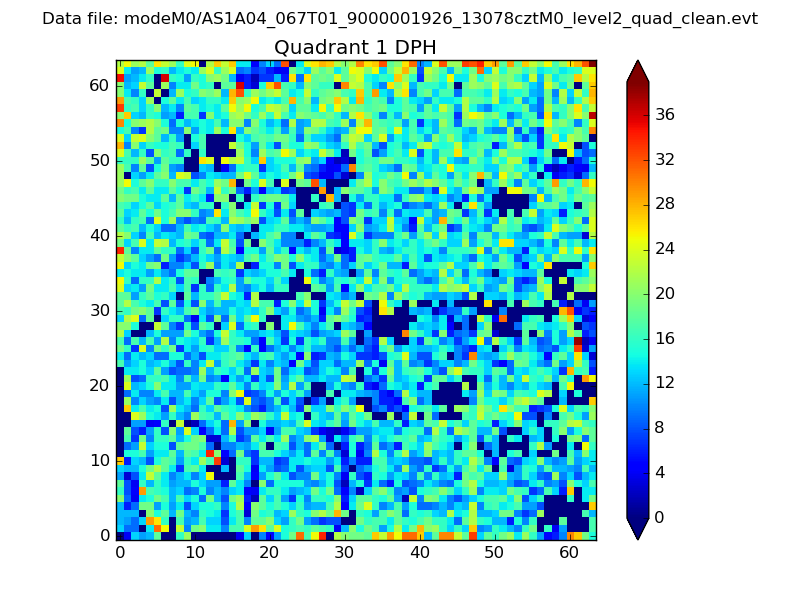 |
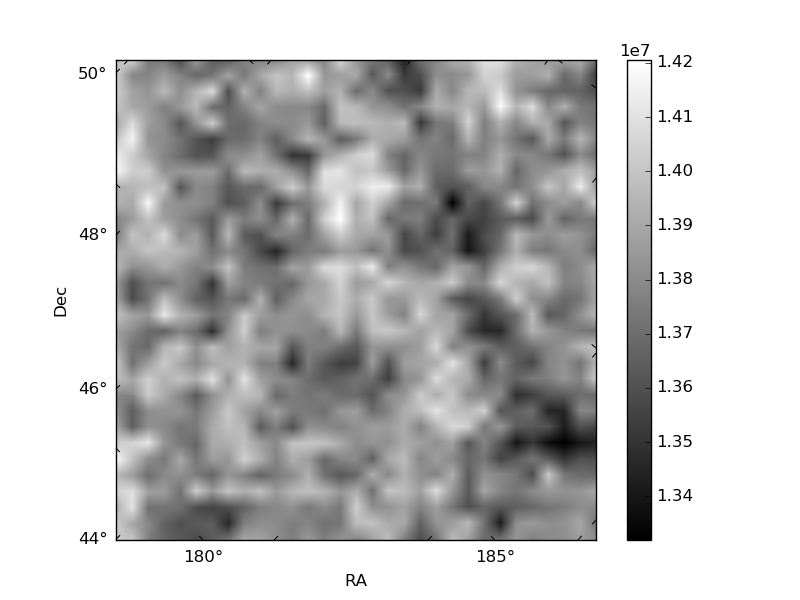
Quadrant B |
|---|---|---|---|
| Quadrant D | 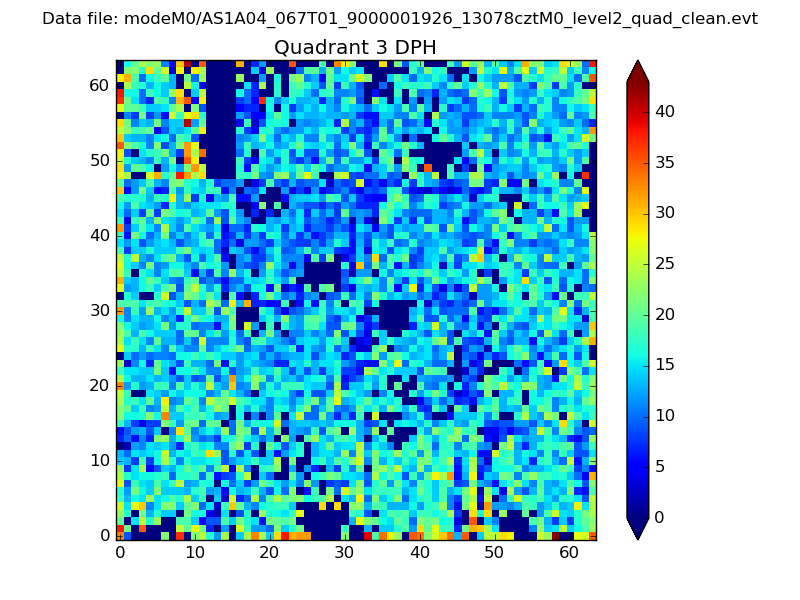 |
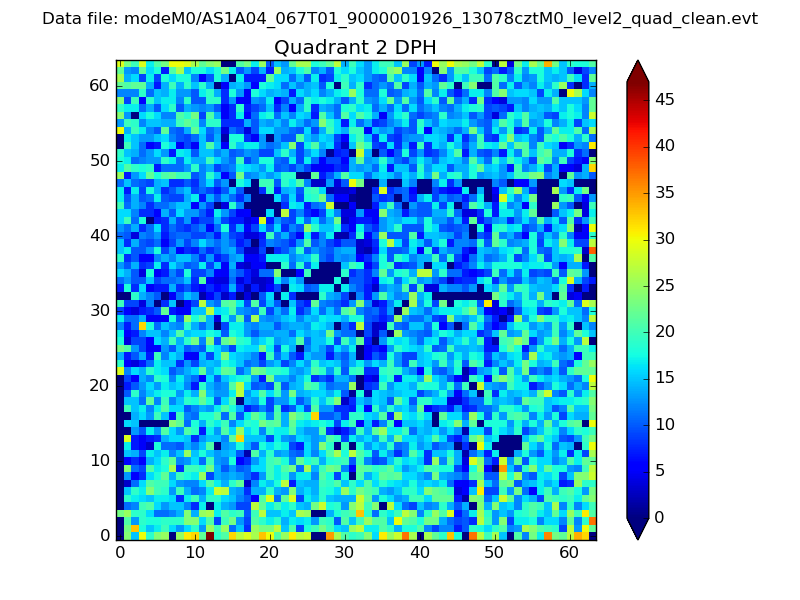 |
Quadrant C |
| Plot type | Count rate plots | Images |
|---|---|---|
| Comparison with Poisson distribution Blue bars denote a histogram of data divided into 1 sec bins. Red curve is a Poisson curve with rate = median count rate of data. |
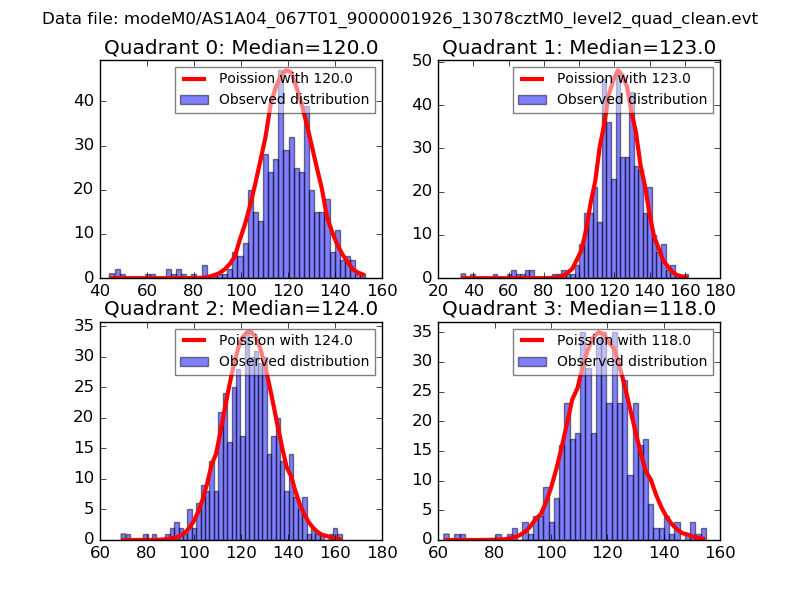 |
 |
| Quadrant-wise count rates Data is divided into 100 sec bins |
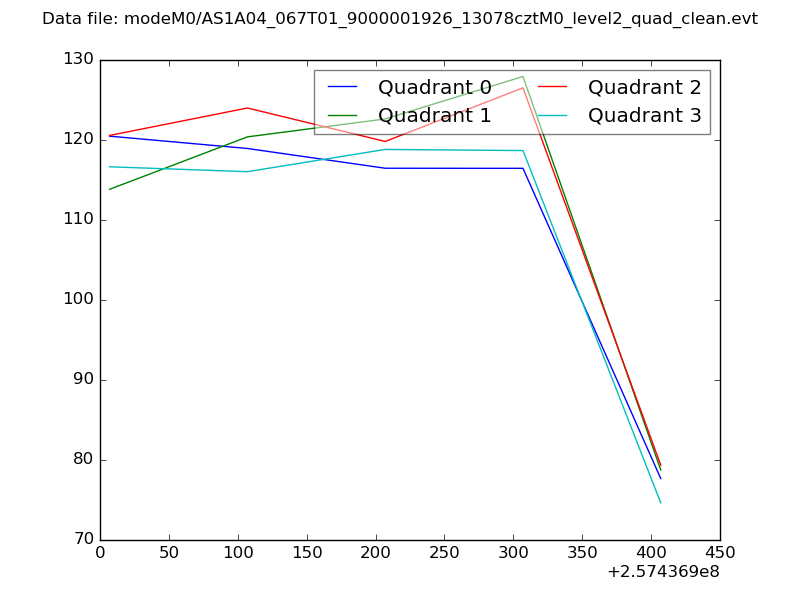 |
|
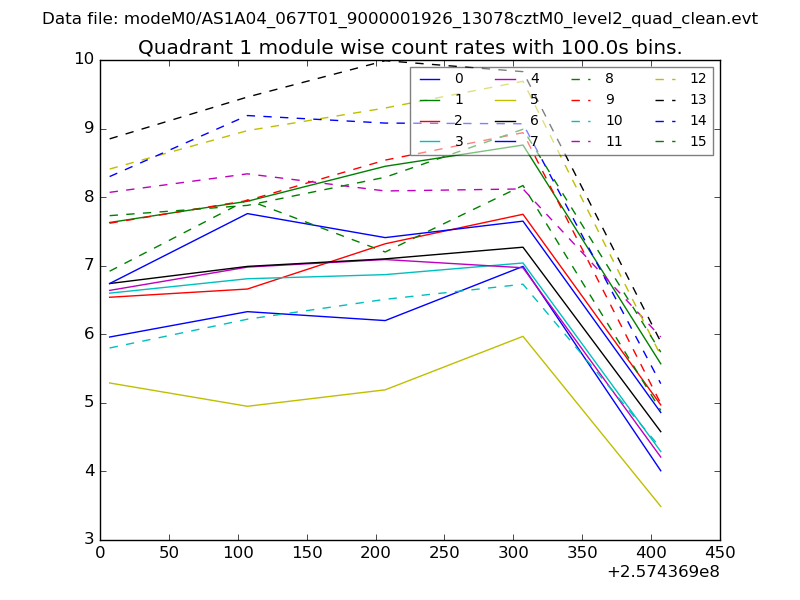
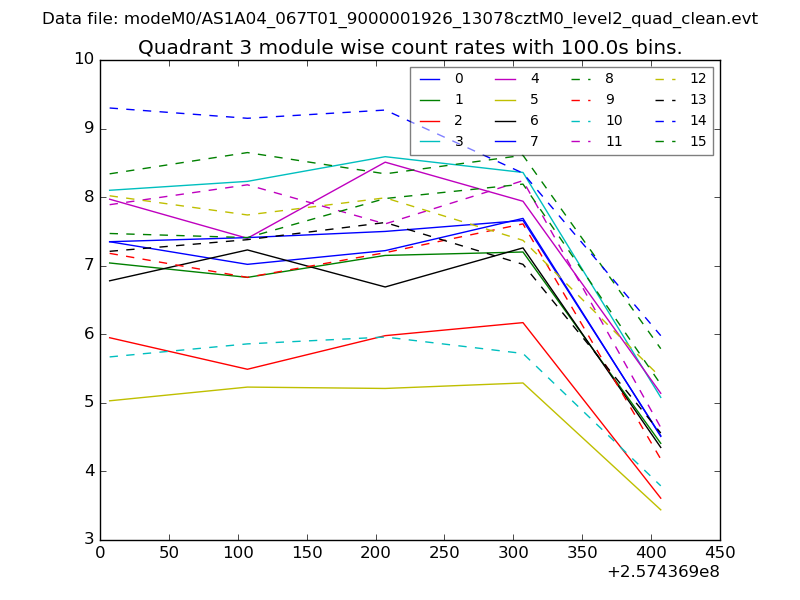
| Module-wise count rates for Quadrant A Data is divided into 100 sec bins |
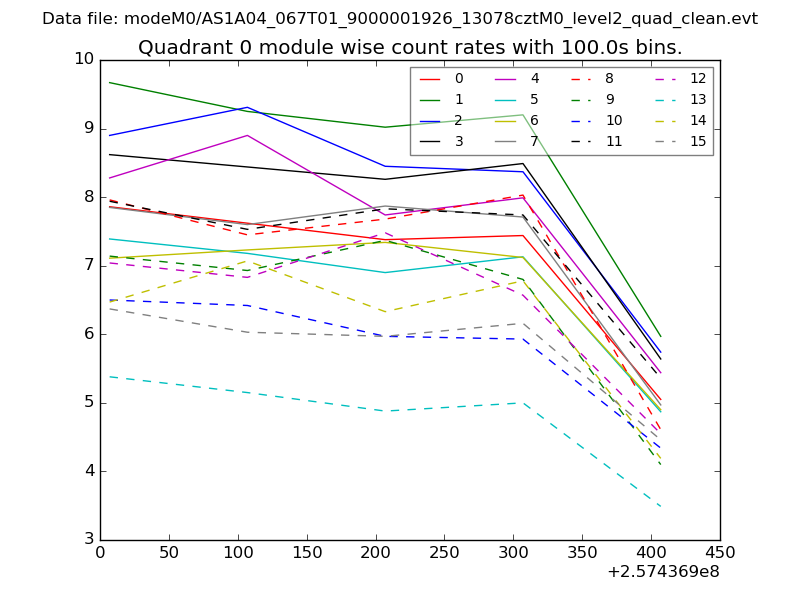 |
 |
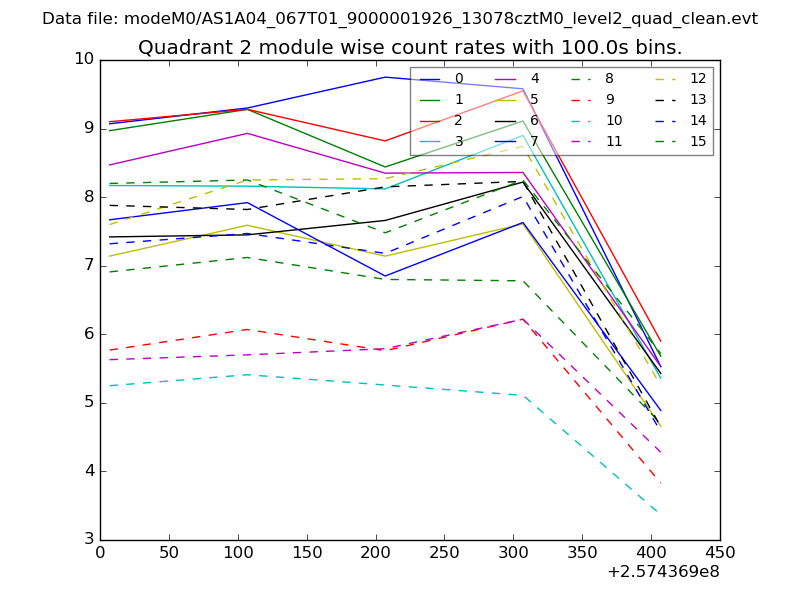
| Module-wise count rates for Quadrant B Data is divided into 100 sec bins |
 |
 |
| Module-wise count rates for Quadrant C Data is divided into 100 sec bins |
 |
 |
| Module-wise count rates for Quadrant D Data is divided into 100 sec bins |
 |
 |
| Parameter | Plot |
|---|---|
| CZT HV Monitor | 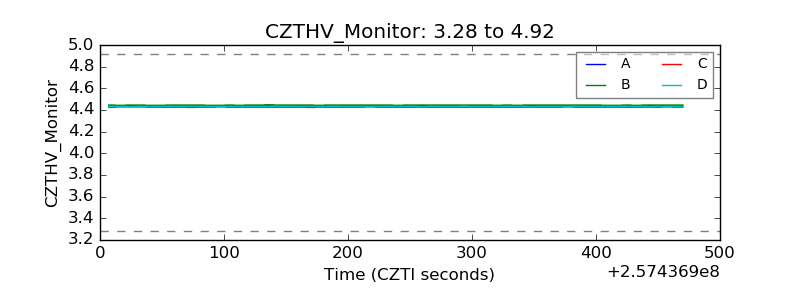 |
| D_VDD | 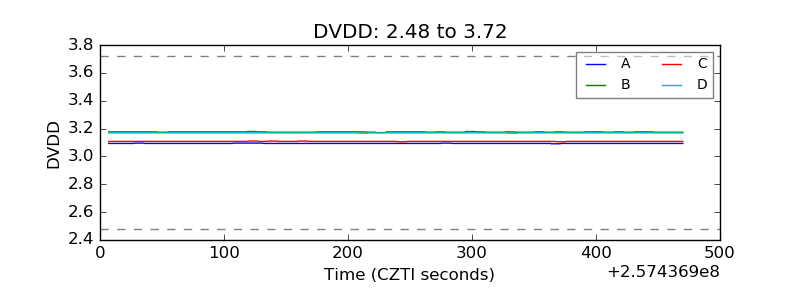 |
| Temperature 1 |  |
| Veto HV Monitor | 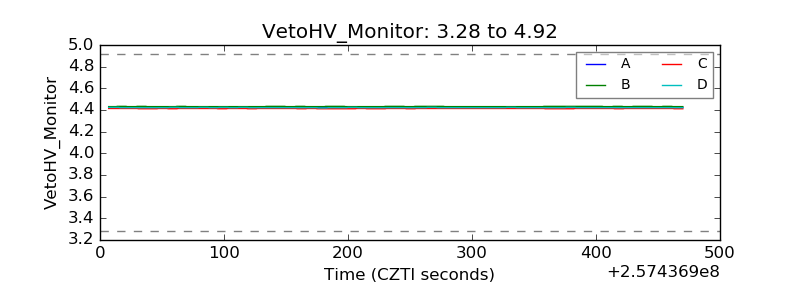 |
| Veto LLD | 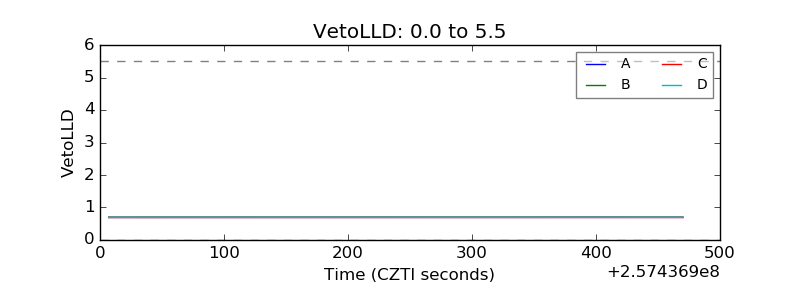 |
| Alpha Counter | 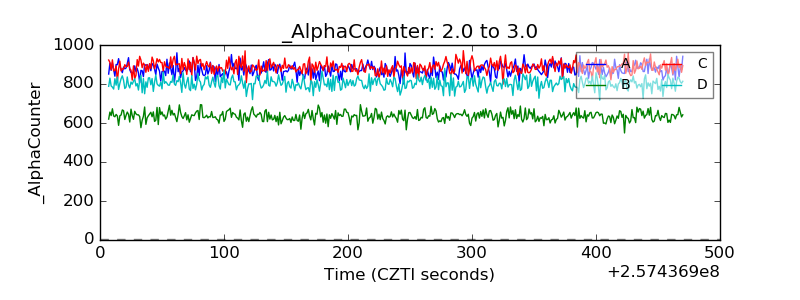 |
| _CPM_Rate | 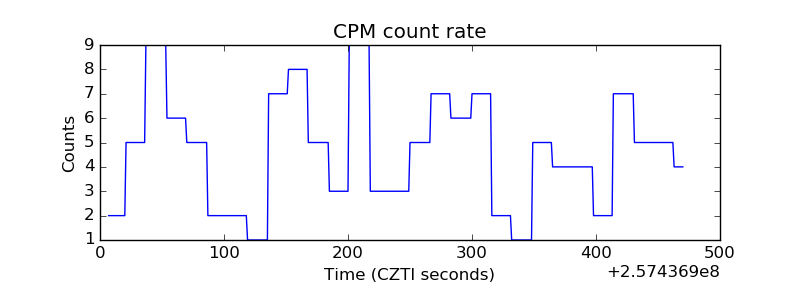 |
| CZT Counter | 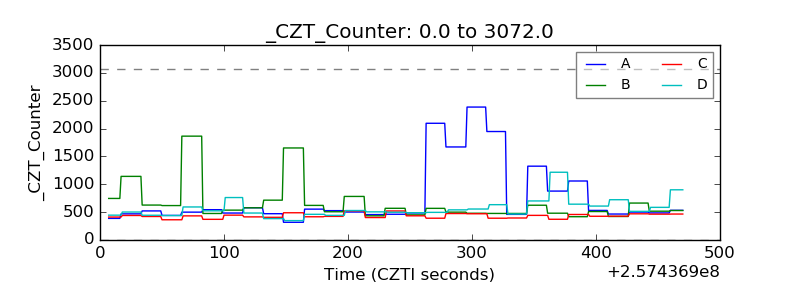 |
| +2.5 Volts monitor |  |
| +5 Volts monitor |  |
| _ROLL_ROT |  |
| _Roll_DEC | 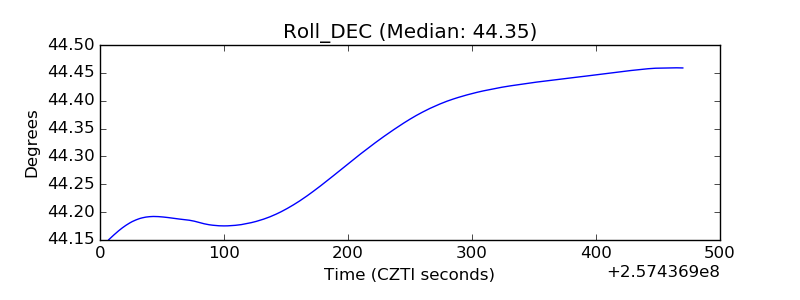 |
| _Roll_RA | 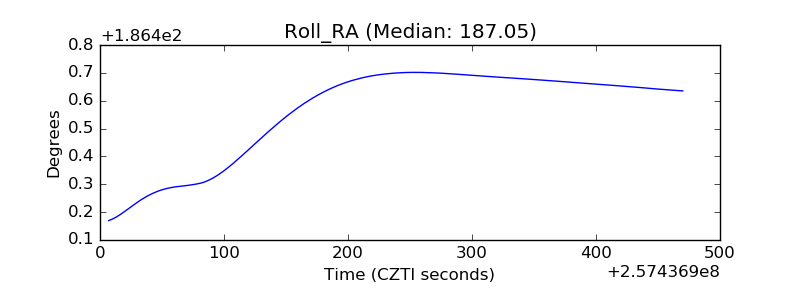 |
| Veto Counter | 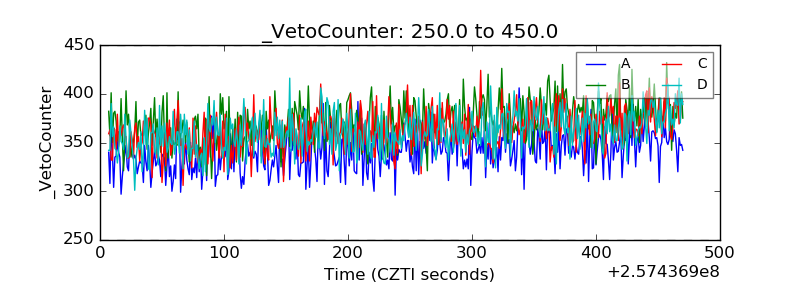 |