| Param | Original file | Final file |
|---|---|---|
| Filename | modeM0/AS1A04_067T01_9000001926_13079cztM0_level2.evt | modeM0/AS1A04_067T01_9000001926_13079cztM0_level2_quad_clean.evt |
| Size (bytes) | 1,752,586,560 | 250,591,680 |
| Size | 1.6 GB | 239.0 MB |
| Events in quadrant A | 9,837,899 | 1,650,267 |
| Events in quadrant B | 18,506,941 | 1,357,820 |
| Events in quadrant C | 9,418,297 | 1,669,881 |
| Events in quadrant D | 14,002,579 | 1,571,430 |
| Mode M9 | |||
|---|---|---|---|
| Quadrant | BADHDUFLAG | Total packets | Discarded packets |
| A | 0 | 26 | 0 |
| B | 0 | 26 | 0 |
| C | 0 | 26 | 0 |
| D | 0 | 26 | 0 |
| Mode SS | |||
|---|---|---|---|
| Quadrant | BADHDUFLAG | Total packets | Discarded packets |
| A | 0 | 396 | 0 |
| B | 0 | 396 | 0 |
| C | 0 | 396 | 0 |
| D | 0 | 396 | 0 |
| Mode M0 | |||
|---|---|---|---|
| Quadrant | BADHDUFLAG | Total packets | Discarded packets |
| A | 0 | 42155 | 5 |
| B | 0 | 68458 | 4 |
| C | 0 | 41617 | 4 |
| D | 0 | 55305 | 4 |
| Quadrant | Total seconds | Saturated seconds | Saturation percentage |
|---|---|---|---|
| A | 19438 | 227 | 1.167816% |
| B | 19438 | 5255 | 27.034674% |
| C | 19438 | 267 | 1.373598% |
| D | 19438 | 757 | 3.894434% |
Noise dominated data is calculated using 1-second bins in cleaned event files. If a bin has >2000 counts, and if more than 50% of those come from <1% of pixels, then it is considered to be noise-dominated and hence unusable.
| Quadrant | # 1 sec bins | Bins with >0 counts | Bins with >2000 counts | High rate bins dominated by noise | Noise dominated (total time) | Noise dominated (detector-on time) | Marked lightcurve |
|---|---|---|---|---|---|---|---|
| A | 22064 | 19443 | 37 | 37 | 0.17% | 0.19% | 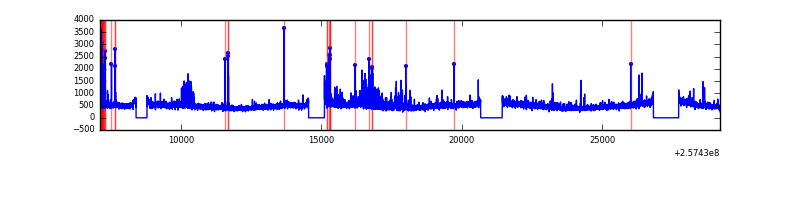 |
| B | 22064 | 19442 | 2960 | 2960 | 13.42% | 15.22% | 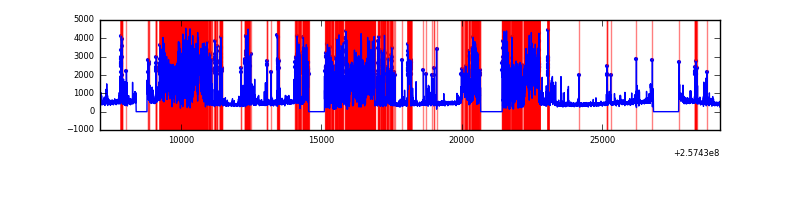 |
| C | 22064 | 19443 | 96 | 96 | 0.44% | 0.49% | 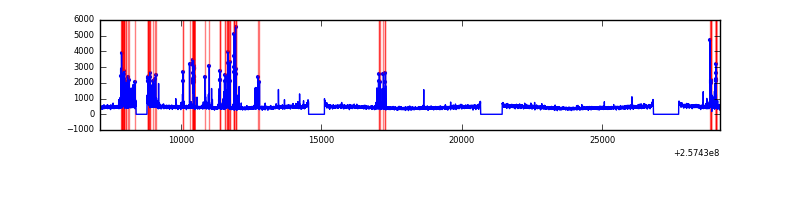 |
| D | 22064 | 19443 | 572 | 572 | 2.59% | 2.94% |  |
Top three noisy pixels from each quadrant. If the there are fewer than three noisy pixels in the level2.evt file, extra rows are filled as -1
| Pixel properties | Quadrant properties | ||||||
|---|---|---|---|---|---|---|---|
| Quadrant | DetID | PixID | Counts | Sigma | Mean | Median | Sigma |
| A | 8 | 15 | 512659 | 1126.3 | 2254 | 2202 | 453.2 |
| A | 12 | 189 | 247971 | 542.28 | 2254 | 2202 | 453.2 |
| A | 15 | 223 | 179594 | 391.41 | 2254 | 2202 | 453.2 |
| B | 4 | 239 | 10104723 | 29241.03 | 1819 | 1770 | 345.5 |
| B | 0 | 85 | 635950 | 1835.51 | 1819 | 1770 | 345.5 |
| B | 3 | 64 | 322140 | 927.25 | 1819 | 1770 | 345.5 |
| C | 15 | 208 | 821672 | 1612.48 | 2201 | 2210 | 508.2 |
| C | 13 | 61 | 16178 | 27.49 | 2201 | 2210 | 508.2 |
| C | 14 | 234 | 8999 | 13.36 | 2201 | 2210 | 508.2 |
| D | 1 | 52 | 5007684 | 9618.25 | 2171 | 2104 | 520.4 |
| D | 14 | 34 | 262581 | 500.51 | 2171 | 2104 | 520.4 |
| D | 10 | 157 | 210748 | 400.91 | 2171 | 2104 | 520.4 |
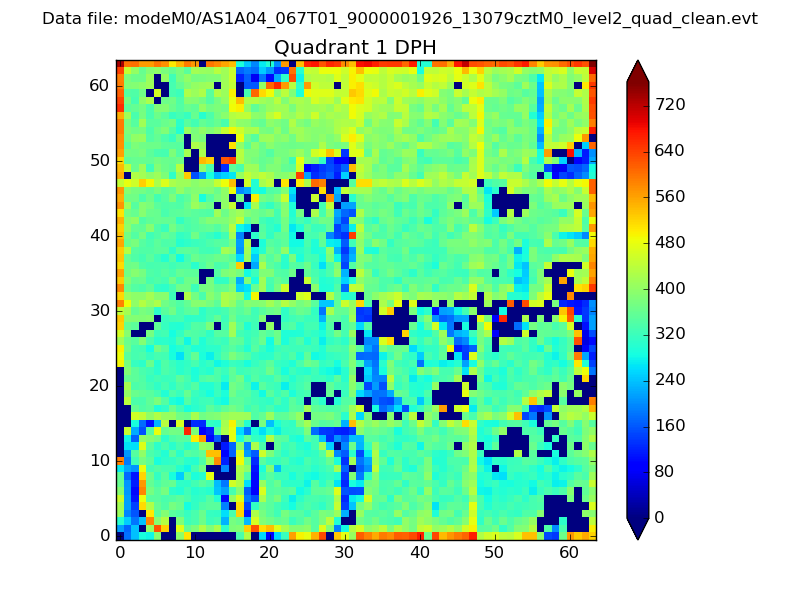
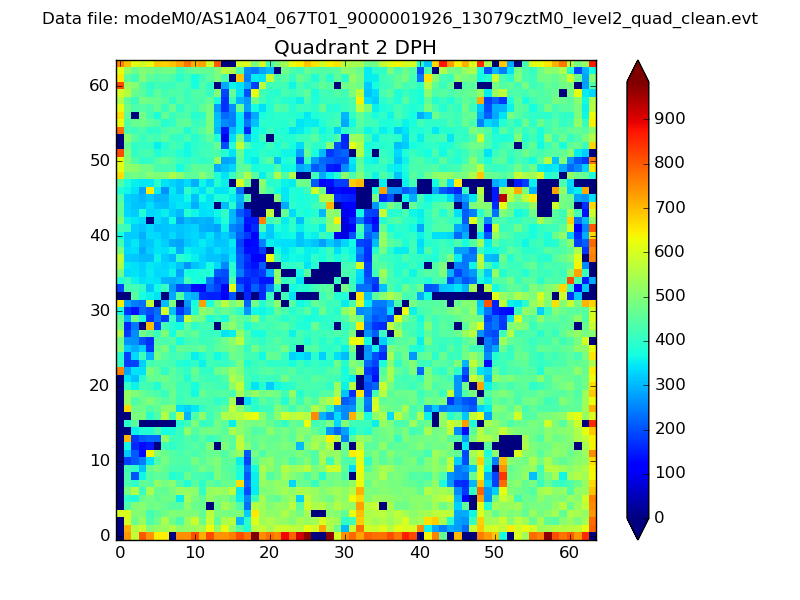
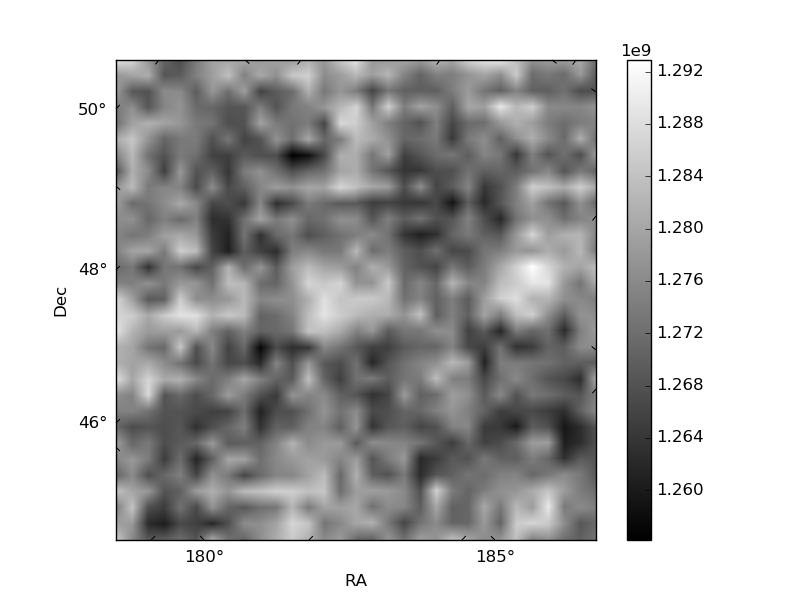
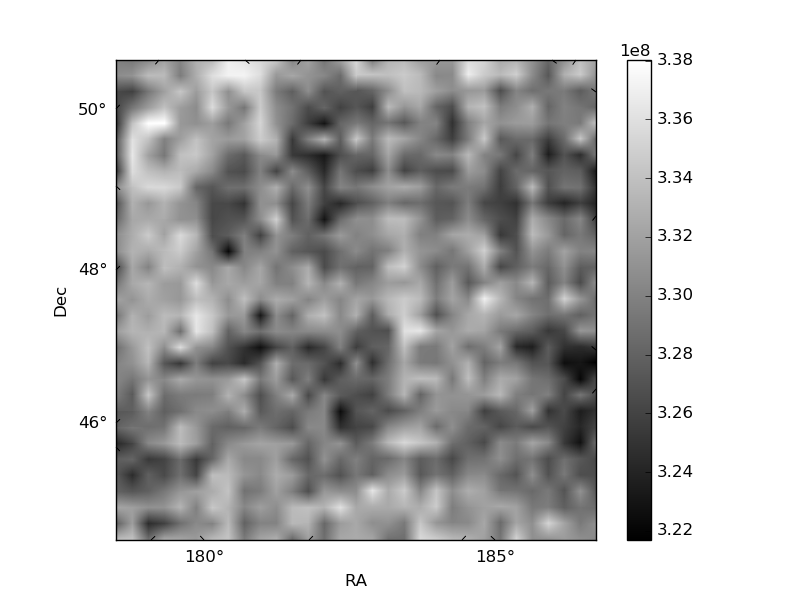
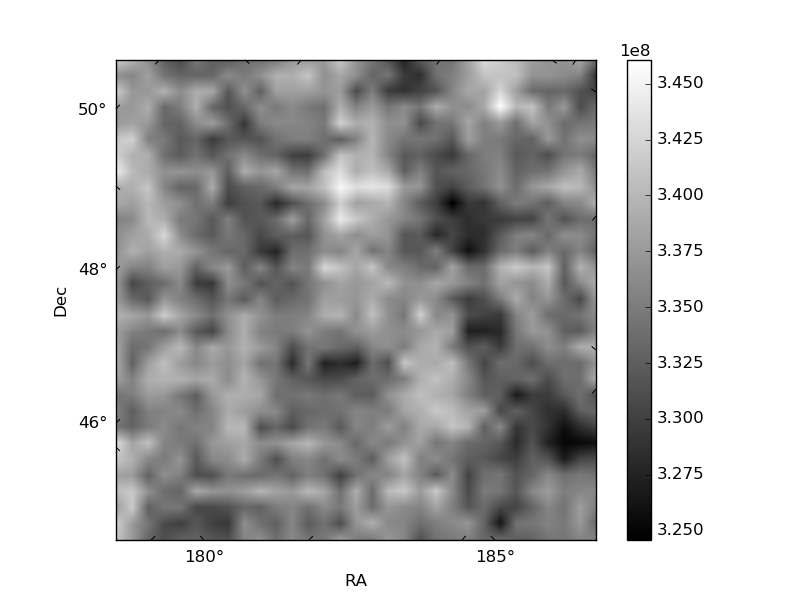
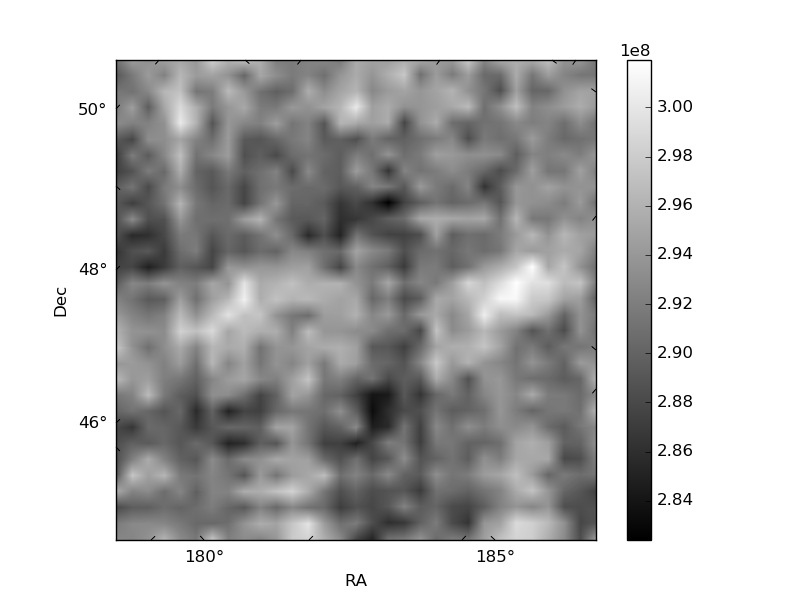
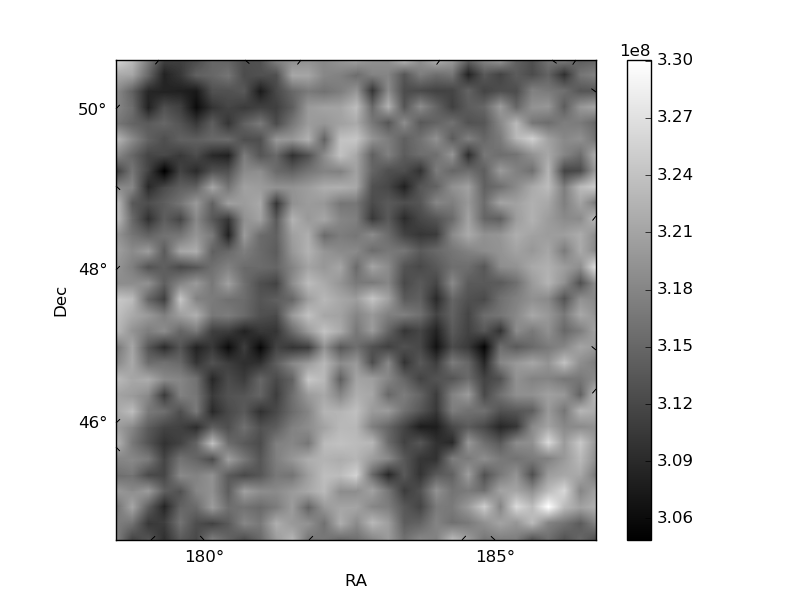
Histogram calculated using DETX and DETY for each event in the final _common_clean file
| Quadrant A | 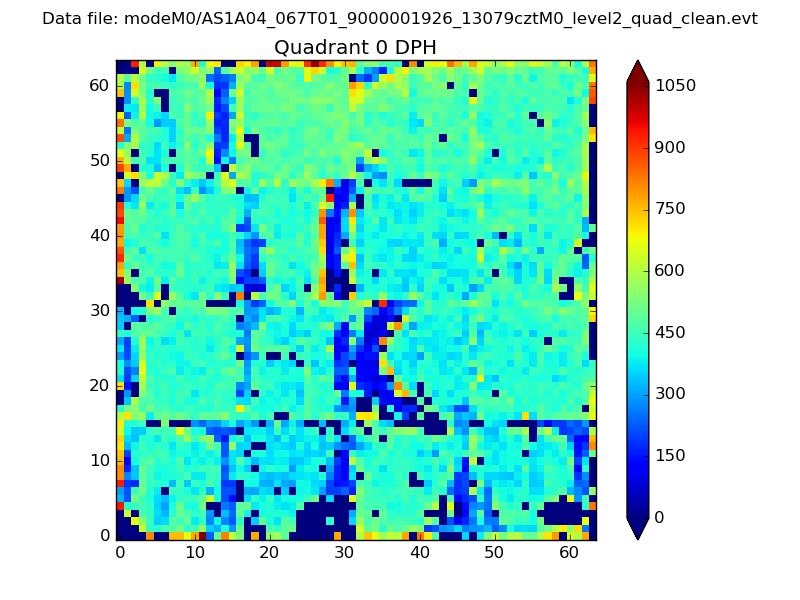 |
 |
Quadrant B |
|---|---|---|---|
| Quadrant D | 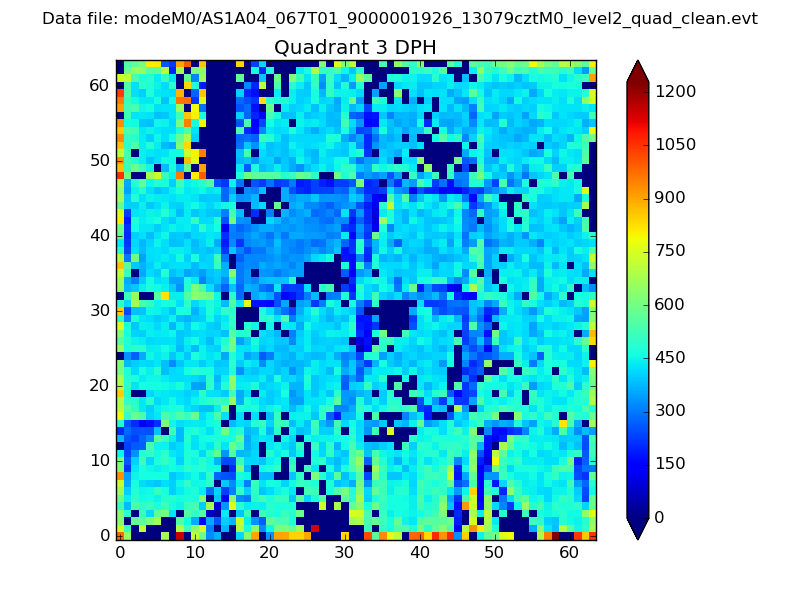 |
 |
Quadrant C |
| Plot type | Count rate plots | Images |
|---|---|---|
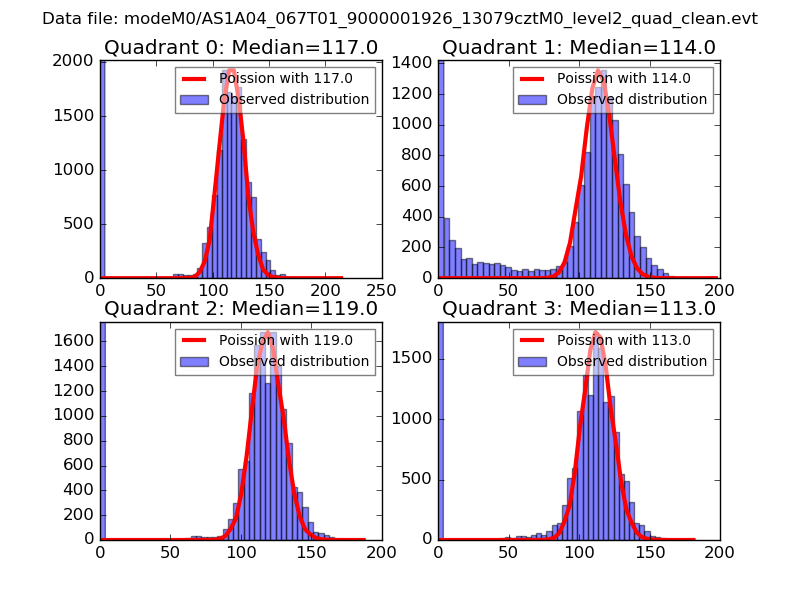
| Comparison with Poisson distribution Blue bars denote a histogram of data divided into 1 sec bins. Red curve is a Poisson curve with rate = median count rate of data. |
 |
 |
| Quadrant-wise count rates Data is divided into 100 sec bins |
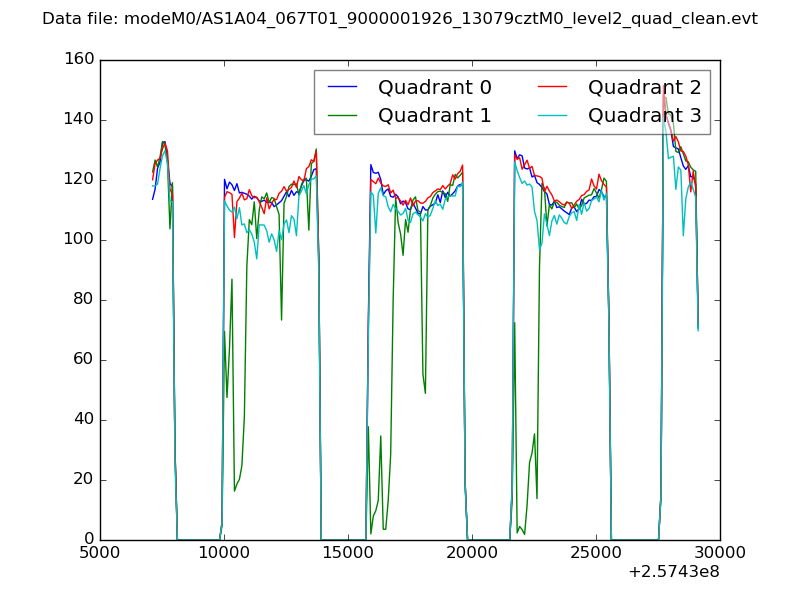 |
|
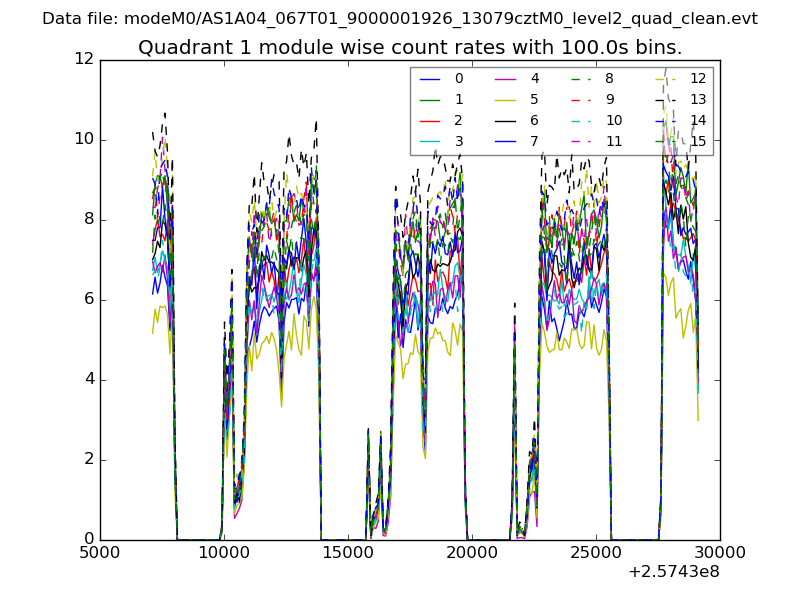
| Module-wise count rates for Quadrant A Data is divided into 100 sec bins |
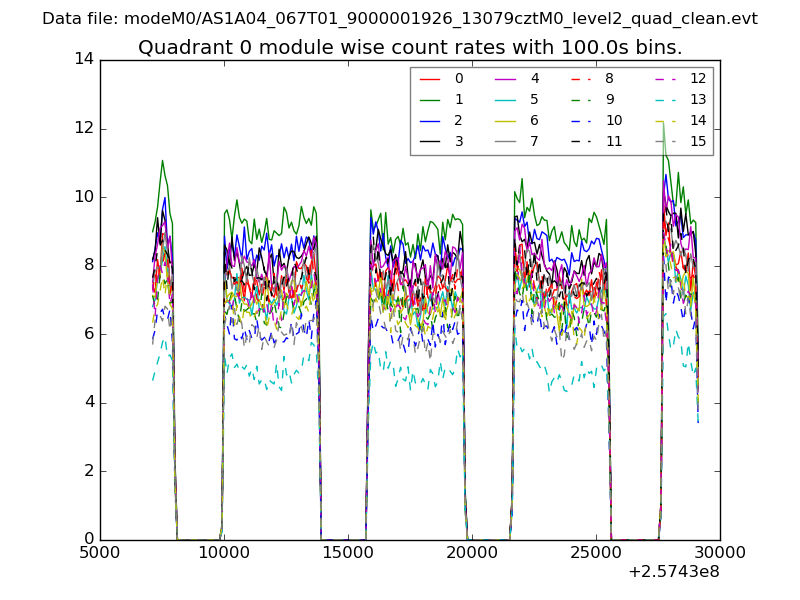 |
 |
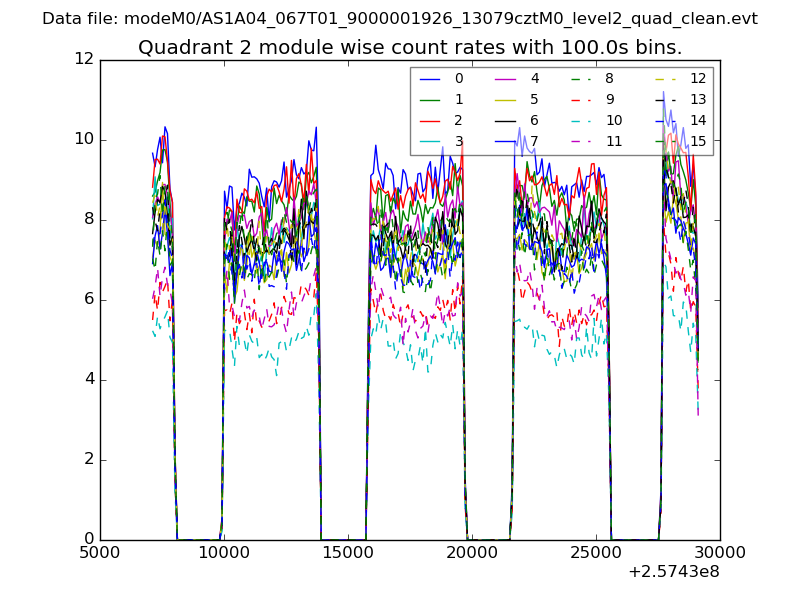
| Module-wise count rates for Quadrant B Data is divided into 100 sec bins |
 |
 |
| Module-wise count rates for Quadrant C Data is divided into 100 sec bins |
 |
 |
| Module-wise count rates for Quadrant D Data is divided into 100 sec bins |
 |
 |
| Parameter | Plot |
|---|---|
| CZT HV Monitor | 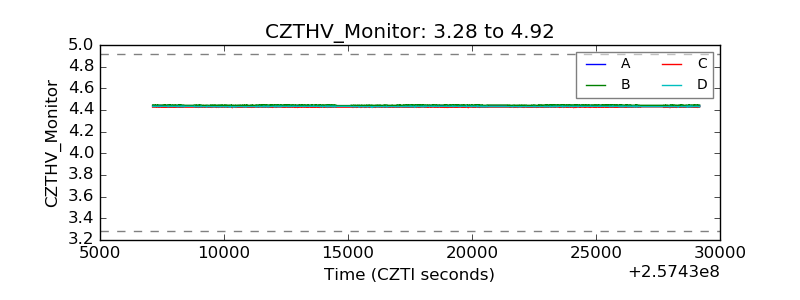 |
| D_VDD | 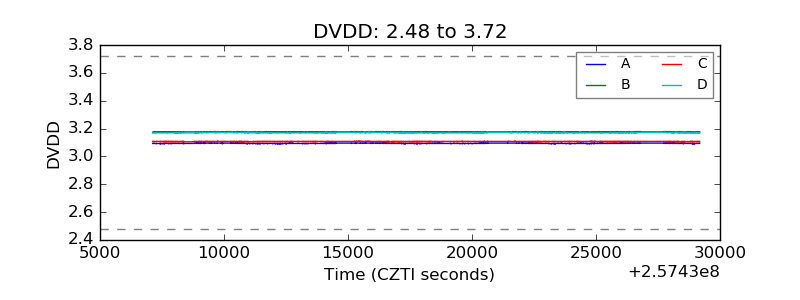 |
| Temperature 1 | 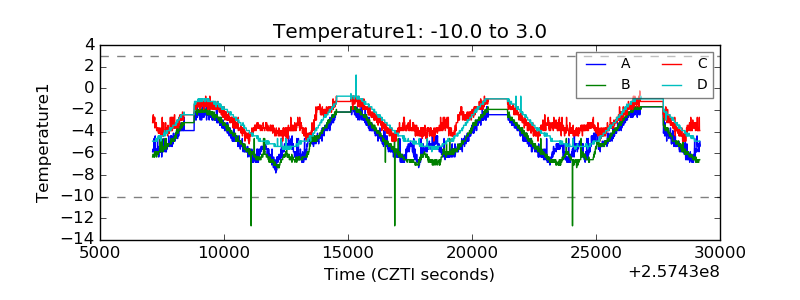 |
| Veto HV Monitor | 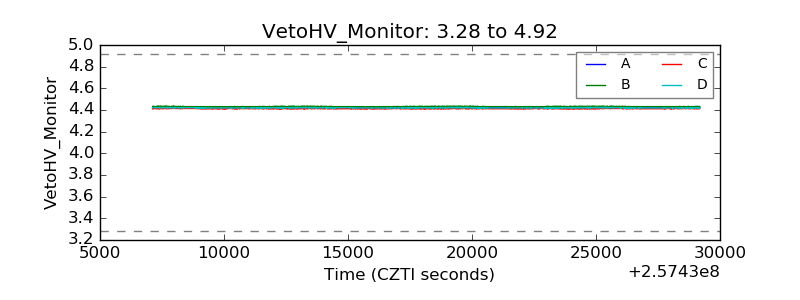 |
| Veto LLD | 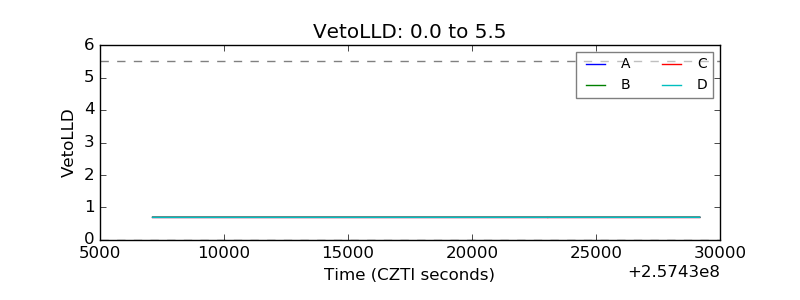 |
| Alpha Counter | 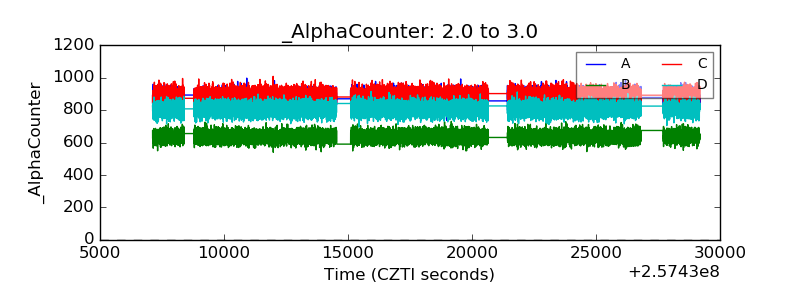 |
| _CPM_Rate | 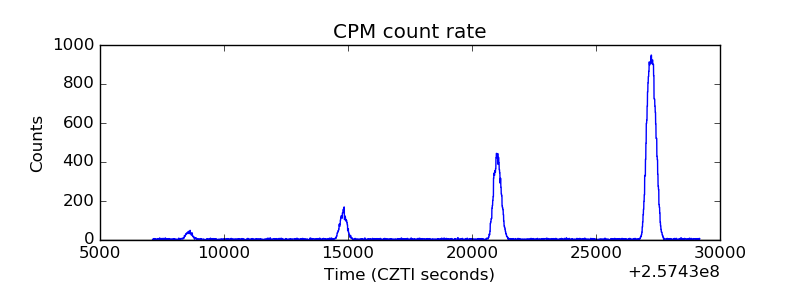 |
| CZT Counter | 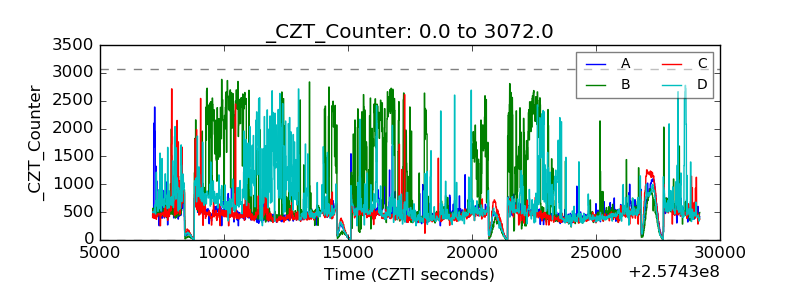 |
| +2.5 Volts monitor |  |
| +5 Volts monitor |  |
| _ROLL_ROT | 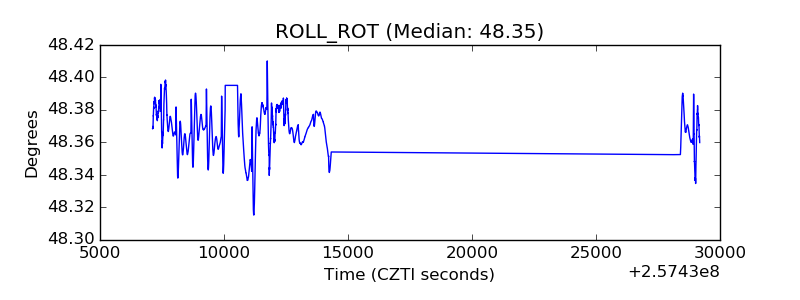 |
| _Roll_DEC | 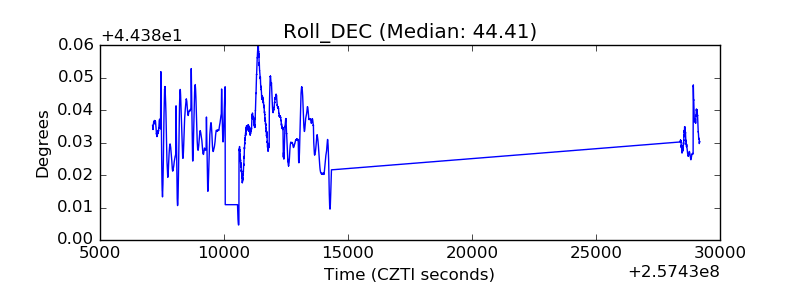 |
| _Roll_RA | 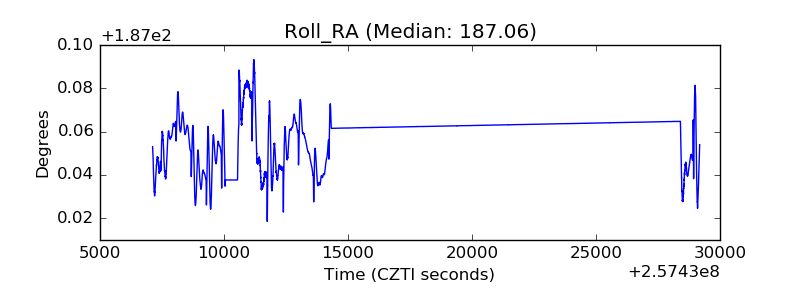 |
| Veto Counter | 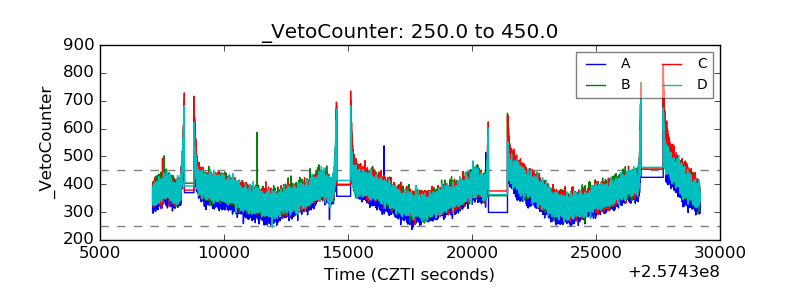 |