| Param | Original file | Final file |
|---|---|---|
| Filename | modeM0/AS1A04_067T01_9000001926_13080cztM0_level2.evt | modeM0/AS1A04_067T01_9000001926_13080cztM0_level2_quad_clean.evt |
| Size (bytes) | 532,157,760 | 98,398,080 |
| Size | 507.5 MB | 93.8 MB |
| Events in quadrant A | 3,126,939 | 633,529 |
| Events in quadrant B | 3,882,334 | 642,905 |
| Events in quadrant C | 3,089,440 | 648,655 |
| Events in quadrant D | 5,568,453 | 593,212 |
| Mode M9 | |||
|---|---|---|---|
| Quadrant | BADHDUFLAG | Total packets | Discarded packets |
| A | 0 | 11 | 0 |
| B | 0 | 11 | 0 |
| C | 0 | 11 | 0 |
| D | 0 | 12 | 0 |
| Mode SS | |||
|---|---|---|---|
| Quadrant | BADHDUFLAG | Total packets | Discarded packets |
| A | 0 | 134 | 0 |
| B | 0 | 134 | 0 |
| C | 0 | 134 | 0 |
| D | 0 | 134 | 0 |
| Mode M0 | |||
|---|---|---|---|
| Quadrant | BADHDUFLAG | Total packets | Discarded packets |
| A | 0 | 13942 | 3 |
| B | 0 | 16172 | 2 |
| C | 0 | 13877 | 2 |
| D | 0 | 21631 | 2 |
| Quadrant | Total seconds | Saturated seconds | Saturation percentage |
|---|---|---|---|
| A | 6618 | 16 | 0.241765% |
| B | 6618 | 319 | 4.820187% |
| C | 6618 | 29 | 0.438199% |
| D | 6618 | 828 | 12.511333% |
Noise dominated data is calculated using 1-second bins in cleaned event files. If a bin has >2000 counts, and if more than 50% of those come from <1% of pixels, then it is considered to be noise-dominated and hence unusable.
| Quadrant | # 1 sec bins | Bins with >0 counts | Bins with >2000 counts | High rate bins dominated by noise | Noise dominated (total time) | Noise dominated (detector-on time) | Marked lightcurve |
|---|---|---|---|---|---|---|---|
| A | 7664 | 6620 | 0 | 0 | 0.00% | 0.00% | 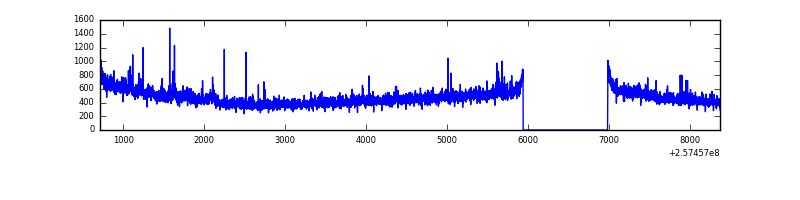 |
| B | 7664 | 6620 | 154 | 154 | 2.01% | 2.33% | 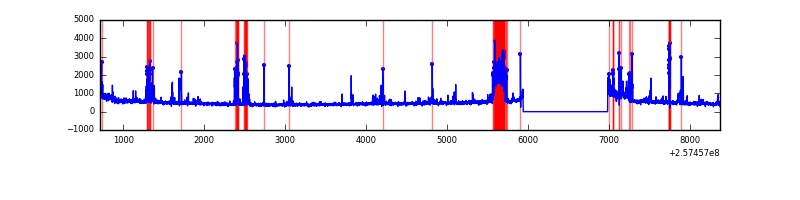 |
| C | 7664 | 6620 | 13 | 13 | 0.17% | 0.20% | 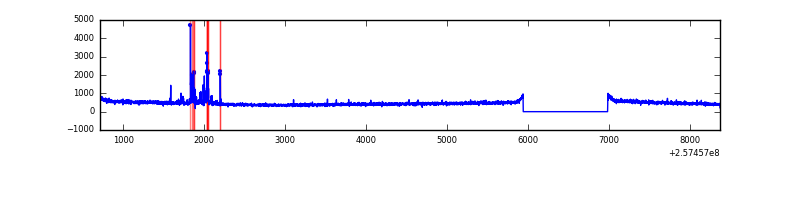 |
| D | 7664 | 6620 | 581 | 581 | 7.58% | 8.78% | 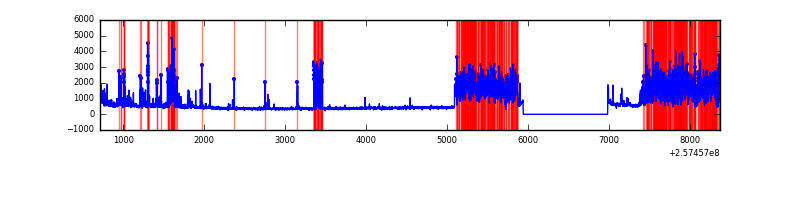 |
Top three noisy pixels from each quadrant. If the there are fewer than three noisy pixels in the level2.evt file, extra rows are filled as -1
| Pixel properties | Quadrant properties | ||||||
|---|---|---|---|---|---|---|---|
| Quadrant | DetID | PixID | Counts | Sigma | Mean | Median | Sigma |
| A | 8 | 15 | 80087 | 504.11 | 772 | 755 | 157.4 |
| A | 12 | 189 | 42304 | 264.02 | 772 | 755 | 157.4 |
| A | 13 | 248 | 10717 | 63.3 | 772 | 755 | 157.4 |
| B | 0 | 85 | 649502 | 4467.02 | 765 | 745 | 145.2 |
| B | 3 | 64 | 67378 | 458.8 | 765 | 745 | 145.2 |
| B | 0 | 230 | 45521 | 308.31 | 765 | 745 | 145.2 |
| C | 15 | 208 | 110210 | 617.98 | 763 | 766 | 177.1 |
| C | 13 | 61 | 5560 | 27.07 | 763 | 766 | 177.1 |
| C | 12 | 4 | 2811 | 11.55 | 763 | 766 | 177.1 |
| D | 1 | 52 | 2429779 | 13986.28 | 728 | 706 | 173.7 |
| D | 14 | 34 | 143261 | 820.81 | 728 | 706 | 173.7 |
| D | 5 | 222 | 126586 | 724.8 | 728 | 706 | 173.7 |
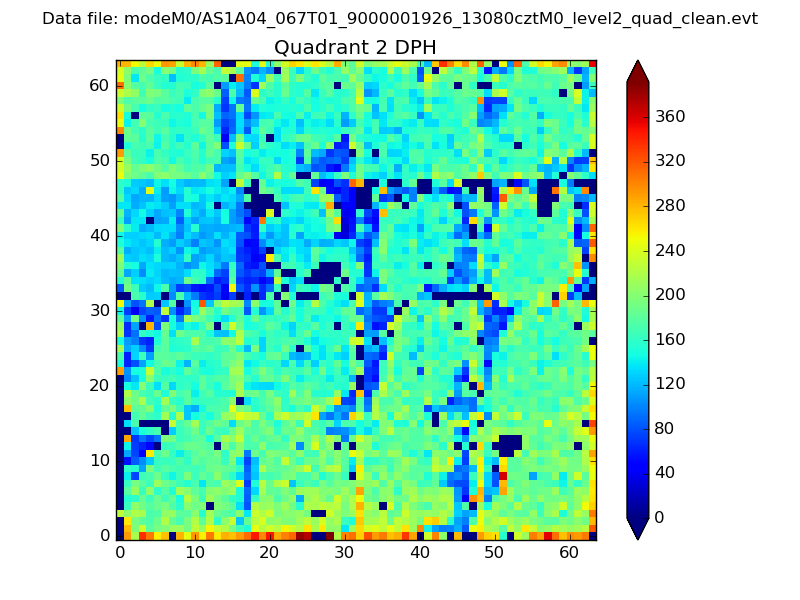
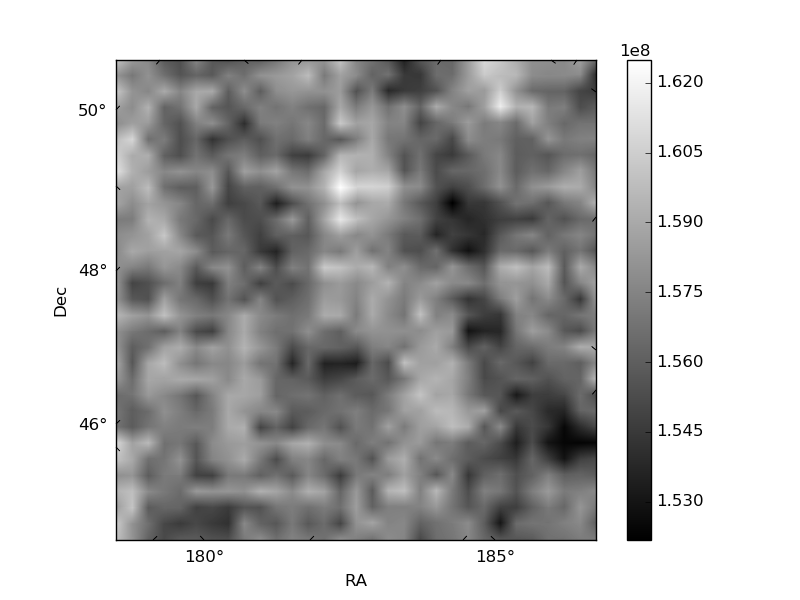
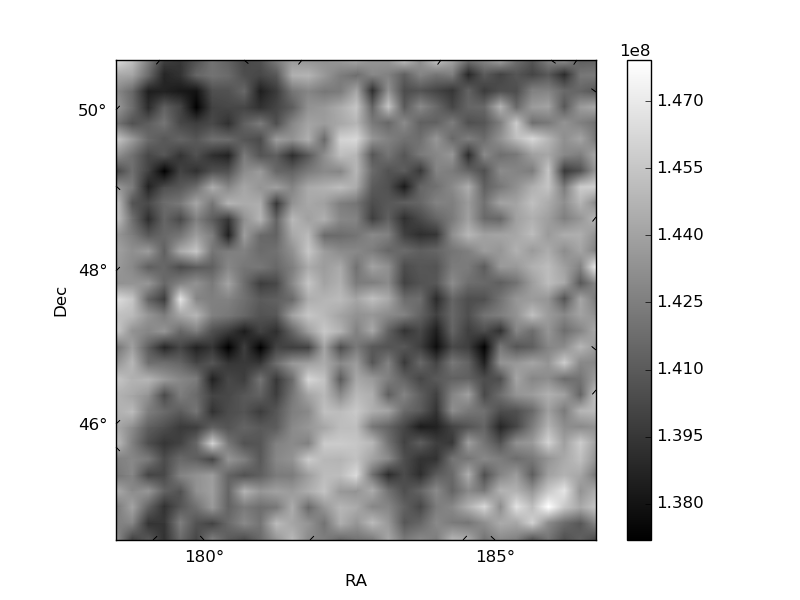
Histogram calculated using DETX and DETY for each event in the final _common_clean file
| Quadrant A | 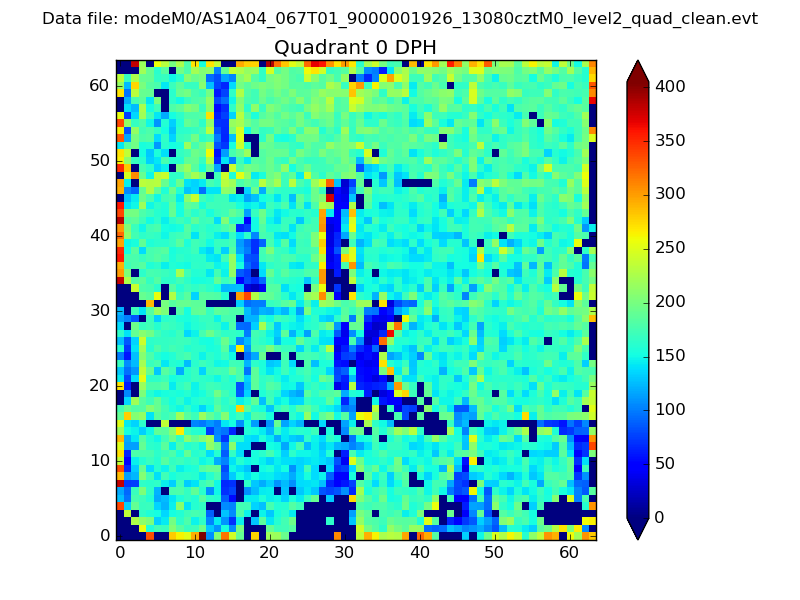 |
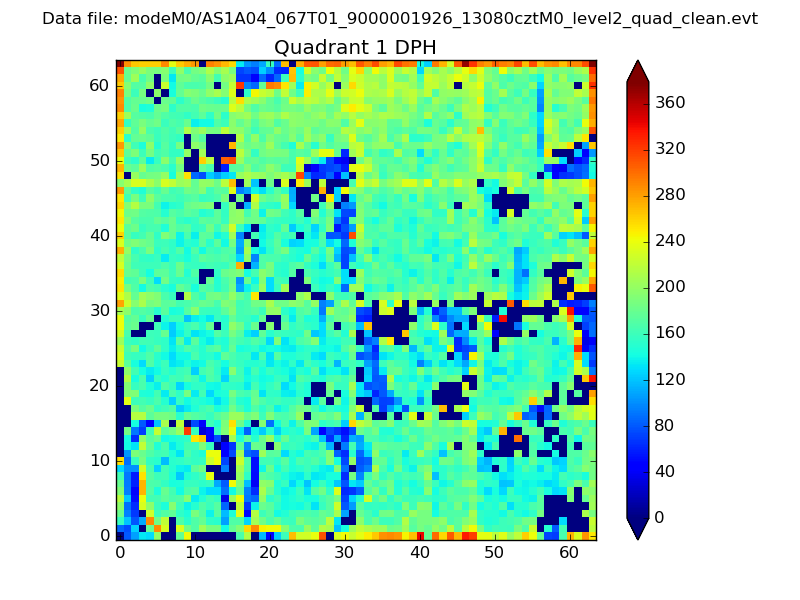 |
Quadrant B |
|---|---|---|---|
| Quadrant D | 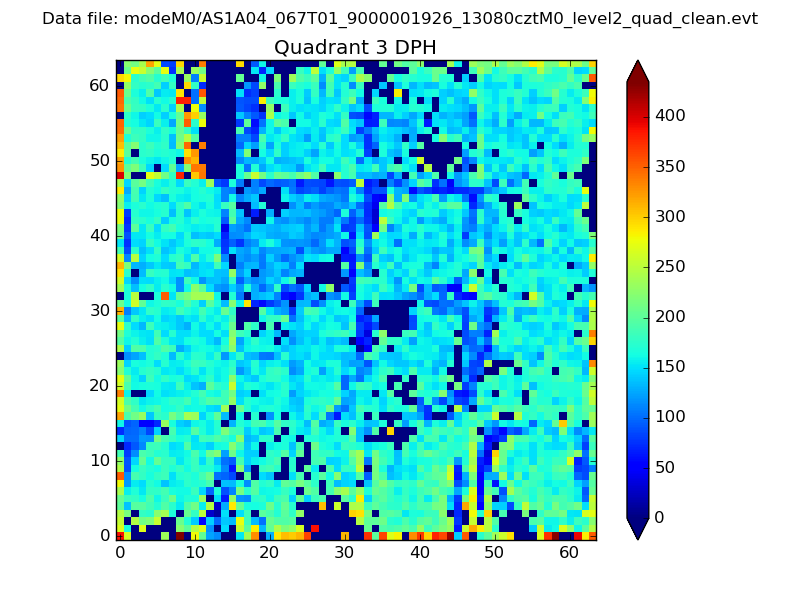 |
 |
Quadrant C |
| Plot type | Count rate plots | Images |
|---|---|---|
| Comparison with Poisson distribution Blue bars denote a histogram of data divided into 1 sec bins. Red curve is a Poisson curve with rate = median count rate of data. |
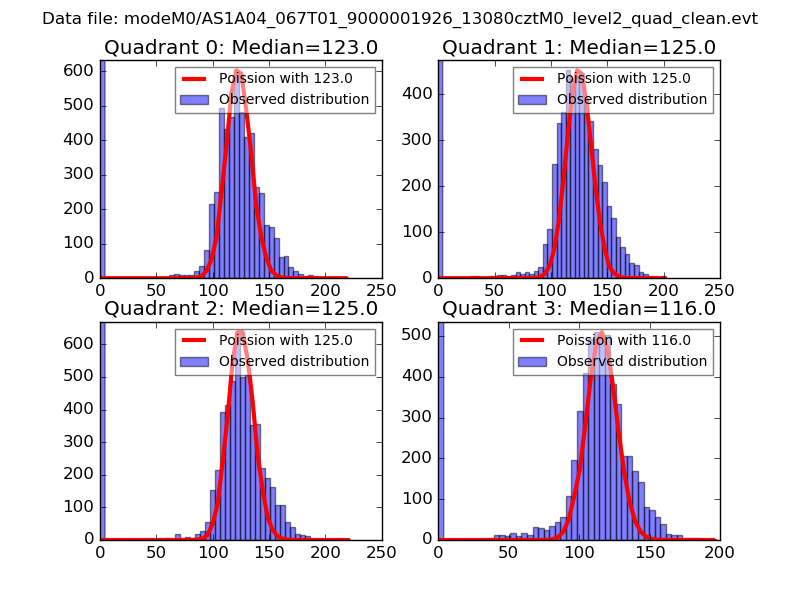 |
 |
| Quadrant-wise count rates Data is divided into 100 sec bins |
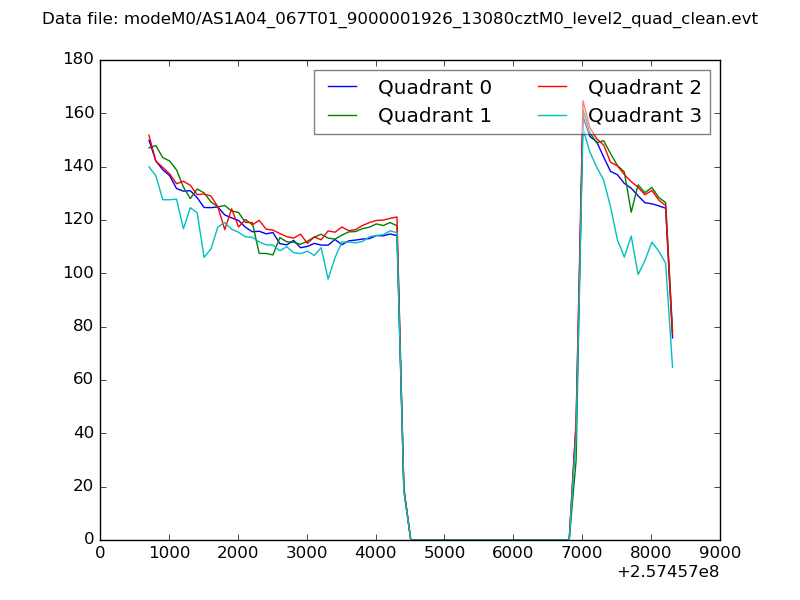 |
|
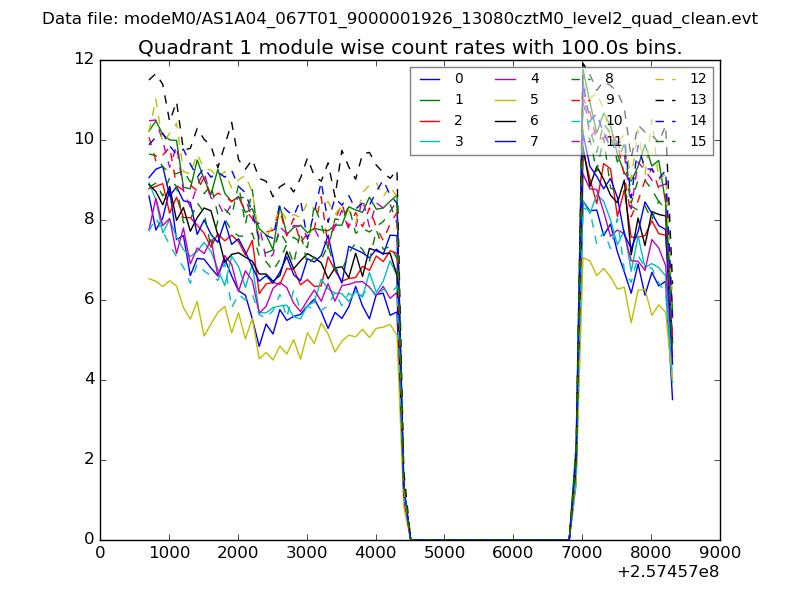
| Module-wise count rates for Quadrant A Data is divided into 100 sec bins |
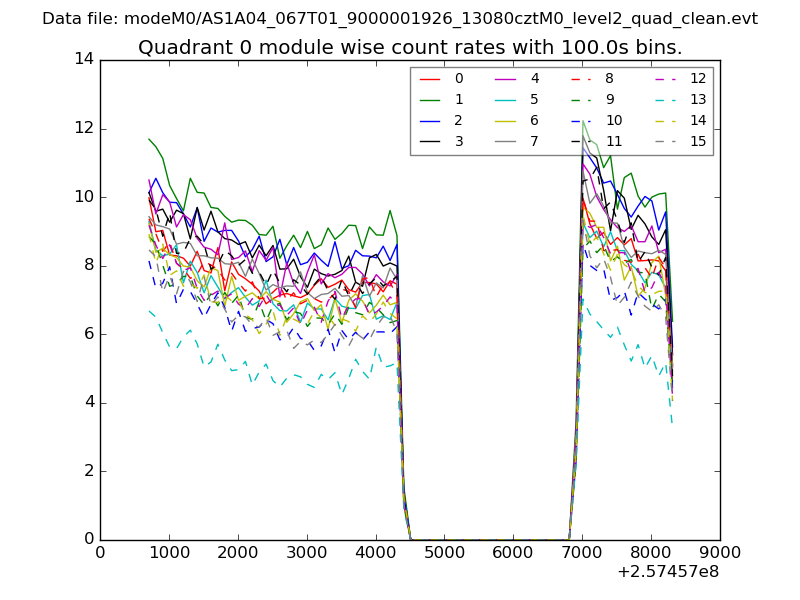 |
 |
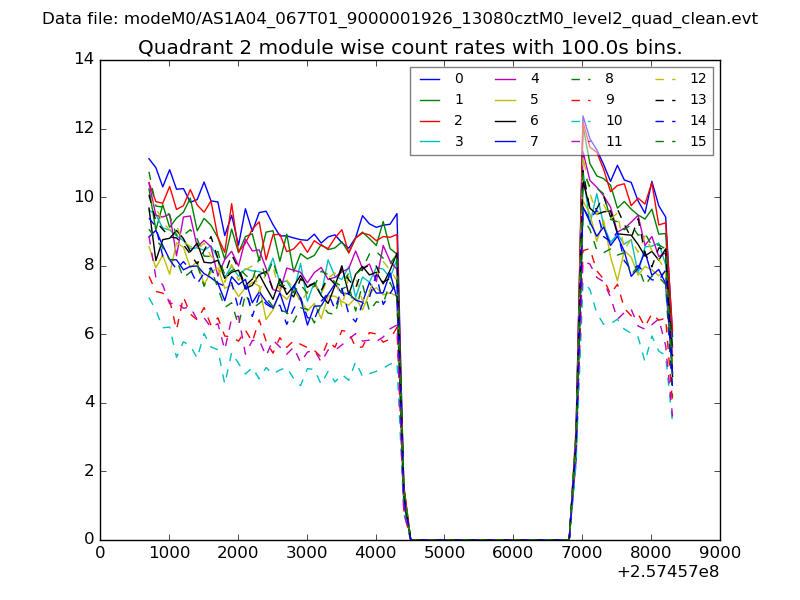
| Module-wise count rates for Quadrant B Data is divided into 100 sec bins |
 |
 |
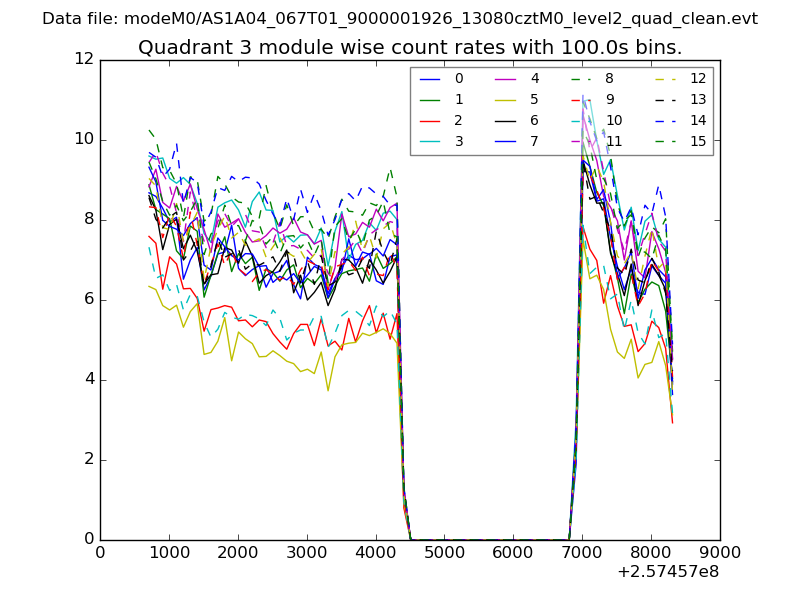
| Module-wise count rates for Quadrant C Data is divided into 100 sec bins |
 |
 |
| Module-wise count rates for Quadrant D Data is divided into 100 sec bins |
 |
 |
| Parameter | Plot |
|---|---|
| CZT HV Monitor | 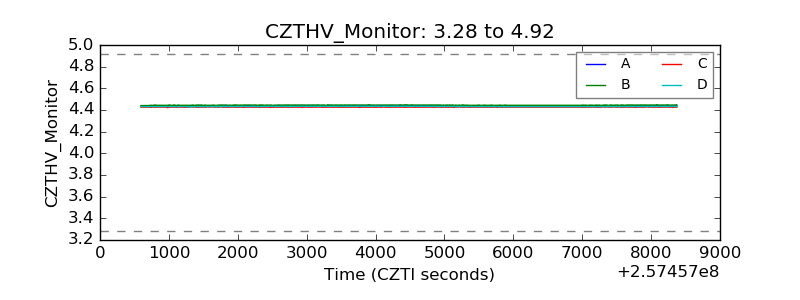 |
| D_VDD | 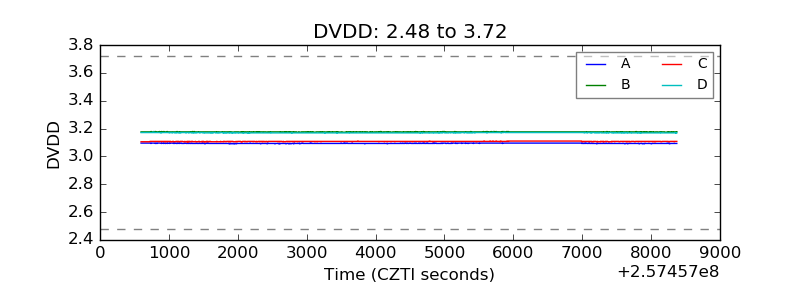 |
| Temperature 1 | 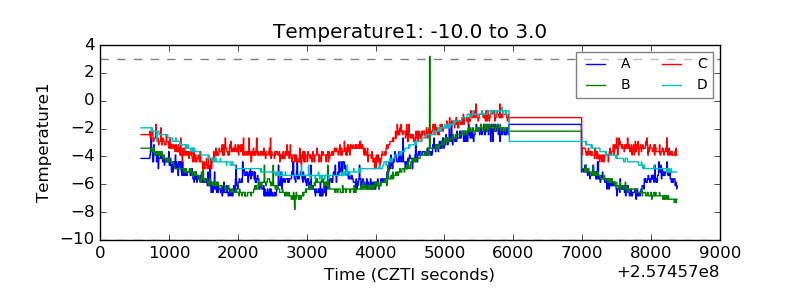 |
| Veto HV Monitor | 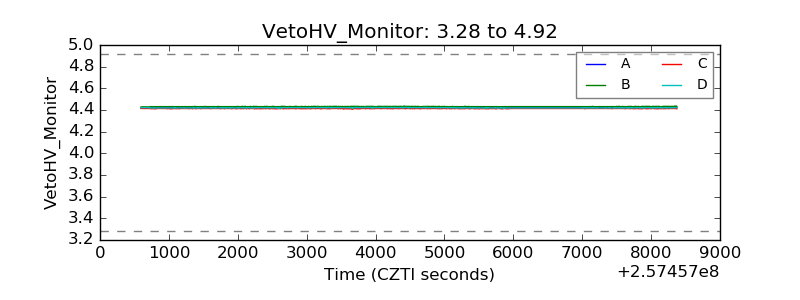 |
| Veto LLD | 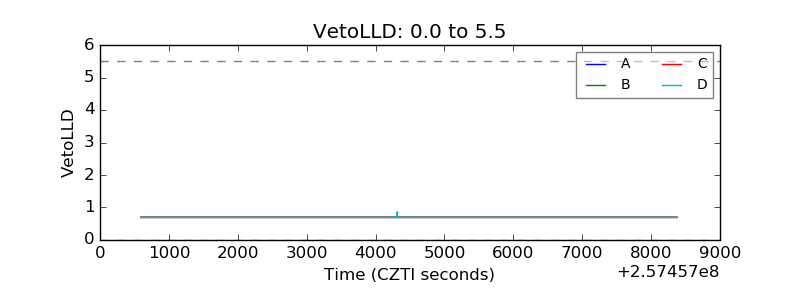 |
| Alpha Counter | 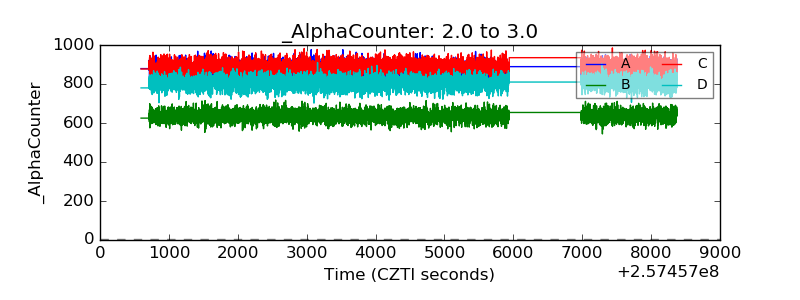 |
| _CPM_Rate | 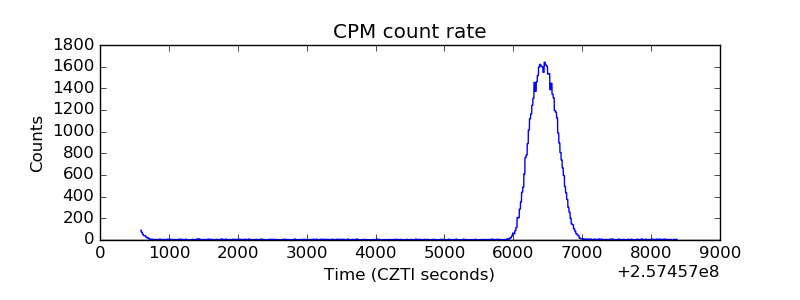 |
| CZT Counter | 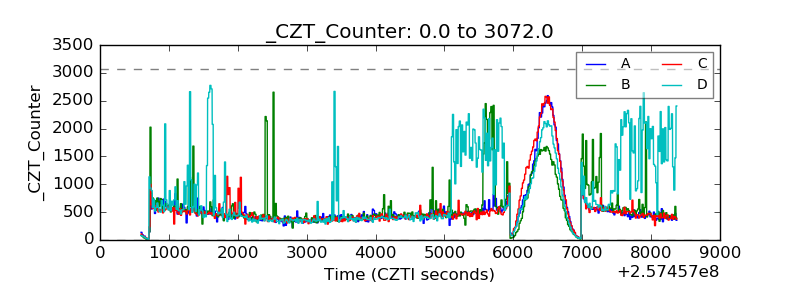 |
| +2.5 Volts monitor |  |
| +5 Volts monitor |  |
| _ROLL_ROT | 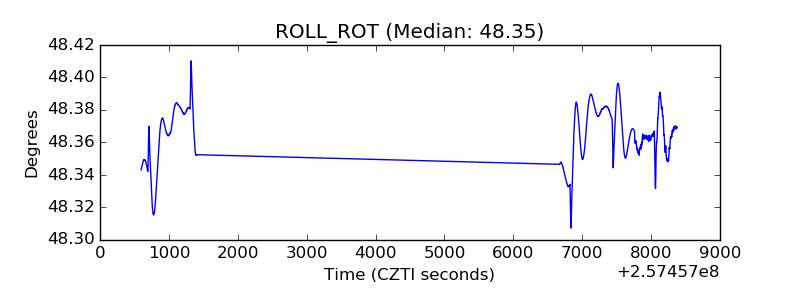 |
| _Roll_DEC | 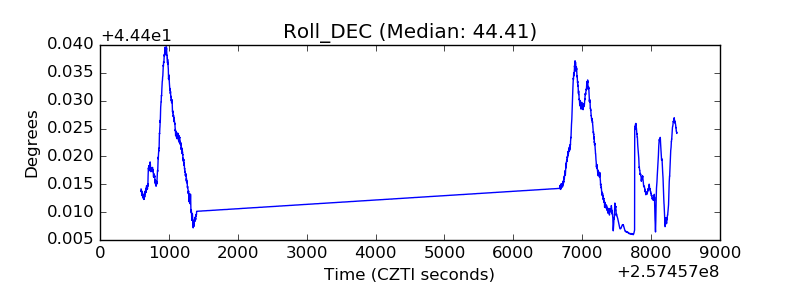 |
| _Roll_RA |  |
| Veto Counter | 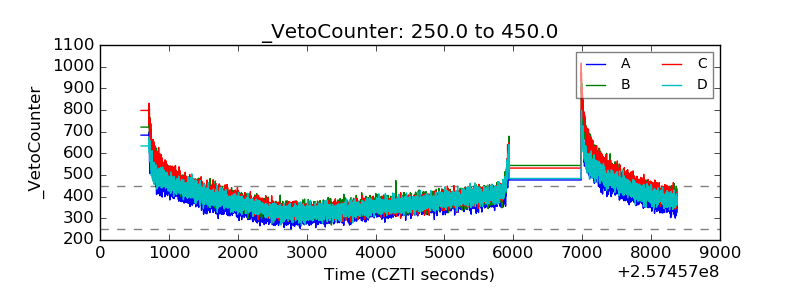 |